

Challenges of Over-Nutrition and Hypertension in India
“`html
Challenges in halting the rise in over-nutrition, adiposity and hypertension in India
Prema Ramachandran, Honey Kumari, K. Kalaivani
OPEN ACCESS
PUBLISHED 31 October 2025
CITATION Ramachandran, P., Kumari, H., Kalaivani, K., 2025. Challenges in halting the rise in over-nutrition, adiposity and hypertension in India. Medical Research Archives, [online] 13(10). https://doi.org/10.18103/mra.v13i10.6945
ABSTRACT
Globally there had been sustained increase in over-nutrition, adiposity, hypertension and morbidity and mortality due to cardiovascular diseases (CVD) in the last three decades. In India over-nutrition rates have doubled in two decades. Over-nutrition, and adiposity especially abdominal adiposity rank as major risk factors for high prevalence of hypertension and CVD in Indians. Age-standardized CVD death rate in Indians is higher than the global average. Some of the contributing factors for this higher CVD mortality in Indians include the earlier age of onset, low detection in the early asymptomatic phase of hypertension, poor coverage and high discontinuation of treatment for hypertension. The present study was undertaken in adults from urban low middle-income families to explore:
- changes in blood pressure in relation to age, Body Mass Index (BMI), fat mass index (FMI), visceral fat grades, abdominal adiposity;
- whether prior screening of adults by age, BMI or abdominal adiposity and then undertaking blood pressure screening in identified high risk groups could reduce the number to be screened without missing those who had hypertension.
The profile of the study population was similar to the Indian urban low middle-income population documented in national surveys. One fourth of men and women below 30 years and over 2/3rd of women beyond 50 years were over-nourished. Nearly a third of women below 30 years and over 80% of women beyond 50 years of age had abdominal adiposity. There was progressive increase in fat mass index with increase in age and BMI both in men and women. Among men below 30 years of age 10% had hypertension. There was a progressive increase in prevalence of hypertension with increase in age; one fourth of women and one third of men beyond 50 years had hypertension. Age ≥ 30 years, BMI ≥ 25, high adiposity as assessed by fat mass and fat mass index, high abdominal adiposity as assessed by waist circumference (WC), waist hip ratio (WHR), waist height ratio (WHtR) and high visceral fat were statistically significant risk factors for hypertension in men and women. Screening only persons with BMI ≥ 25 reduced the work load by 50% but resulted in detection of only 76.7% of all hypertensive women and 54.1% of hypertensive men. Circumferential measurements take more time than blood pressure measurements. The paramedical persons are not well trained in taking circumferential measurements. Therefore, these parameters are not suitable for use as a preliminary screening procedure. Bioelectrical impedance analysis machines are not available in health care settings and so fat mass measurement cannot be used for preliminary screening. Screening adults beyond 30 years for hypertension reduced the work load by about 30% and ensured that over 85% of all hypertensive persons are detected. Ascertainment of age can be done quickly in both hospital and community settings. The current guidelines under the National NCD control programme envisaging blood pressure screening of all adults beyond 30 years of age is the rational and feasible option for reducing the work load and providing effective screening for hypertension.
Keywords: over-nutrition, adiposity, hypertension, cardiovascular diseases, India
Introduction
Globally there had been a four-fold increase in over-nutrition [body mass index (BMI) ≥25], between 1990 and 2020; over-nourished women outnumber men. The rise in over-nutrition was higher in low and middle-income countries undergoing nutrition transition. Global data indicate that there has been a progressive increase in body weight with increase in age. Increase in body weight was mainly due to increase in body fat. Intensive efforts to prevent, detect and manage over-nutrition and adiposity have not been successful in preventing progressive rise in over-nutrition across countries. Sustainable Development Goals (SDG) has therefore set the target of halting the rise in over-nutrition by 2030. The concern over the rising over-nutrition is mainly due to associated rise in prevalence of non-communicable diseases (NCD) especially hypertension and diabetes and premature death due to NCD. Mortality from cardiovascular diseases (CVD) attributable to high BMI had more than doubled in three decades. In 2021, high BMI accounted for nearly 1 in 10 of all CVD deaths. Adiposity, especially abdominal adiposity was associated with metabolic changes including dyslipidaemia and insulin resistance. These changes were associated with increase in risk of hypertension and diabetes. Risk factors associated with CVD such as age, smoking, sedentary life style, over-nutrition, adiposity, hypertension, diabetes are similar in developed and developing countries. There are substantial variations between countries and regions both in prevalence of each of these risk factors and prevalence of CVD. Since 1990, the ranking for high BMI as a risk factor for CVD had increased substantially as compared to other risk factors, especially in low and middle income countries.
There are substantial differences in the age-standardized CVD mortality rate attributable to high BMI between regions. CVD mortality ranged from 14.4 deaths per 100,000 persons in high-income regions to 67.5 deaths per 100,000 people in North Africa and the Middle East. In 2021, there were an estimated 300,000 more CVD deaths globally attributable to high BMI among women compared with men. Prevalence of obesity and hypertension was higher in high income countries. Despite this, mortality due to CVD came down in high income countries from 23.4 to 14.4%. This might be attributable to early detection and effective management of hypertension, resulting in reduction in the morbidity and mortality associated with over-nutrition and CVD. SDG has set the target of reducing premature mortality from NCDs by one-third by 2030.
India is undergoing a relatively rapid demographic and socio-economic transition; there is slower but sustained increase in over-nutrition. In Indians, hypertension and diabetes occur at a younger age and at a lower BMI. The higher adiposity for a given BMI and abdominal adiposity in Indians might be responsible for this phenomenon. Currently one fourth of men and one fifth of women have hypertension. There are substantial inter-state and urban-rural differences in prevalence of over-nutrition and CVD. About a third of Indian infants are born with low birthweight. These children follow a lower trajectory of growth and remain small statured during childhood, adolescence and adult life. Some of these children move over to a higher trajectory of BMI in infancy, childhood or adolescence. Though none of these children were overweight as assessed by WHO child growth standards, such children had higher triglyceride and cholesterol levels and showed insulin resistance and developed hypertension and diabetes in their early thirties. Taking all these factors into account, over-nutrition, and adiposity especially abdominal adiposity appear to be major risk factors for high prevalence of hypertension and CVD occurring at an earlier age in Indians. India’s CVD component of the non-communicable disease control programme envisages that screening of blood pressure should be done in all adults aged 30 years or above. Screening of half of the country’s 1.4 billion population is a daunting task. So far, none of the studies had explored whether screening adults for over-nutrition, adiposity and abdominal adiposity and selecting the high-risk persons for blood pressure screening, could reduce the work load without compromising the detection of hypertension in asymptomatic individuals.
The present study was undertaken in adults from urban low middle-income families to explore:
- changes in blood pressure in relation to age, BMI, fat mass index (FMI), visceral fat grades, abdominal adiposity;
- whether prior screening of adults by age, BMI or abdominal adiposity and then undertaking blood pressure screening in identified high risk groups could reduce the number of persons to be screened without missing those who had hypertension.
Data from the study will be of use to the ongoing comprehensive programme for early detection and effective management of CVD.
Material and methods
A census of all the households of urban middle-income families in the selected Integrated Child Development Services (ICDS) blocks in south west Delhi was done. The proposed study details were discussed with the families and the study information sheet was given to them. A week later the families were contacted. Informed consent was obtained from adults who were apparently healthy and willing to participate in this cross-sectional observational study.
Inclusion criteria were:
- apparently healthy adults (age ≥18 years) from low middle-income group, residing in the selected South Delhi ICDS blocks, and
- consented to participate in the study.
Exclusion criteria were:
- children and pregnant women,
- persons who were not from low middle-income group, and
- not willing to participate in the study.
Information on socio-demographic profile of the families was ascertained and recorded in a pre-coded proforma. Height was measured using stature meter with accuracy of 0.1 cm; weight was measured using a portable digital balance with accuracy of 100 g, and BMI was computed. Mid upper arm circumference (MUAC), waist and hip circumference (WC and HC) were measured using a non-stretch vernier tape and waist hip ratio (WHR), waist height ratio (WHtR) were computed. Body composition (fat mass, fat free mass, visceral fat) was measured using TANITA 780 MA portable bioelectrical impedance analyser (BIA) machine; fat mass index and fat free mass index were computed. Blood pressure was measured using digital blood pressure monitor. The study was approved by the Institutional Ethics Committee. Permission to carry out the study in the defined ICDS blocks was obtained from the Deptt of Women and Child Development, National Capital Region.
Data entry was done in MS excel; data cleaning was done using MS excel and SPSS 30. Data analysis was done with SPSS version 30 and Stata version 15. To define the profile of the study population, means and standard deviation were computed for continuous variables. Student t test was used to assess the statistical significance of the observed inter-group differences in the continuous variables. For categorical variables percent prevalence was computed. Chi square test was used to assess the statistical significance of observed inter-group variations in categorical variables. Data from the study were also analysed to assess:
- changes with age in BMI, fat mass index (FMI), visceral fat (visc fat) grades, abdominal adiposity and blood pressure,
- changes in blood pressure in relation to age, over-nutrition and abdominal adiposity, and
- whether prior screening of adults by age, BMI or abdominal adiposity and then undertaking blood pressure screening in identified high risk groups could reduce the number of persons to be screened without missing those who had hypertension.
Results
SOCIO-DEMOGRAPHIC PROFILE
Analysis of data on socio-demographic profile of the study families showed that two-thirds were nuclear families with five or less members. Three-fourth of the men and over half of the women had secondary school education. Over half of the men were semi-skilled workers; one-fifth worked in petty white-collar jobs. Over 90% of women were home makers. Over 95% of households lived in brick-and-mortar buildings; about one-third owned their two or three-room tenement homes; the rest were mostly migrant labourers who lived in rented one or two room tenements. Over 95% had access to piped water supply at home or in the near vicinity and access to flush toilets either in their own home or shared with other households. For cooking almost all used Liquefied Petroleum Gas (LPG) and stainless-steel utensils. Over 98% owned colour television (TV) and mobile phones; these were their main source of entertainment. These families stated that they were food secure, had adequate income to meet the essential household needs, education of children and primary health care; but because of urban housing constraints, they lived in one or two room tenements in overcrowded unhygienic localities.
CHANGES IN ANTHROPOMETRY AND NUTRITIONAL STATUS IN RELATION TO AGE
Men were taller and heavier as compared to women at all age groups. The mean height for women across age groups was 152 cm and that of men was 165 cm. Both in men and women there were no differences in the mean height in relation to age. Mean weight showed substantial and statistically significant increase between 18-29 and 30-49 years in men and women. The increase in mean body weight between 30-49 and ≥50-years was relatively small. Mean BMI of men and women in the 18-29 years age group was similar; beyond 30 years, the mean BMI was higher in women as compared to the men.
| Age (yrs) | Men | Women |
|---|---|---|
| 18-29 | 165.0±08.79 (81) | 152.4±05.85 (609) |
| 30-49 | 165.5±06.91 (137) | 152.0±5.42 (806) |
| ≥50 | 164.1±07.12 (63) | 151.9±05.34 (362) |
Weight (kg)
| Age (yrs) | Men | Women |
|---|---|---|
| 18-29 | 62.2±13.76 (81) | 52.9±11.29 (609) |
| 30-49 | 70.9±13.84 (137) | 61.4±11.56 (806) |
| ≥50 | 68.1±13.27 (63) | 62.3±12.64 (362) |
BMI
| Age (yrs) | Men | Women |
|---|---|---|
| 18-29 | 22.7±4.28 (81) | 22.8±4.65 (609) |
| 30-49 | 25.9±04.97 (137) | 26.5±4.73 (806) |
| ≥50 | 25.3±04.51 (63) | 27.0±05.15 (362) |
Under-nutrition rates were higher in women in the 18-29 years of age as compared to men. This is perhaps attributable to the additional nutrient requirements during pregnancy, lactation and child care related higher physical activity in this age group. Under-nutrition rates in men and women beyond 30 years of age was less than 5%. One-fourth of the men and women in the 18-29 years age group were over-nourished. Over-nutrition rate both in women and in men doubled in the 30-49 age group. In the over 50 years age group there was some reduction in the over-nutrition rates in men but over 2/3rd of the women beyond 50 years were over-nourished.
| Age (years) | Men | Women |
|---|---|---|
| 18-29 | <18.5 8.6 | 17.2 |
| 30-49 | 3.6 | 2.6 |
| ≥50 | 6.3 | 3.3 |
CHANGES IN CIRCUMFERENTIAL MEASUREMENTS IN RELATION TO AGE
There was a progressive increase in mean MUAC, waist and hip circumferences with increase in age with women. Mean WHR and WHtR were similar in women in 18-29 and 30-49 years age group but were higher in women beyond 50 years of age. Prevalence of abdominal adiposity in women was higher than the prevalence of over-nutrition in all the age groups.
There was a progressive increase in abdominal adiposity as assessed by waist circumference, WHR and WHtR with increase in age. Over 3/4th of the women who were >50 years of age had abdominal adiposity.
| Age (years) | MUAC | Waist circumference | Hip circumference | Waist/hip ratio | Waist/height ratio |
|---|---|---|---|---|---|
| 18-29 | 23.9±3.60 (605) | 72.0±10.38 (603) | 91.9±8.89 (603) | 0.8±0.06 (603) | 0.5±0.07 (603) |
| 30-49 | 26.5±3.60 (805) | 80.6±10.48 (805) | 99.6±34.61 (805) | 0.8±0.07 (805) | 0.5±0.07 (805) |
| ≥50 | 26.9±04.17 (361) | 86.3±11.32 (360) | 100.2±10.36 (360) | 0.9±0.07 (360) | 0.6±0.07 (360) |
| Age (years) | WC | WHR | WHtR |
|---|---|---|---|
| 18-29 | <80 79.4 | <0.8 63.0 | <0.5 67.5 |
| 30-49 | ≥80 20.6 | ≥0.8 37.0 | ≥0.5 32.5 |
| ≥50 | 70.8 | 86.5 | 82.1 |
CHANGES IN BODY COMPOSITION IN RELATION TO AGE
In each of the three age groups the mean fat mass and fat mass index in men was lower as compared to women. There was a substantial and statistically significant increase in the mean fat mass and fat mass index both in men and women between 18-29 and 30-49 years of age; the increase in these indictors in women beyond 50 years was small. Fat free mass index was lower in women as compared to men in all the three age groups. The changes in the mean fat free mass index between the three age groups was small.
| Age (years) | Men | Women |
|---|---|---|
| 18-29 | 12.9±6.98 (81) | 18.0±7.97 (609) |
| 30-49 | 18.7±8.35 (137) | 24.1±8.55 (806) |
| ≥50 | 18.7±7.89 (63) | 25.7±9.54 (362) |
| Age (years) | Fat free mass | Fat mass index | Fat free mass index |
|---|---|---|---|
| 18-29 | 48.3±8.24 (81) | 4.7±2.51 (81) | 17.6±2.16 (81) |
| 30-49 | 51.4±6.85 (137) | 6.8±3.08 (137) | 18.8±2.26 (137) |
| ≥50 | 48.7±6.91 (63) | 6.9±02.84 (63) | 18.1±02.17 (63) |
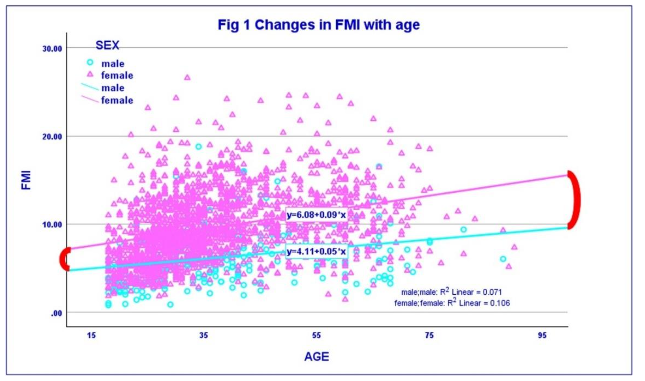
In all age groups and all BMI groups FMI was lower in men as compared to women. Both in men and women there was a progressive increase in FMI with increase in age and increase in BMI. The data suggest that the increase in BMI in relation to age is mainly due to increase in fat mass index with age.
CHANGES IN FAT MASS INDEX AND VISCERAL FAT GRADES IN RELATION TO AGE
Both in men and women there was a substantial increase in fat mass index between 18-29 and 30-49 years; subsequently increase in FMI with age was of a lower magnitude. A similar trend was seen with relation to BMI and visceral fat. There were substantial changes in the prevalence of higher fat mass grades with increase in age in men and women. These data suggest that most of the increase in BMI in men and women with increase in age between 18-29 and 30-49 years, was associated with increase in body fat and abdominal adiposity.
| Men | Age (years) | <6 | 6-9 | ≥9 |
|---|---|---|---|---|
| 18-29 | 71.6 | 23.5 | 4.9 | |
| 30-49 | 44.5 | 37.2 | 18.2 | |
| ≥50 | 41.3 | 33.3 | 25.4 |
| Women | Age (years) | <9 | 9-13 | ≥13 |
|---|---|---|---|---|
| 18-29 | 70.4 | 23 | 6.6 | |
| 30-49 | 38.6 | 37.7 | 23.7 | |
| ≥50 | 30.1 | 42.3 | 27.6 |
CHANGES IN BLOOD PRESSURE IN RELATION TO AGE, BODY MASS INDEX AND FAT MASS INDEX
Mean systolic and diastolic blood pressure in women were lower as compared to men in all the age groups, but the magnitude of the difference was lower in men and women beyond 50 years of age. There was a progressive increase in the mean systolic blood pressure with increase in age both in men and women. Mean diastolic blood pressure in women showed a progressive increase with increase in age; in men there was an increase in diastolic blood pressure between 18-29 and 30-49 year age groups but no change thereafter.
| Age (yrs) | Men | Women |
|---|---|---|
| 18-29 | 127.3±13.43 (65) | 109.7±13.92 (582) |
| 30-49 | 133.5±19.21 (134) | 120.4±17.57 (794) |
| ≥50 | 140.5±26.48 (62) | 136.8±22.98 (350) |
| Age (yrs) | Men | Women |
|---|---|---|
| 18-29 | 81.0±11.16 (65) | 73.6±11.27 (581) |
| 30-49 | 88.8±14.38 (135) | 80.2±11.40 (794) |
| ≥50 | 87.8±13.66 (62) | 85.3±13.97 (350) |
There was no change in systolic BP in men with BMI and a small increase with increase in BMI in women. Diastolic blood pressure increased with increase in BMI both in men and women but the change is relatively small; many men and women with hypertension had normal BMI and vice versa. There was an increase in both systolic and diastolic blood pressure with increase in FMI both in men and women; but many men and women with hypertension had normal FMI and vice versa.
PREVALENCE OF HYPERTENSION IN RELATION TO RISK FACTORS
Data from the present study were analysed to assess prevalence of hypertension in relation to age, BMI, adiposity and distribution of body fat in women and men. In women prevalence of hypertension in 18-29 age group and BMI <18.5 was low but in men about 1/10th had hypertension in this age and BMI groups. There was a progressive increase in prevalence of hypertension in relation to age, BMI and FMI both in men and in women. Prevalence of hypertension in men and women with visceral fat grading >20 was nearly 60%. In women WC ≥80cm, WHR ≥0.8, WHtR ≥0.5 were associated with four to five-fold higher prevalence of hypertension as compared to those with normal values in these parameters. These data indicate that in this study population prevalence of hypertension was high in men and women beyond 30 years of age, ≥25 BMI, and abdominal adiposity as assessed by FMI, WC, WHR and WHtR.
DETECTION OF PERSONS WITH HYPERTENSION USING PRIOR SCREENING WITH RISK FACTORS
Data analyses showed that:
- there were substantial statistically significant differences in age, BMI, adiposity as assessed by fat mass, fat mass index, abdominal adiposity as assessed by WC, WHR, WHtR and visceral fat, blood pressure and prevalence of hypertension between men and women, and
- age, BMI, adiposity as assessed by fat mass, fat mass index, abdominal adiposity as assessed by WC, WHR, WHtR and visceral fat were statistically significant risk factors for hypertension.
The percentage of hypertensive women who had identified risk factors were computed. If women with age beyond 30 years are screened 94% of all hypertensive women would be detected. This is because prevalence of hypertension in women below 30 year is 1.5%. Among men 85.2% of hypertensives will be detected if all men with age above 30 years are screened. If all women with BMI ≥25 were screened 76.7% of all hypertensive women will be detected; however, in men only 54.1% of the hypertensives will be detected. Forty percent of women with hypertension had FMI ≥13 and 31.1% of hypertensive men had FMI ≥9. Sixty percent of women and 70% of men with hypertension will be missed if only men and women with high FMI are screened because only 18% of women and 16% of men had high FMI. A similar trend is seen with visceral fat because less than 5% of the men and women had high visceral fat. Screening women with WHtR of ≥0.5 resulted in detection of 92% of hypertensive women; WHR of ≥0.8 led to detection of 86.7% of hypertensive women. Use of WC resulted in detection of 3/4th of the hypertensive women. Of the three indicators of abdominal adiposity WHtR was the best indicator because by screening 60% of the women it was possible to detect 92% of the women with hypertension.
Discussion
GLOBAL SCENARIO
In 2021, an estimated one billion men and 1.11 billion women were overweight or obese. China had the largest population of adults with overweight and obesity (402 million), followed by India (180 million) and the USA (172 million). Assuming the continuation of historical trends, by 2050, the total number of adults living with overweight and obesity will reach 3.80 billion which is over half of the likely global adult population at that time. Globally screening population groups for over-nutrition and providing nutrition and health education to change dietary intake, physical activity and life style had been a major component of the over-nutrition prevention and control programmes. However, no country has so far been able to achieve sustained and significant reduction in over-nutrition. Taking this into account the SDG calls for only halting the further rise in over-nutrition.
The concern over the rising over-nutrition is because of the associated rise in hypertension and diabetes and premature death due to NCDs. It has been estimated that in 2015 high BMI accounted for 4.0 million deaths globally; more than two thirds of deaths related to high BMI were due to CVD. Age-standardized CVD prevalence ranged from 5,881.0 per 100,000 in South Asia to 11,342.6 per 100,000 in Central Asia in 2022. The Global Burden of Disease Study estimates of age-standardized CVD death rate of 272 per 100,000 population in India is higher than the global average of 235 per 100,000 population. Some of the contributing factors for this higher mortality include the early age of onset of hypertension, low detection in the early asymptomatic phase, low coverage under treatment of hypertension and high discontinuation during treatment of hypertension. Premature mortality in terms of years of life lost because of CVD in India increased by 59%, from 23.2 million (1990) to 37 million (2010). CVD has emerged as the leading cause of death in all parts of India, in all states including poorer states and rural areas, in both sexes and among all segments of the population.
Data from Global Burden of Disease Study indicate that there were substantial inter-regional differences both in obesity and morbidity and mortality due to CVD. Comparison of the age-standardised CVD mortality attributable to high BMI in different regions of the world showed that in South Asia there had been a doubling of the mortality from 7 to 14.8% between 1990 and 2022. Prevalence of obesity and hypertension was higher in high income countries; despite this, over the same period, mortality due to CVD came down from 23.4 to 14.4%. These data suggest that blood pressure screening for early detection and effective management of hypertension does reduce the morbidity and mortality associated with over-nutrition and cardiovascular diseases.
INDIAN SCENARIO
India like all developing countries is undergoing nutrition transition. Data from the surveys carried out by the National Nutrition Monitoring Bureau and National Family Health Survey in India, showed that there has been a relatively slow but sustained increase in over-nutrition. NFHS surveys showed that the prevalence of over-nutrition (BMI ≥25) doubled from 12% (men) and 15% (women) in 2005 to 23% (men) and 24% (women) in 2019. Apart from ongoing nutrition transition, there are some other factors which increase the risk of over-nutrition, adiposity and risk of hypertension in Indians. A third of Indian infants are born with low birth weight. Low birthweight infants moving over to a higher trajectory of BMI in infancy, childhood or adolescence were at risk of over-nutrition, hypertension and diabetes even in their early thirties. It has been well documented that Indians have higher body fat for any given BMI as compared to Caucasians. Since body fat is a major risk factor of hypertension and cardiovascular diseases, it has been suggested that for Indians (perhaps all Asians) a lower BMI cut-off of 23 should be used for assessing the risk of hypertension and CVD. However, for comparison with global data, India continues to use BMI cut-off of 25 for categorising adults as over-nourished.
PREVALENCE OF OVER-NUTRITION, ADIPOSITY AND HYPERTENSION IN THE PRESENT STUDY
Data from the present study showed that in urban low middle-income families nearly half the men and women were overweight (BMI ≥25). There was progressive increase in body weight and BMI with increase in age. Over-nutrition rate both in women and in men doubled in the 30-49 years age group. In the over 50 years age group there was some reduction in the over-nutrition rates in men but over 2/3rd of the women beyond 50 years were over-nourished. These data indicate that a substantial increase in BMI occurs in men and women when they are in 30-49 years age group. Data from the present study is similar to the data from the National Family Health Survey.
Combating over-nutrition in urban low middle income population poses many problems. Research studies in our study population showed that these families availed the subsidised food grains provided through the Public Distribution System and were food secure. The families consumed habitual predominantly plant-based home cooked food and did not habitually consume fried food and sweets. Their vegetable intake was low. Over 85% of men and women were sedentary. Average energy consumption as assessed by diet surveys done using 24-hour dietary recall method was 1630 kcal/Consumption unit/day. This was about 100-150 Kcal higher as compared to their energy requirements. The small but sustained higher energy consumption as compared to requirement appeared to be responsible for the creeping increase in body weight and BMI with age. The creeping rise in weight and over-nutrition over decades in the population studied is mainly attributable to the steep reduction in physical activity and not so steep reduction in the energy intake resulting in a small but sustained positive energy balance. Nutrition and health education to increase discretionary physical activity did not have much impact because over-crowded lanes rendered walking difficult. Experience over years showed that sustained reduction in body weight with dietary and lifestyle modification was not possible; however, in women in their thirties and early forties it was possible to halt further increase in weight over the next three to four years. Data from other countries have shown a similar trend. Given these findings, the focus of attention has to shift to the blood pressure screening for early detection and effective management of hypertension. In developed countries, this strategy has paid good dividends in terms of reduction in mortality associated with CVD despite high prevalence of both over-nutrition and hypertension.
Data from the present study showed that there was a progressive increase in prevalence of hypertension in relation to age both in men and in women. The increase in prevalence of hypertension was higher in women between the 18-29 year and 30-49 years age group, because of the low prevalence of hypertension in the 18-29 years age group. Data from the present study confirmed that onset of hypertension occurs in Indians at a lower age as compared to developed countries. Estimates of hypertension in study population were similar to the hypertension rates reported in the national surveys.
SCREENING FOR HYPERTENSION IN INDIA
It is estimated that in India one fourth of men and one fifth of women have hypertension. Hypertension is asymptomatic in the initial phase and therefore majority do not know that they have hypertension. Even among those in whom hypertension had been diagnosed, over two thirds do not correctly and consistently take the medication. India initiated the CVD component of the National NCD control programme to provide comprehensive health services for screening, early detection and effective management of CVD through health and wellness centres in both urban and rural areas. The initial critical step in the management of hypertension is periodic near-universal screening of the adults for hypertension. While the infrastructure and manpower for undertaking periodic screening of three fourths of 1.4 billion Indians is being built up, the programme has been undertaking opportunistic screening of adults over 30 years of age for hypertension both in community and hospital settings within the available health infrastructure and manpower. As expected under the existing constraints, the coverage under this critical component is still quite low.
RATIONALE AND PITFALLS IN SCREENING OF HIGH-RISK GROUPS
Efforts to define cardiovascular disease risks is done for two reasons:
- Prevalence of hypertension is high in high-risk groups; therefore, as compared to the screening of general population, larger number of persons with hypertension could be detected by screening smaller number of persons from high-risk groups;
- Specific appropriate interventions can be implemented in high-risk groups to prevent onset of hypertension or reduce the prevalence of hypertension and thereby reduce the risk of CVD.
Earlier studies had shown that the risk factors associated with CVD such as age, smoking, sedentary life style, over-nutrition, adiposity, hypertension, diabetes are similar in developed and developing countries. Prevalence of each of these risk factors as well as prevalence of CVD, showed considerable variations between countries and regions. Since 1990, the ranking for high BMI as a risk factor for CVD had increased substantially as compared to other risk factors, especially in low and middle income countries.
There are however problems in focussing on defined “high-risk” groups. Though the prevalence of hypertension is higher in the relatively small high-risk groups, larger number of persons with asymptomatic hypertension are found in the large low risk group and they may not get the attention they need. Data from Prospective Urban Rural Epidemiology (PURE) study showed that 41% of first major cardiovascular events occurred in low-risk group participants with a predicted 10-year WHO cardiovascular disease risk of less than 10% and no previous cardiovascular disease. These findings emphasize the fact that a substantial share of the cardiovascular disease burden is in low-risk population, and low-risk groups should not inadvertently be left out of the screening and comprehensive preventive strategies for CVD control.
In the Indian context periodic blood pressure screening of all adults in 1.4 billion population is a daunting task. Data from the present study were analysed to assess whether preliminary screening of any of the risk factors such as age, adiposity, abdominal adiposity could reduce the number of persons to be screened and still enable detection of majority of the hypertensive persons in hospital and community settings.
AGE AND HYPERTENSION
Age is one of the important but unmodifiable risk factors associated with over-nutrition, adiposity and hypertension. Data from the present study showed that there was progressive increase in BMI, adiposity, especially abdominal adiposity with increase in age both in men and women. Men and women below the age of 30 formed about 30% of the adult population studied. Blood pressure screening of women with age beyond 30 years resulted in the detection of 94% of all hypertensive women because prevalence of hypertension in women below 30 year is 1.5%. Among men 85.2% of hypertensives will be detected if all men with age above 30 years were screened with blood pressure. Both in hospital and in community settings ascertaining whether the person is older than 30 years of age is feasible and can be done rapidly and accurately. The guidelines under the National Programme for Control of Cardiovascular Diseases of screening of all adults aged 30 years or above for hypertension is a feasible and effective method of reducing the workload of screening blood pressure by about 30% and still achieve detection of over 85% of persons with hypertension.
OVER-NUTRITION AND HYPERTENSION
Data from the present study were analysed to assess the prevalence of hypertension in men and women with BMI ≥25 and compute the proportion of hypertensive persons detected by screening such women and men. Prevalence of hypertension in over-nourished women was 15.1% and in men was 26.6%. Men and women with BMI ≥25 formed about 50% of the adults. Using BMI cut-off of 25, would reduce the number of persons to be screened by half. However, by screening all women with BMI ≥25 only 76.7% of all hypertensive women will be detected; in men this figure comes down to 54.1%. Measurement of height, weight, and computation of BMI in community or hospital setting may be more time consuming as compared to simple measurement of blood pressure. Therefore, BMI might not be useful as preliminary screening parameter to reduce the number of persons to be screened for hypertension.
ABDOMINAL ADIPOSITY AND HYPERTENSION
Studies reported over the last three decades show that both the amount of body fat and the distribution of body fat are important determinants for risk of hypertension and cardiovascular diseases. Adiposity, especially abdominal adiposity is associated with metabolic changes such as dyslipidaemia and insulin resistance; these changes are associated with increase in risk of hypertension and diabetes. Circumferential measurements can be measured with simple non-stretch tapes; though widely used in research settings they are not widely used in hospital and community settings for assessing abdominal adiposity. Available data indicate that waist circumference, waist hip ratio and waist height ratio provide valuable information for identifying the individual with abdominal adiposity and prevalence of abdominal adiposity in groups of population. In the present study circumferential measurements were taken only in women. There was a progressive increase in mean in mid upper arm circumference (MUAC), waist and hip circumferences with increase in age in women. Mean WHR and WHtR were similar in women in 18-29 years and 30-49 years age groups but were higher in women beyond 50 years of age. Prevalence of abdominal adiposity in women was higher than the prevalence of over-nutrition in all the age groups in women. There was a progressive increase in abdominal adiposity as assessed by WC, WHR and WHtR with increase in age. Over 3/4th of the women who were ≥50 years of age had abdominal adiposity. Data from the present study confirms that abdominal adiposity in urban women is high.
Data from the present study indicates that screening women with:
- WC ≥80 cm alone resulted in detection of 3/4th of the hypertensives;
- WHR of ≥0.8 led to detection of 86.7% of hypertensive women;
- WHtR of ≥0.5 resulted in detection of 92% of hypertensive women.
Of the three indicators of abdominal adiposity WHtR was the best indicator because by screening 60% of the women it was possible to detect 92% of the women with hypertension. Similar findings have been reported from other studies. But height and waist circumference measurements and computation of WHtR are time consuming as compared to measurement of blood pressure using a digital BP monitor. Most of the paramedical personnel are not trained in measurement of circumferential measurements. Given those constraints WC, WHR or WHtR cannot be used for preliminary screening for identifying high risk persons who should be screened for hypertension.
FAT MASS INDEX, VISCERAL FAT AND HYPERTENSION
Optimal body composition is an essential prerequisite for good health. With the availability of the portable accurate body composition analysers at affordable cost, body composition studies are being undertaken by clinicians, nutritionists and epidemiologists. Data from all these studies indicate that there is an increase in fat mass and fat mass index with increase in age and increase in BMI in all adults. Abdominal adiposity is associated with increase in risk of hypertension and diabetes, and premature mortality due to CVD. Indians have the following problems:
- higher adiposity for a given BMI,
- higher abdominal adiposity right through life;
- increase in abdominal adiposity with increasing age; and
- onset of hypertension and diabetes occurring at a younger age.
These factors, combined with the lack of universal access to and utilisation of services for early detection and effective management of CVD might be responsible for the fact that in developed countries only 23% of CVD deaths occur before 70 years while in India over 50% of the deaths occur before 70 years.
Data from the present study showed that fat mass, fat mass index, visceral fat were all higher in women as compared to men across all age and BMI groups. The present study confirmed that the increase in the BMI with age in the study population was mainly due to increase in body fat as indicated by progressive increase in fat mass and fat mass index with age both in men and in women. Both in men and women there was a substantial increase in fat mass index and visceral fat between 18-29 and 30-49 years; subsequently increase in FMI and visceral fat was of a lower magnitude. A similar trend was seen with relation to BMI and visceral fat. These data suggest that most of the increase in BMI in men and women with increase in age between 18-29 and 30-49 years, was associated with increase in body fat and abdominal adiposity. Analysis of data regarding prevalence of hypertension in relation to FMI and visceral fat grades showed that there was increase in prevalence of hypertension in the higher grades. These data confirm the finding from other studies using these parameters. The grading used for FMI and visceral fat had not been validated in Indian population. Further studies are needed to assess whether these gradings can be applied to Indian population who have higher body fat and higher visceral adiposity as compared to Caucasians. Bioelectrical impedance analysis machines are used in India mainly as a research tool to explore the relationship between over-nutrition and fat mass index, abdominal adiposity as assessed by visceral fat and hypertension. They are not available or used in even in tertiary care hospitals. Therefore, they cannot be used as preliminary screening parameters for selecting at risk groups for screening for hypertension.
Conclusion
The profile of the urban low middle-income population investigated was similar to the urban low middle-income population in national surveys. There were significant differences between men and women in prevalence of hypertension, BMI ≥25, high adiposity as assessed by fat mass and fat mass index. Age, BMI and high abdominal adiposity were statistically significant risk factors for hypertension both in men and in women. Data from the present study showed that screening only adults ≥30 years reduced the number of persons to be screened by 30% and resulted in detection of over 85% of all hypertensive persons. Ascertainment of age is feasible in both hospital and community settings. Screening only persons with BMI ≥25 reduced the work load by 50% but resulted in detection of only 76.7% of hypertensive women and 54.1% of hypertensive men. Screening women using WC, WHR and WHtR reduced the number to be screened by 40-50%. Blood pressure screening in women with WC ≥80 resulted in detection of 3/4th of the hypertensives; with WHR of ≥0.8 resulted in detection of 86.7% of women with hypertension; with WHtR of ≥0.5 resulted in detection of 92% of hypertensive women. Checking blood pressure takes less time as compared to taking circumferential measurements; paramedical persons are not trained to undertake circumferential measurements accurately. Therefore, circumferential measurements are not useful for preliminary screening. Bioelectrical impedance analysis machines for fat mass measurement are not available in health care settings and so cannot be used for preliminary screening. Data from the present study confirm that screening adults beyond 30 years for hypertension as envisaged in the national CVD prevention and control programme is the feasible method of reducing the number of persons to be screened by one third and ensuring that over 85% of all hypertensive persons are detected through the screening.
Conflict of Interest Statement: None.
Funding Statement: The study was funded by the Nutrition Foundation of India.
Acknowledgements: The authors gratefully acknowledge the support provided by the Nutrition Foundation of India for carrying out the study.
ORCID ID: 1.Prema Ramachandran: 0000-0003-1974-8281 2.K. Kalaivani: 0000-0002-9582-4488
“`