

Pancreatic Cancer Outcomes: MRI Radiomics Analysis
Enhancing Outcome Prediction for Pancreatic Cancer Following Stereotactic Body Radiotherapy Through MRI Radiomics Analysis
Jacob T. Marasco1, Yu Lei1, Ashok Bhandari1, Garett Ostdiek-Wille1, Alex Kolomaya1, Charlene Rhodd1, Fang Yu1, Sumin Zhou1, Chi Lin1, Shuo Wang1
OPEN ACCESS
PUBLISHED:
CITATION: MARASCO, Jacob T. et al. Enhancing Outcome Prediction for Pancreatic Cancer Following Stereotactic Body Radiotherapy Through MRI Radiomics Analysis. Medical Research Archives, [S.l.], v. 12, n. 12, dec. 2024. Available at: <https://esmed.org/MRA/mra/article/view/6162>.
COPYRIGHT: © 2025 European Society of Medicine. This is an open-access article distributed under the terms of the Creative Commons Attribution License, which permits unrestricted use, distribution, and reproduction in any medium, provided the original author and source are credited.
DOI : https://doi.org/10.18103/mra.v12i12.6162.
ISSN 2375-1924
Abstract
Purpose: Pancreatic cancer is an extremely aggressive and deadly cancer with a 5-year survival rate of less than 10%. Our study aims to establish an MRI radiomics-based model to predict survival for borderline resectable and locally advanced pancreatic ductal adenocarcinoma patients who have received radiation therapy.
Methods: 71 borderline resectable and locally advanced pancreatic cancer patients (42 Male, 29 Female) were retrospectively selected for radiomics analysis with a median age of 63 years. The gross tumor of each patient was delineated on contrast-enhanced T1-weighted MRI images. Radiomics features were extracted using PyRadiomics and feature stability of the radiomics features was assessed under MRI intensity normalization and bin width variation. The 71 patients were randomly split into a training set (54 patients) and a testing set (17 patients). Using the training set, we trained three risk stratification models (clinical-only, radiomics-only, and a composite) through a penalized Cox model, which simultaneously established the predictive model and selects important features by incorporating L1 and/or L2 penalties to the Cox Proportional Hazards model. We also built a Random Forest classifier using the Synthetic Minority Over-sampling Technique (SMOTE) with the same set features selected in the penalized cox model to predict the 1-year survival of these pancreatic cancer patients.
Results: Out of 924 extracted features, we identified 133 (14.4%) stable features with ICC > 0.75, against both intensity normalization and bin width variations. Survival models based on clinical endpoints alone, radiomics features alone, and a combination showed that including radiomics features can significantly improve survival prediction. Using the same number of features to construct survival models for clinical only, radiomics only, and a combination of clinical and radiomics features, we find that we are able to accurately distinguish low and high-risk groups and generate survival curves for the test group with a concordance index of 0.615, 0.654, and 0.716, respectively. The Random Forest classifier predicted the 1-year survival accuracies of 0.529, 0.824, and 0.765 for the clinical-only model, radiomics-only model, and the composite model, respectively.
Conclusions: Magnetic resonance imaging (MRI) radiomics is promising in predicting the mortality of pancreatic cancer following SBRT and improving survival prediction capabilities. Intensity normalization is an essential preprocessing step to exclude unstable and/or redundant imaging features.
Article Details
Introduction
Pancreatic cancer is a notably aggressive form of cancer and is the 4th leading cause of all cancer-related deaths in the US, with an estimated 5-year overall survival of approximately 9%. The low survival rate is largely due to the difficulty in detecting pancreatic cancer early as symptoms will typically not appear until the disease has advanced to its later stages. The symptoms of pancreatic cancer can be subtle or nonexistent, leading to delayed diagnosis and limited treatment options.
In 2022, approximately half of all pancreatic cancer cases were diagnosed at an advanced or distant stage with a metastatic 5-year survival of less than 3%. Cancers will often form within critical proximity to other vital organs and blood vessels nearby, reducing the chance of a cure via surgical resection. In many cases, pancreatic cancer has been shown to be resistant to chemotherapy and radiation, increasing the overall mortality rate. Immunotherapy, another promising approach gaining success in other forms of cancers, has also shown limited effectiveness in treating pancreatic cancer. Therefore, research aimed at risk stratification is crucial for the classification of patients into risk categories and, thus, providing patient-appropriate treatment based on the status of the disease for an individual. Medical imaging techniques offer an opportunity to be employed for identifying quantitative biomarkers that can aid in risk stratification and treatment planning. Precise multifaceted risk stratification enables more effective and personalized treatment.
Magnetic resonance imaging (MRI) is frequently selected as the preferred imaging modality for abdominal examinations due to its exceptional ability to differentiate soft tissues. The high soft tissue contrast in the abdominal region allows for highly accurate tumor delineation, a crucial aspect for both treatment planning and quantitative analysis of the imaging features. MRI can identify tumor size, location, and potential invasion into nearby structures such as the lymph nodes, or distant metastases. Quantitative imaging analysis, namely radiomics, is emerging as a novel technique in medical imaging as a data source for biomarkers that are manifested as image-based phenotypes. This methodology involves the extraction and analysis of quantitative data from medical images where the derived image features hold potential for personalized patient care.
It is becoming increasingly useful for predicting patient response to therapy, whether before, during, or after treatment. Radiomics features, extracted based on segmentation, i.e., delineation of a boundary around a region of interest, typically include the shape, volume, texture, and higher-order statistics of a volume of interest and can provide a more comprehensive and nuanced representation of the radiographic phenotype of a tumor or an organ than qualitative descriptors from human experts. Due to its distinct advantages for biomarker development, radiomics has become an active area of research focusing on risk assessment and treatment response prediction of cancer as well as the relationship between image features and genomics.
Despite the promising potential of applying MRI Radiomics in the medical field, MRI poses unique challenges due to its varying signal intensity, which can significantly affect the robustness of the extracted radiomics features as well as the generalizability of such models when applied to external datasets.
The primary purpose of this study is to assess whether radiomics features, extracted from the MRI prior to radiotherapy, can improve the accuracy of predictive models for the survival of patients with pancreatic ductal adenocarcinoma (PDAC) as a more effective method than consideration of clinical endpoints alone. Additionally, we aim to emphasize the role of the incorporation of an intensity normalization protocol into the MRI radiomics workflow as an essential step to reduce the extent of overfitting predictive models and to improve the overall prediction of survival.
Materials and Methods
Patient Characteristics
The Institutional Review Board at our institution approved this retrospective study (IRB 789-18-EP) and waived the informed consent of the subjects. The waiver would not affect the rights and welfare of the study subjects. A total of 71 borderline resectable and locally advanced PDAC patients were retrospectively selected for this study, 42 male and 29 female with a median age of 63 years ranging from 35 to 81 years, at the time of diagnosis.
We also collected other clinical characteristics such as gender, surgical status, chemotherapy regimen, radiation therapy prescription and staging information. The patient characteristics were summarized in Table 1.
Discussion
Owing to its capability of providing excellent soft tissue contrast, MRI is one of the most important imaging modalities in cancer management, especially for malignancies in the abdominal region. However, owing to its primary purpose of providing a visual representation of organs based on intrinsic differences in relaxation following a radiofrequency pulse, the intensity range of voxel values in MR images can vary substantially.
Additionally, the intensity distribution experiences significant intra- and inter-scanner variability due to differences in RF frequency, coil uniformity, nonlinear fields, and gradient fields. Radiomics features extracted from a set of MR images with significantly varied signal distributions can impair the robustness of the features and subsequent predictive modeling.
In our study, we addressed this issue by applying the Nyul intensity normalization on the contrast-enhanced T1-weighted MR images of our patient cohort. We demonstrated that only about 36.4% of the MR radiomics features are stable after the intensity was normalized across all the images.
We believe that intensity normalization should be a standard step in the MR radiomics workflow, as we observed significant variability in the intensity distribution of our MRI images, a relatively small sample size from a single institution.Our results also demonstrated that the MR radiomics features, after robustness analysis, provided at least complementary predictive power for predicting 2-year survival in pancreatic cancer patients. Radiomics-only model outperforms the clinical-only model as it achieved a better Concordance Index on the same test set. The composite model demonstrated the best performance among the three models, suggesting that MR radiomics analysis has the potential to be integrated into routine clinical decision-making as MR is one of the most common and non-invasive imaging modalities.
Our study has a few limitations. First, we have a relatively small sample size from a single institution, and our conclusion necessitates cautious interpretation and requires validation through external datasets. The discrepancy in AUC values observed between the training and test sets indicates that the sample size is small for a robust model evaluation. Second, we selected Min-Max normalization for data preprocessing to match the data range more effectively with the categorical variables and did not consider other normalization or transformation techniques. Third, we did not explore other intensity normalization methods such as least squares (LSQ) tissue mean normalization or Removal of Artificial Voxel Effect by Linear regression (RAVEL) methods. Moreover, continued assessment of our model is necessary following our proof-of-concept study. The model needs to be validated, and potentially improved, using external datasets. We also intend to carry out independent tests with newly acquired patient data.
Although our study has demonstrated that the T1-weighted MRI radiomics models can facilitate and enhance survival risk prediction for pancreatic cancer who received Stereotactic Body Radiation Therapy, future efforts are still warranted to investigate the radiomics model using other MRI modalities, such as functional MRI or those with more physiological relevance as Diffusion Weighted MRI. Furthermore, the biggest challenge in pancreatic cancer is the lack of a reliable early detection tool, as over 50% of pancreatic cancers are diagnosed at a late stage. Integrating radiomics models with imaging-based screening programs could potentially enhance early detection. More studies are needed in this area.
Conclusion
MR radiomics is promising in predicting the mortality of pancreatic cancer following SBRT and improving survival prediction capabilities. Intensity normalization is an essential preprocessing step to exclude unstable and/or redundant imaging features.
Conflict of Interest:
None.
Funding Statement:
None.
Acknowledgements:
None.
References
1. Siegel, R. L.; Miller, K. D.; Fuchs, H. E.; Jemal, A., Cancer statistics, 2022. CA Cancer J Clin 2022, 72 (1), 7-33.
2. SEER Database SEER Database: Percent of Cases & 5-Year Relative Survival by Stage at Diagnosis: Pancreatic Cancer. https://seer.cancer.gov/statfacts/html/pancreas.html.
3. Chin, V.; Nagrial, A.; Sjoquist, K.; O’Connor, C. A.; Chantrill, L.; Biankin, A. V.; Scholten, R. J.; Yip, D., Chemotherapy and radiotherapy for advanced pancreatic cancer. Cochrane Database Syst Rev 2018, 3 (3), CD011044.
4. Schizas, D.; Charalampakis, N.; Kole, C.; Economopoulou, P.; Koustas, E.; Gkotsis, E.; Ziogas, D.; Psyrri, A.; Karamouzis, M. V., Immunotherapy for pancreatic cancer: A 2020 update. Cancer Treat Rev 2020, 86, 102016.
5. Gerwing, M.; Herrmann, K.; Helfen, A.; Schliemann, C.; Berdel, W. E.; Eisenblatter, M.; Wildgruber, M., The beginning of the end for conventional RECIST – novel therapies require novel imaging approaches. Nat Rev Clin Oncol 2019.
6. Aerts, H. J.; Velazquez, E. R.; Leijenaar, R. T.; Parmar, C.; Grossmann, P.; Carvalho, S.; Cavalho, S.; Bussink, J.; Monshouwer, R.; Haibe-Kains, B.; Rietveld, D.; Hoebers, F.; Rietbergen, M. M.; Leemans, C. R.; Dekker, A.; Quackenbush, J.; Gillies, R. J.; Lambin, P., Decoding tumour phenotype by noninvasive imaging using a quantitative radiomics approach. Nat Commun 2014, 5, 4006.
7. Gillies, R. J.; Kinahan, P. E.; Hricak, H., Radiomics: Images Are More than Pictures, They Are Data. Radiology 2016, 278 (2), 563-77.
8. Lambin, P.; Leijenaar, R. T. H.; Deist, T. M.; Peerlings, J.; de Jong, E. E. C.; van Timmeren, J.; Sanduleanu, S.; Larue, R. T. H. M.; Even, A. J. G.; Jochems, A.; van Wijk, Y.; Woodruff, H.; van Soest, J.; Lustberg, T.; Roelofs, E.; van Elmpt, W.; Dekker, A.; Mottaghy, F. M.; Wildberger, J. E.; Walsh, S., Radiomics: the bridge between medical imaging and personalized medicine. Nat Rev Clin Oncol 2017, 14 (12), 749-762.
9. Parmar, C.; Grossmann, P.; Bussink, J.; Lambin, P.; Aerts, H. J., Machine Learning methods for Quantitative Radiomic Biomarkers. Sci Rep 2015, 5, 13087.
10. Sanduleanu, S.; Woodruff, H. C.; de Jong, E. E. C.; van Timmeren, J. E.; Jochems, A.; Dubois, L.; Lambin, P., Tracking tumor biology with radiomics: A systematic review utilizing a radiomics quality score. Radiother Oncol 2018, 127 (3), 349-360.
11. van Griethuysen, J. J. M.; Fedorov, A.; Parmar, C.; Hosny, A.; Aucoin, N.; Narayan, V.; Beets-Tan, R. G. H.; Fillion-Robin, J. C.; Pieper, S.; Aerts, H. J. W. L., Computational Radiomics System to Decode the Radiographic Phenotype. Cancer Res 2017, 77 (21), e104-e107.
12. Aerts, H. J., The Potential of Radiomic-Based Phenotyping in Precision Medicine: A Review. JAMA Oncol 2016, 2 (12), 1636-1642.
13. Bodalal, Z.; Trebeschi, S.; Nguyen-Kim, T. D. L.; Schats, W.; Beets-Tan, R., Radiogenomics: bridging imaging and genomics. Abdom Radiol (NY) 2019, 44 (6), 1960-1984.
14. Wu, J.; Tha, K. K.; Xing, L.; Li, R., Radiomics and radiogenomics for precision radiotherapy. J Radiat Res 2018, 59 (suppl_1), i25-i31.
15. Mazurowski, M. A., Radiogenomics: what it is and why it is important. J Am Coll Radiol 2015, 12 (8), 862-6.
16. Gevaert, O.; Mitchell, L. A.; Achrol, A. S.; Xu, J.; Echegaray, S.; Steinberg, G. K.; Cheshier, S. H.; Napel, S.; Zaharchuk, G.; Plevritis, S. K., Glioblastoma Multiforme: Exploratory Radiogenomic Analysis by Using Quantitative Image Features. Radiology 2015, 276 (1), 313.
17. Karlo, C. A.; Di Paolo, P. L.; Chaim, J.; Hakimi, A. A.; Ostrovnaya, I.; Russo, P.; Hricak, H.; Motzer, R.; Hsieh, J. J.; Akin, O., Radiogenomics of clear cell renal cell carcinoma: associations between CT imaging features and mutations. Radiology 2014, 270 (2), 464-71.
18. Abazeed, M. E.; Adams, D. J.; Hurov, K. E.; Tamayo, P.; Creighton, C. J.; Sonkin, D.; Giacomelli, A. O.; Du, C.; Fries, D. F.; Wong, K. K.; Mesirov, J. P.; Loeffler, J. S.; Schreiber, S. L.; Hammerman, P. S.; Meyerson, M., Integrative radiogenomic profiling of squamous cell lung cancer. Cancer Res 2013, 73 (20), 6289-98.
19. PyRadiomics Documentation. https://pyradiomics.readthedocs.io/en/latest/.
20. Pieper, S.; Lorensen, B.; Schroeder, W.; Kikinis, R. In The NA-MIC Kit: ITK, VTK, pipelines, grids and 3D slicer as an open platform for the medical image computing community, 3rd IEEE International Symposium on Biomedical Imaging: Nano to Macro, 2006., 6-9 April 2006; 2006; pp 698-701.
21. Wang, S.; Belemlilga, D.; Lei, Y.; Ganti, A. K. P.; Lin, C.; Asif, S.; Marasco, J. T.; Oh, K.; Zhou, S., Enhancing Survival Outcome Predictions in Metastatic Non-Small Cell Lung Cancer Through PET Radiomics Analysis. Cancers 2024, 16 (22), 3731.
22. Park, J. E.; Park, S. Y.; Kim, H. J.; Kim, H. S., Reproducibility and Generalizability in Radiomics Modeling: Possible Strategies in Radiologic and Statistical Perspectives. Korean J Radiol 2019, 20 (7), 1124-1137.
23. Koo, T. K.; Li, M. Y., A Guideline of Selecting and Reporting Intraclass Correlation Coefficients for Reliability Research. J Chiropr Med 2016, 15 (2), 155-63.
24. Moradmand, H.; Aghamiri, S. M. R.; Ghaderi, R., Impact of image preprocessing methods on reproducibility of radiomic features in multimodal magnetic resonance imaging in glioblastoma. J Appl Clin Med Phys 2020, 21 (1), 179-190.
25. Nyul, L. G.; Udupa, J. K.; Zhang, X., New variants of a method of MRI scale standardization. IEEE Trans Med Imaging 2000, 19 (2), 143-50.
26. Benchoufi, M.; Matzner-Lober, E.; Molinari, N.; Jannot, A. S.; Soyer, P., Interobserver agreement issues in radiology. Diagn Interv Imaging 2020, 101 (10), 639-641.
27. Polsterl, S., scikit-survival: A Library for Time-to-Event Analysis Built on Top of scikit-learn. Journal of Machine Learning Research 2020, 21 (212), 1-6 %M.
28. Chawla, N. V.; Bowyer, K. W.; Hall, L. O.; Kegelmeyer, W. P., SMOTE: synthetic minority over-sampling technique. Journal of artificial intelligence research 2002, 16, 321–357.
29. Wang, S.; Lin, C.; Kolomaya, A.; Ostdiek-Wille, G. P.; Wong, J.; Cheng, X.; Lei, Y.; Liu, C., Compute Tomography Radiomics Analysis on Whole Pancreas Between Healthy Individual and Pancreatic Ductal Adenocarcinoma Patients: Uncertainty Analysis and Predictive Modeling. Technology in Cancer Research & Treatment 2022, 21, 15330338221126869.
30. Huynh, L. M.; Bonebrake, B.; Tran, J.; Marasco, J. T.; Ahlering, T. E.; Wang, S.; Baine, M. J., Multi-Institutional Development and Validation of a Radiomic Model to Predict Prostate Cancer Recurrence Following Radical Prostatectomy. J Clin Med 2023, 12 (23).
31. Fortin, J. P.; Sweeney, E. M.; Muschelli, J.; Crainiceanu, C. M.; Shinohara, R. T.; Alzheimer’s Disease Neuroimaging, I., Removing inter-subject technical variability in magnetic resonance imaging studies. Neuroimage 2016, 132, 198-212.
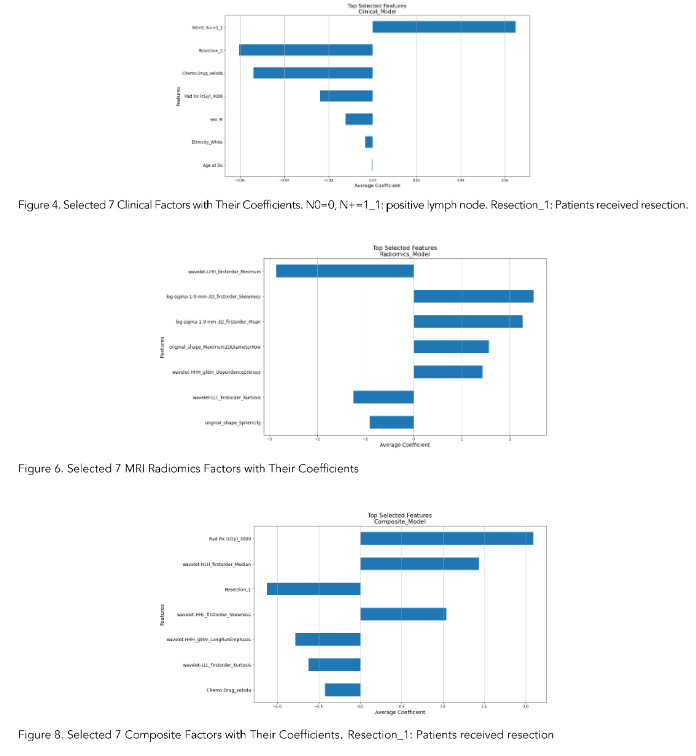
The features of clinical-only, radiomics-only, and composite models were determined by our in-house workflow involving the use of the penalized Cox model. Figures 4, 6, and 8 showed the top selected features with their coefficients from the clinical-only, radiomics-only, and the composite models. The selected features were also summarized in Table 3.
Survival Analysis
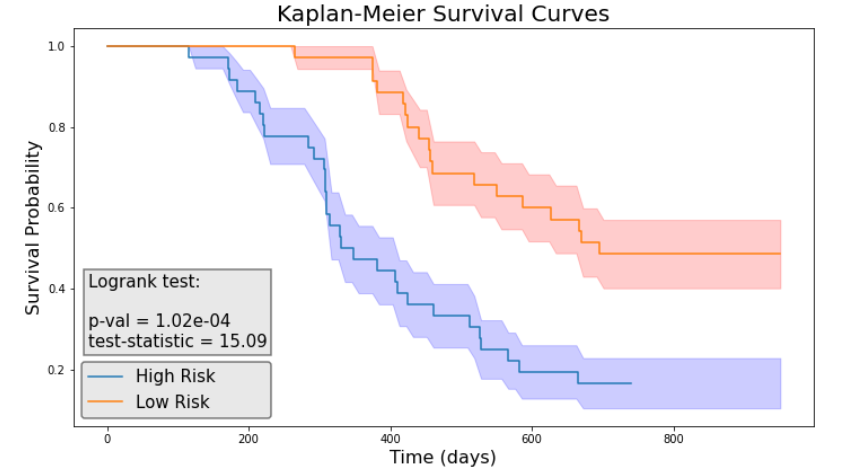
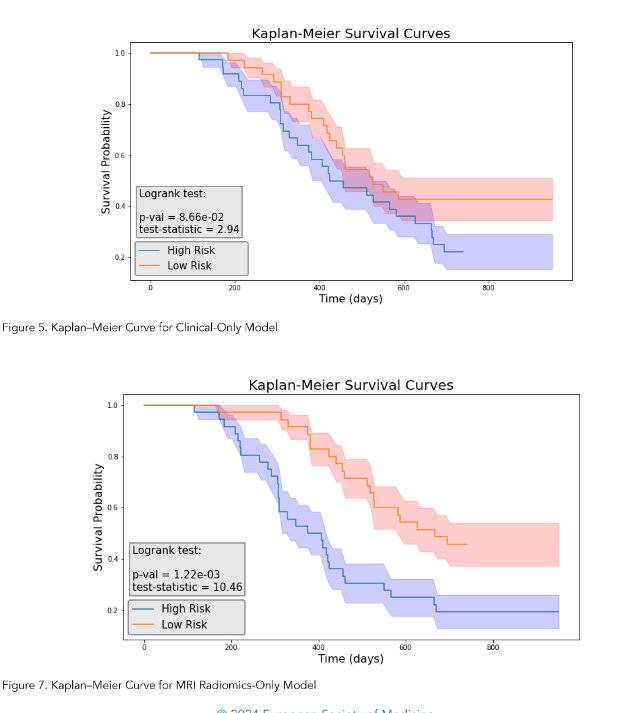
Each 7-feature model (clinical-only, radiomics-only, and the composite) predicted a risk score for each patient, and the patients were grouped by comparing their risk scores to the mean risk score of all test patients (17 patients). Patients with scores above the mean were assigned to the high-risk group, whereas those with scores lower than the mean were assigned to the low-risk group for each model.
We then performed the log-rank test and calculated the p-value for each model. As illustrated in Figure 5, the clinical model achieved a log-rank test of 2.94 with a p-value of 0.0866. Figure 7 indicated that the radiomics model reached a log-rank test of 10.46 with a p-value of 1.22 × 10⁻³. Meanwhile, Figure 9 showed that the composite model obtained a log-rank test of 15.09 with a p-value of 1.02 × 10⁻⁴.
The three models obtained Concordance Index (CI) values of 0.615, 0.654, and 0.716 on the test dataset (17 patients).
Classification Accuracy
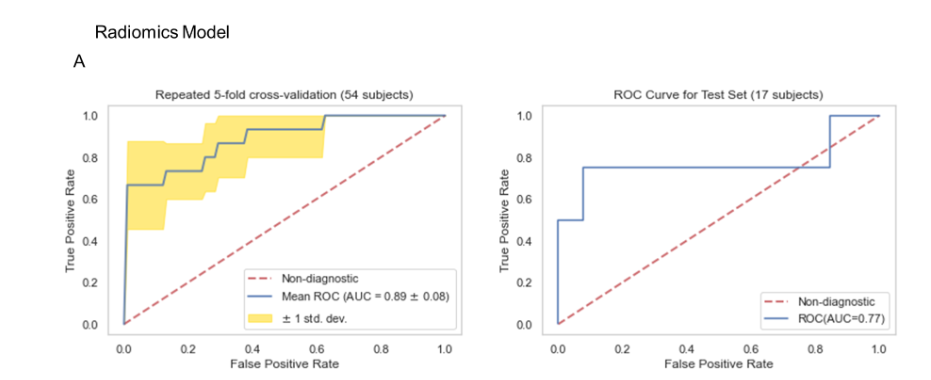
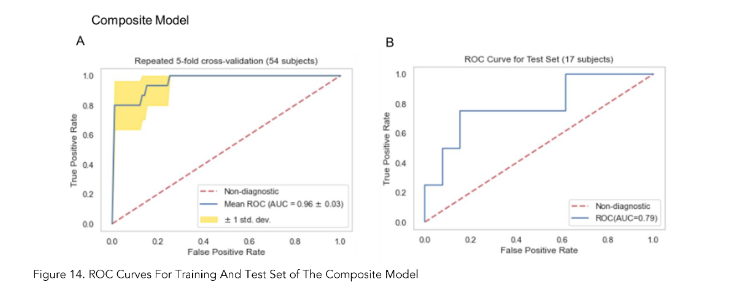
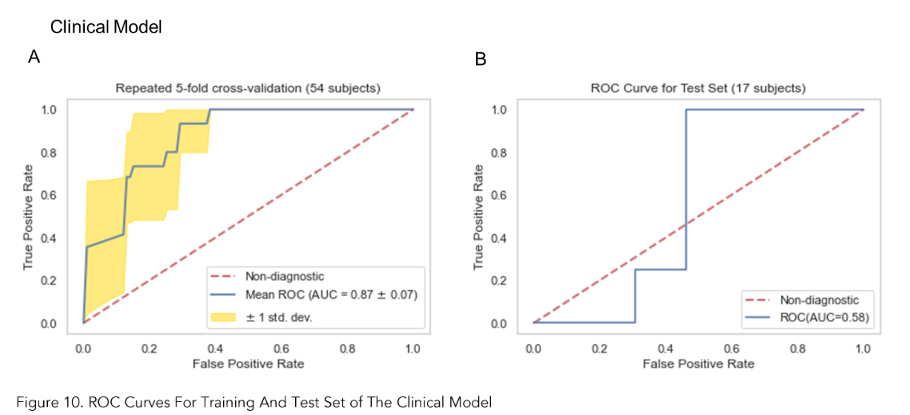
As shown in Figures 10A, 12A and 14A, repeated 5-fold cross-validation on the training dataset (54 patients) demonstrated that the clinical-only, radiomics-only, and composite models achieved average area under receiver operating characteristic curve (AUC) values of 0.87 (95% CI = 0.80–0.94), 0.89 (95% CI = 0.81–0.97), and 0.96 (95% CI = 0.93–0.99).
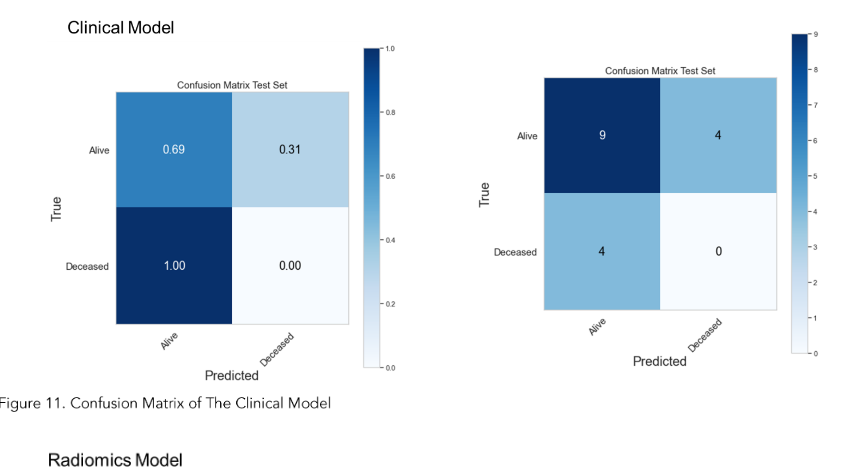
Upon evaluation with the same independent test dataset of 17 patients, each model achieved AUC values of 0.58, 0.77, and 0.79 (Figure 10B, 12B and 14B). The prediction accuracies of the three models were 0.529, 0.824, and 0.765. Figure 11 showed that after categorizing the patients into high or low risk, the clinical model achieved a sensitivity of 0.0 and a specificity of 0.69.
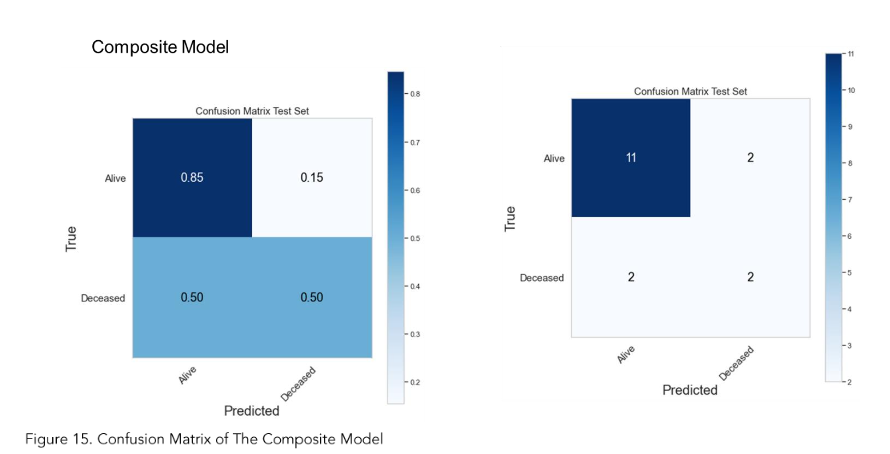
The MRI radiomics model demonstrated a sensitivity of 0.75 and a specificity of 0.85 (Figure 13). Meanwhile, Figure 15 illustrated that the composite model achieved a sensitivity of 0.50 and a specificity of 0.85.
Discussion
Owing to its capability of providing excellent soft tissue contrast, MRI is one of the most important imaging modalities in cancer management, especially for malignancies in the abdominal region. However, owing to its primary purpose of providing a visual representation of organs based on intrinsic differences in relaxation following a radiofrequency pulse, the intensity range of voxel values in MR images can vary substantially.
Additionally, the intensity distribution experiences significant intra- and inter-scanner variability due to differences in RF frequency, coil uniformity, nonlinear fields, and gradient fields. Radiomics features extracted from a set of MR images with significantly varied signal distributions can impair the robustness of the features and subsequent predictive modeling.
In our study, we addressed this issue by applying the Nyul intensity normalization on the contrast-enhanced T1-weighted MR images of our patient cohort. We demonstrated that only about 36.4% of the MR radiomics features are stable after the intensity was normalized across all the images.
We believe that intensity normalization should be a standard step in the MR radiomics workflow, as we observed significant variability in the intensity distribution of our MRI images, a relatively small sample size from a single institution.Our results also demonstrated that the MR radiomics features, after robustness analysis, provided at least complementary predictive power for predicting 2-year survival in pancreatic cancer patients. Radiomics-only model outperforms the clinical-only model as it achieved a better Concordance Index on the same test set. The composite model demonstrated the best performance among the three models, suggesting that MR radiomics analysis has the potential to be integrated into routine clinical decision-making as MR is one of the most common and non-invasive imaging modalities.
Our study has a few limitations. First, we have a relatively small sample size from a single institution, and our conclusion necessitates cautious interpretation and requires validation through external datasets. The discrepancy in AUC values observed between the training and test sets indicates that the sample size is small for a robust model evaluation. Second, we selected Min-Max normalization for data preprocessing to match the data range more effectively with the categorical variables and did not consider other normalization or transformation techniques. Third, we did not explore other intensity normalization methods such as least squares (LSQ) tissue mean normalization or Removal of Artificial Voxel Effect by Linear regression (RAVEL) methods. Moreover, continued assessment of our model is necessary following our proof-of-concept study. The model needs to be validated, and potentially improved, using external datasets. We also intend to carry out independent tests with newly acquired patient data.
Although our study has demonstrated that the T1-weighted MRI radiomics models can facilitate and enhance survival risk prediction for pancreatic cancer who received Stereotactic Body Radiation Therapy, future efforts are still warranted to investigate the radiomics model using other MRI modalities, such as functional MRI or those with more physiological relevance as Diffusion Weighted MRI. Furthermore, the biggest challenge in pancreatic cancer is the lack of a reliable early detection tool, as over 50% of pancreatic cancers are diagnosed at a late stage. Integrating radiomics models with imaging-based screening programs could potentially enhance early detection. More studies are needed in this area.
Conclusion
MR radiomics is promising in predicting the mortality of pancreatic cancer following SBRT and improving survival prediction capabilities. Intensity normalization is an essential preprocessing step to exclude unstable and/or redundant imaging features.
Conflict of Interest:
None.
Funding Statement:
None.
Acknowledgements:
None.
References
1. Siegel, R. L.; Miller, K. D.; Fuchs, H. E.; Jemal, A., Cancer statistics, 2022. CA Cancer J Clin 2022, 72 (1), 7-33.
2. SEER Database SEER Database: Percent of Cases & 5-Year Relative Survival by Stage at Diagnosis: Pancreatic Cancer. https://seer.cancer.gov/statfacts/html/pancreas.html.
3. Chin, V.; Nagrial, A.; Sjoquist, K.; O’Connor, C. A.; Chantrill, L.; Biankin, A. V.; Scholten, R. J.; Yip, D., Chemotherapy and radiotherapy for advanced pancreatic cancer. Cochrane Database Syst Rev 2018, 3 (3), CD011044.
4. Schizas, D.; Charalampakis, N.; Kole, C.; Economopoulou, P.; Koustas, E.; Gkotsis, E.; Ziogas, D.; Psyrri, A.; Karamouzis, M. V., Immunotherapy for pancreatic cancer: A 2020 update. Cancer Treat Rev 2020, 86, 102016.
5. Gerwing, M.; Herrmann, K.; Helfen, A.; Schliemann, C.; Berdel, W. E.; Eisenblatter, M.; Wildgruber, M., The beginning of the end for conventional RECIST – novel therapies require novel imaging approaches. Nat Rev Clin Oncol 2019.
6. Aerts, H. J.; Velazquez, E. R.; Leijenaar, R. T.; Parmar, C.; Grossmann, P.; Carvalho, S.; Cavalho, S.; Bussink, J.; Monshouwer, R.; Haibe-Kains, B.; Rietveld, D.; Hoebers, F.; Rietbergen, M. M.; Leemans, C. R.; Dekker, A.; Quackenbush, J.; Gillies, R. J.; Lambin, P., Decoding tumour phenotype by noninvasive imaging using a quantitative radiomics approach. Nat Commun 2014, 5, 4006.
7. Gillies, R. J.; Kinahan, P. E.; Hricak, H., Radiomics: Images Are More than Pictures, They Are Data. Radiology 2016, 278 (2), 563-77.
8. Lambin, P.; Leijenaar, R. T. H.; Deist, T. M.; Peerlings, J.; de Jong, E. E. C.; van Timmeren, J.; Sanduleanu, S.; Larue, R. T. H. M.; Even, A. J. G.; Jochems, A.; van Wijk, Y.; Woodruff, H.; van Soest, J.; Lustberg, T.; Roelofs, E.; van Elmpt, W.; Dekker, A.; Mottaghy, F. M.; Wildberger, J. E.; Walsh, S., Radiomics: the bridge between medical imaging and personalized medicine. Nat Rev Clin Oncol 2017, 14 (12), 749-762.
9. Parmar, C.; Grossmann, P.; Bussink, J.; Lambin, P.; Aerts, H. J., Machine Learning methods for Quantitative Radiomic Biomarkers. Sci Rep 2015, 5, 13087.
10. Sanduleanu, S.; Woodruff, H. C.; de Jong, E. E. C.; van Timmeren, J. E.; Jochems, A.; Dubois, L.; Lambin, P., Tracking tumor biology with radiomics: A systematic review utilizing a radiomics quality score. Radiother Oncol 2018, 127 (3), 349-360.
11. van Griethuysen, J. J. M.; Fedorov, A.; Parmar, C.; Hosny, A.; Aucoin, N.; Narayan, V.; Beets-Tan, R. G. H.; Fillion-Robin, J. C.; Pieper, S.; Aerts, H. J. W. L., Computational Radiomics System to Decode the Radiographic Phenotype. Cancer Res 2017, 77 (21), e104-e107.
12. Aerts, H. J., The Potential of Radiomic-Based Phenotyping in Precision Medicine: A Review. JAMA Oncol 2016, 2 (12), 1636-1642.
13. Bodalal, Z.; Trebeschi, S.; Nguyen-Kim, T. D. L.; Schats, W.; Beets-Tan, R., Radiogenomics: bridging imaging and genomics. Abdom Radiol (NY) 2019, 44 (6), 1960-1984.
14. Wu, J.; Tha, K. K.; Xing, L.; Li, R., Radiomics and radiogenomics for precision radiotherapy. J Radiat Res 2018, 59 (suppl_1), i25-i31.
15. Mazurowski, M. A., Radiogenomics: what it is and why it is important. J Am Coll Radiol 2015, 12 (8), 862-6.
16. Gevaert, O.; Mitchell, L. A.; Achrol, A. S.; Xu, J.; Echegaray, S.; Steinberg, G. K.; Cheshier, S. H.; Napel, S.; Zaharchuk, G.; Plevritis, S. K., Glioblastoma Multiforme: Exploratory Radiogenomic Analysis by Using Quantitative Image Features. Radiology 2015, 276 (1), 313.
17. Karlo, C. A.; Di Paolo, P. L.; Chaim, J.; Hakimi, A. A.; Ostrovnaya, I.; Russo, P.; Hricak, H.; Motzer, R.; Hsieh, J. J.; Akin, O., Radiogenomics of clear cell renal cell carcinoma: associations between CT imaging features and mutations. Radiology 2014, 270 (2), 464-71.
18. Abazeed, M. E.; Adams, D. J.; Hurov, K. E.; Tamayo, P.; Creighton, C. J.; Sonkin, D.; Giacomelli, A. O.; Du, C.; Fries, D. F.; Wong, K. K.; Mesirov, J. P.; Loeffler, J. S.; Schreiber, S. L.; Hammerman, P. S.; Meyerson, M., Integrative radiogenomic profiling of squamous cell lung cancer. Cancer Res 2013, 73 (20), 6289-98.
19. PyRadiomics Documentation. https://pyradiomics.readthedocs.io/en/latest/.
20. Pieper, S.; Lorensen, B.; Schroeder, W.; Kikinis, R. In The NA-MIC Kit: ITK, VTK, pipelines, grids and 3D slicer as an open platform for the medical image computing community, 3rd IEEE International Symposium on Biomedical Imaging: Nano to Macro, 2006., 6-9 April 2006; 2006; pp 698-701.
21. Wang, S.; Belemlilga, D.; Lei, Y.; Ganti, A. K. P.; Lin, C.; Asif, S.; Marasco, J. T.; Oh, K.; Zhou, S., Enhancing Survival Outcome Predictions in Metastatic Non-Small Cell Lung Cancer Through PET Radiomics Analysis. Cancers 2024, 16 (22), 3731.
22. Park, J. E.; Park, S. Y.; Kim, H. J.; Kim, H. S., Reproducibility and Generalizability in Radiomics Modeling: Possible Strategies in Radiologic and Statistical Perspectives. Korean J Radiol 2019, 20 (7), 1124-1137.
23. Koo, T. K.; Li, M. Y., A Guideline of Selecting and Reporting Intraclass Correlation Coefficients for Reliability Research. J Chiropr Med 2016, 15 (2), 155-63.
24. Moradmand, H.; Aghamiri, S. M. R.; Ghaderi, R., Impact of image preprocessing methods on reproducibility of radiomic features in multimodal magnetic resonance imaging in glioblastoma. J Appl Clin Med Phys 2020, 21 (1), 179-190.
25. Nyul, L. G.; Udupa, J. K.; Zhang, X., New variants of a method of MRI scale standardization. IEEE Trans Med Imaging 2000, 19 (2), 143-50.
26. Benchoufi, M.; Matzner-Lober, E.; Molinari, N.; Jannot, A. S.; Soyer, P., Interobserver agreement issues in radiology. Diagn Interv Imaging 2020, 101 (10), 639-641.
27. Polsterl, S., scikit-survival: A Library for Time-to-Event Analysis Built on Top of scikit-learn. Journal of Machine Learning Research 2020, 21 (212), 1-6 %M.
28. Chawla, N. V.; Bowyer, K. W.; Hall, L. O.; Kegelmeyer, W. P., SMOTE: synthetic minority over-sampling technique. Journal of artificial intelligence research 2002, 16, 321–357.
29. Wang, S.; Lin, C.; Kolomaya, A.; Ostdiek-Wille, G. P.; Wong, J.; Cheng, X.; Lei, Y.; Liu, C., Compute Tomography Radiomics Analysis on Whole Pancreas Between Healthy Individual and Pancreatic Ductal Adenocarcinoma Patients: Uncertainty Analysis and Predictive Modeling. Technology in Cancer Research & Treatment 2022, 21, 15330338221126869.
30. Huynh, L. M.; Bonebrake, B.; Tran, J.; Marasco, J. T.; Ahlering, T. E.; Wang, S.; Baine, M. J., Multi-Institutional Development and Validation of a Radiomic Model to Predict Prostate Cancer Recurrence Following Radical Prostatectomy. J Clin Med 2023, 12 (23).
31. Fortin, J. P.; Sweeney, E. M.; Muschelli, J.; Crainiceanu, C. M.; Shinohara, R. T.; Alzheimer’s Disease Neuroimaging, I., Removing inter-subject technical variability in magnetic resonance imaging studies. Neuroimage 2016, 132, 198-212.
Specifically, ICC (2,1) was selected to assess the single measurement absolute agreement with the 2-way random-effects model since this 2-way random-effects model is the appropriate model to generalize our reliability results, calculated as follows: ICC(2,1)=MSR−MSEMSR+(K−1)MSE+KN(MSC−MSE)\text{ICC(2,1)} = \frac{MS_R – MS_E}{MS_R + (K – 1)MS_E + \frac{K}{N}(MS_C – MS_E)}ICC(2,1)=MSR+(K−1)MSE+NK(MSC−MSE)MSR−MSE where MS is the statistical mean square for R = rows, C = columns, and E = error for the radiomics dataset.
Survival Analysis Workflow Utilizing Penalized Cox Model
We designed a survival analysis workflow that utilized a nested cross-validation approach to optimize a Cox Proportional Hazards model with elastic net regularization (penalized Cox model) for survival analysis as previously described.
Briefly, our workflow repeatedly split the data into outer training and test sets using 5-fold cross validation. Within each outer split, it performed multiple inner cross-validation repetitions, exploring various ‘l1_ratio’, ‘alpha_min_ratio’ and ‘alpha’ combinations using a grid search approach to identify the best hyperparameters. Then, the features with non-zero coefficients were ranked and stored for each inner repetition.
Subsequently, 7 best features, which were selected based on the frequency during the inner repetitions, were utilized to create a penalized cox model in the outer training set and evaluated by the outer test set. The best-performing 7-feature model was determined by its concordance index (CI) from the outer loop. Then, this best performing 7-feature model was evaluated using the independent test set (20% of the total patients) using concordance index (CI).
Three models were created by feeding clinical-only features, radiomics-only features, and a combination of both clinical and radiomics features, from the same training set (17 patients), into this workflow. The selected features were listed in Table 3.
Table 3. Feature Selected for Each Model
| Clinical Features | Radiomics Features | Composite Features |
|---|---|---|
| Chemo Drug_xeloda | wavelet-LHH_firstorder_Minimum | Resection_1 |
| Resection_1 | original_shape_Sphericity | wavelet-HHH_glrlm_LongRunEmphasis |
| N0=0, N+=1_1 | original_shape_Maximum2DDiameterRow | wavelet-LLL_firstorder_Kurtosis |
| Ethnicity_White | log-sigma-1.0-mm-3D_firstorder_Skewness | wavelet-HLL_firstorder_Mean |
| Age at Dx | wavelet-HHH_gldm_DependenceEntropy | wavelet-HHL_firstorder_Skewness |
| Rad Rx (cGy)_4000 | wavelet-LLL_firstorder_Kurtosis | Chemo Drug_xeloda |
| log-sigma-1.0-mm-3D_firstorder_Mean | Rad Rx (cGy)_3000 |
Note: N0=0, N+=1: Positive lymph node; Resection_1: Patients received resection
Classification Predictive Modeling
We trained three models utilizing the Random Forest framework, utilizing the Synthetic Minority Over-sampling Technique (SMOTE), on the same training set (54 patients) to differentiate the alive and deceased cases at 1 year.
These models utilized the same sets of clinical-only features, radiomics-only features, and a combination of both clinical and radiomics features, which were selected from the survival model. We utilized a grid-search approach to optimize the hyperparameters of the Random Forest classifier.
We utilized our in-house classification workflow to explore a parameter grid consisting of “max_depth”, “n_estimator”, “min_samples_split”, “min_samples_leaf”, “max_feature”, “bootstrap” and “criterion” with specific value ranges. We applied the Random Forest classifier with Synthetic Minority Over-Sampling Technique (SMOTE) with the best hyperparameters identified in the grid search and tested the model performance on the test dataset.
The performances of the classification models were quantified by the area under the receiver operating characteristic curve (AUC), accuracy, sensitivity, and specificity.
Results
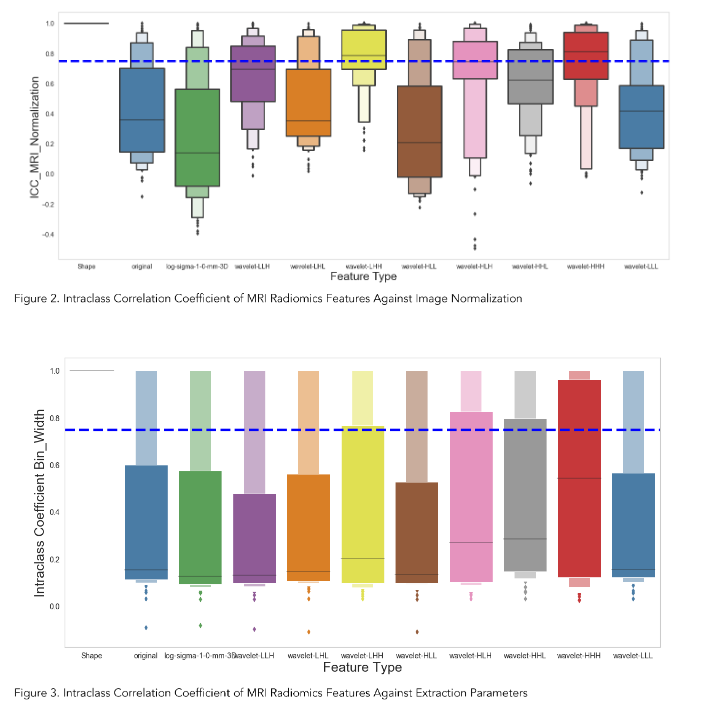
Feature Extraction and Uncertainty Analysis
We extracted 924 radiomics features for each volume of interest on each patient from the T1-weighted MRI. Figure 2 showed the Intraclass Correlation Coefficient (ICC) of all the extracted features, grouped by their radiomics feature classes, against the variabilities in MRI signal intensity normalization. We found that 336 features (36.4%) had ICCs greater than 0.75 and were therefore considered stable features against perturbations.
| Model | Radiomics Features |
|---|---|
| Clinical-only | 239 features out of 928 had ICCs >0.6. |
| MRI Radiomics | Identified 95.2% of the radiomics features. |
Survival Analysis
As illustrated in Figure 5, the clinical radiomics model achieved a higher Concordance Index on the test set. The composite model demonstrated the best performance among the three models, suggesting that MR radiomics analysis has the potential to be integrated into the routine clinical decision-making as MR is one of the most common and non-invasive imaging modalities.
Feature Selection
The penalized Cox model differs from the traditional Cox Proportional Hazards model by incorporating L1 and/or L2 penalties, which allows it to perform feature selection and survival analysis simultaneously. This feature makes it more effective for modeling large and high-dimensional datasets.
The features of clinical-only, radiomics-only, and composite models were determined by our in-house workflow involving the use of the penalized Cox model. Figures 4, 6, and 8 showed the top selected features with their coefficients from the clinical-only, radiomics-only, and the composite models. The selected features were also summarized in Table 3.
Survival Analysis
Each 7-feature model (clinical-only, radiomics-only, and the composite) predicted a risk score for each patient, and the patients were grouped by comparing their risk scores to the mean risk score of all test patients (17 patients). Patients with scores above the mean were assigned to the high-risk group, whereas those with scores lower than the mean were assigned to the low-risk group for each model.
We then performed the log-rank test and calculated the p-value for each model. As illustrated in Figure 5, the clinical model achieved a log-rank test of 2.94 with a p-value of 0.0866. Figure 7 indicated that the radiomics model reached a log-rank test of 10.46 with a p-value of 1.22 × 10⁻³. Meanwhile, Figure 9 showed that the composite model obtained a log-rank test of 15.09 with a p-value of 1.02 × 10⁻⁴.
The three models obtained Concordance Index (CI) values of 0.615, 0.654, and 0.716 on the test dataset (17 patients).
Classification Accuracy
As shown in Figures 10A, 12A and 14A, repeated 5-fold cross-validation on the training dataset (54 patients) demonstrated that the clinical-only, radiomics-only, and composite models achieved average area under receiver operating characteristic curve (AUC) values of 0.87 (95% CI = 0.80–0.94), 0.89 (95% CI = 0.81–0.97), and 0.96 (95% CI = 0.93–0.99).
Upon evaluation with the same independent test dataset of 17 patients, each model achieved AUC values of 0.58, 0.77, and 0.79 (Figure 10B, 12B and 14B). The prediction accuracies of the three models were 0.529, 0.824, and 0.765. Figure 11 showed that after categorizing the patients into high or low risk, the clinical model achieved a sensitivity of 0.0 and a specificity of 0.69.
The MRI radiomics model demonstrated a sensitivity of 0.75 and a specificity of 0.85 (Figure 13). Meanwhile, Figure 15 illustrated that the composite model achieved a sensitivity of 0.50 and a specificity of 0.85.
Discussion
Owing to its capability of providing excellent soft tissue contrast, MRI is one of the most important imaging modalities in cancer management, especially for malignancies in the abdominal region. However, owing to its primary purpose of providing a visual representation of organs based on intrinsic differences in relaxation following a radiofrequency pulse, the intensity range of voxel values in MR images can vary substantially.
Additionally, the intensity distribution experiences significant intra- and inter-scanner variability due to differences in RF frequency, coil uniformity, nonlinear fields, and gradient fields. Radiomics features extracted from a set of MR images with significantly varied signal distributions can impair the robustness of the features and subsequent predictive modeling.
In our study, we addressed this issue by applying the Nyul intensity normalization on the contrast-enhanced T1-weighted MR images of our patient cohort. We demonstrated that only about 36.4% of the MR radiomics features are stable after the intensity was normalized across all the images.
We believe that intensity normalization should be a standard step in the MR radiomics workflow, as we observed significant variability in the intensity distribution of our MRI images, a relatively small sample size from a single institution.Our results also demonstrated that the MR radiomics features, after robustness analysis, provided at least complementary predictive power for predicting 2-year survival in pancreatic cancer patients. Radiomics-only model outperforms the clinical-only model as it achieved a better Concordance Index on the same test set. The composite model demonstrated the best performance among the three models, suggesting that MR radiomics analysis has the potential to be integrated into routine clinical decision-making as MR is one of the most common and non-invasive imaging modalities.
Our study has a few limitations. First, we have a relatively small sample size from a single institution, and our conclusion necessitates cautious interpretation and requires validation through external datasets. The discrepancy in AUC values observed between the training and test sets indicates that the sample size is small for a robust model evaluation. Second, we selected Min-Max normalization for data preprocessing to match the data range more effectively with the categorical variables and did not consider other normalization or transformation techniques. Third, we did not explore other intensity normalization methods such as least squares (LSQ) tissue mean normalization or Removal of Artificial Voxel Effect by Linear regression (RAVEL) methods. Moreover, continued assessment of our model is necessary following our proof-of-concept study. The model needs to be validated, and potentially improved, using external datasets. We also intend to carry out independent tests with newly acquired patient data.
Although our study has demonstrated that the T1-weighted MRI radiomics models can facilitate and enhance survival risk prediction for pancreatic cancer who received Stereotactic Body Radiation Therapy, future efforts are still warranted to investigate the radiomics model using other MRI modalities, such as functional MRI or those with more physiological relevance as Diffusion Weighted MRI. Furthermore, the biggest challenge in pancreatic cancer is the lack of a reliable early detection tool, as over 50% of pancreatic cancers are diagnosed at a late stage. Integrating radiomics models with imaging-based screening programs could potentially enhance early detection. More studies are needed in this area.
Conclusion
MR radiomics is promising in predicting the mortality of pancreatic cancer following SBRT and improving survival prediction capabilities. Intensity normalization is an essential preprocessing step to exclude unstable and/or redundant imaging features.
Conflict of Interest:
None.
Funding Statement:
None.
Acknowledgements:
None.
References
1. Siegel, R. L.; Miller, K. D.; Fuchs, H. E.; Jemal, A., Cancer statistics, 2022. CA Cancer J Clin 2022, 72 (1), 7-33.
2. SEER Database SEER Database: Percent of Cases & 5-Year Relative Survival by Stage at Diagnosis: Pancreatic Cancer. https://seer.cancer.gov/statfacts/html/pancreas.html.
3. Chin, V.; Nagrial, A.; Sjoquist, K.; O’Connor, C. A.; Chantrill, L.; Biankin, A. V.; Scholten, R. J.; Yip, D., Chemotherapy and radiotherapy for advanced pancreatic cancer. Cochrane Database Syst Rev 2018, 3 (3), CD011044.
4. Schizas, D.; Charalampakis, N.; Kole, C.; Economopoulou, P.; Koustas, E.; Gkotsis, E.; Ziogas, D.; Psyrri, A.; Karamouzis, M. V., Immunotherapy for pancreatic cancer: A 2020 update. Cancer Treat Rev 2020, 86, 102016.
5. Gerwing, M.; Herrmann, K.; Helfen, A.; Schliemann, C.; Berdel, W. E.; Eisenblatter, M.; Wildgruber, M., The beginning of the end for conventional RECIST – novel therapies require novel imaging approaches. Nat Rev Clin Oncol 2019.
6. Aerts, H. J.; Velazquez, E. R.; Leijenaar, R. T.; Parmar, C.; Grossmann, P.; Carvalho, S.; Cavalho, S.; Bussink, J.; Monshouwer, R.; Haibe-Kains, B.; Rietveld, D.; Hoebers, F.; Rietbergen, M. M.; Leemans, C. R.; Dekker, A.; Quackenbush, J.; Gillies, R. J.; Lambin, P., Decoding tumour phenotype by noninvasive imaging using a quantitative radiomics approach. Nat Commun 2014, 5, 4006.
7. Gillies, R. J.; Kinahan, P. E.; Hricak, H., Radiomics: Images Are More than Pictures, They Are Data. Radiology 2016, 278 (2), 563-77.
8. Lambin, P.; Leijenaar, R. T. H.; Deist, T. M.; Peerlings, J.; de Jong, E. E. C.; van Timmeren, J.; Sanduleanu, S.; Larue, R. T. H. M.; Even, A. J. G.; Jochems, A.; van Wijk, Y.; Woodruff, H.; van Soest, J.; Lustberg, T.; Roelofs, E.; van Elmpt, W.; Dekker, A.; Mottaghy, F. M.; Wildberger, J. E.; Walsh, S., Radiomics: the bridge between medical imaging and personalized medicine. Nat Rev Clin Oncol 2017, 14 (12), 749-762.
9. Parmar, C.; Grossmann, P.; Bussink, J.; Lambin, P.; Aerts, H. J., Machine Learning methods for Quantitative Radiomic Biomarkers. Sci Rep 2015, 5, 13087.
10. Sanduleanu, S.; Woodruff, H. C.; de Jong, E. E. C.; van Timmeren, J. E.; Jochems, A.; Dubois, L.; Lambin, P., Tracking tumor biology with radiomics: A systematic review utilizing a radiomics quality score. Radiother Oncol 2018, 127 (3), 349-360.
11. van Griethuysen, J. J. M.; Fedorov, A.; Parmar, C.; Hosny, A.; Aucoin, N.; Narayan, V.; Beets-Tan, R. G. H.; Fillion-Robin, J. C.; Pieper, S.; Aerts, H. J. W. L., Computational Radiomics System to Decode the Radiographic Phenotype. Cancer Res 2017, 77 (21), e104-e107.
12. Aerts, H. J., The Potential of Radiomic-Based Phenotyping in Precision Medicine: A Review. JAMA Oncol 2016, 2 (12), 1636-1642.
13. Bodalal, Z.; Trebeschi, S.; Nguyen-Kim, T. D. L.; Schats, W.; Beets-Tan, R., Radiogenomics: bridging imaging and genomics. Abdom Radiol (NY) 2019, 44 (6), 1960-1984.
14. Wu, J.; Tha, K. K.; Xing, L.; Li, R., Radiomics and radiogenomics for precision radiotherapy. J Radiat Res 2018, 59 (suppl_1), i25-i31.
15. Mazurowski, M. A., Radiogenomics: what it is and why it is important. J Am Coll Radiol 2015, 12 (8), 862-6.
16. Gevaert, O.; Mitchell, L. A.; Achrol, A. S.; Xu, J.; Echegaray, S.; Steinberg, G. K.; Cheshier, S. H.; Napel, S.; Zaharchuk, G.; Plevritis, S. K., Glioblastoma Multiforme: Exploratory Radiogenomic Analysis by Using Quantitative Image Features. Radiology 2015, 276 (1), 313.
17. Karlo, C. A.; Di Paolo, P. L.; Chaim, J.; Hakimi, A. A.; Ostrovnaya, I.; Russo, P.; Hricak, H.; Motzer, R.; Hsieh, J. J.; Akin, O., Radiogenomics of clear cell renal cell carcinoma: associations between CT imaging features and mutations. Radiology 2014, 270 (2), 464-71.
18. Abazeed, M. E.; Adams, D. J.; Hurov, K. E.; Tamayo, P.; Creighton, C. J.; Sonkin, D.; Giacomelli, A. O.; Du, C.; Fries, D. F.; Wong, K. K.; Mesirov, J. P.; Loeffler, J. S.; Schreiber, S. L.; Hammerman, P. S.; Meyerson, M., Integrative radiogenomic profiling of squamous cell lung cancer. Cancer Res 2013, 73 (20), 6289-98.
19. PyRadiomics Documentation. https://pyradiomics.readthedocs.io/en/latest/.
20. Pieper, S.; Lorensen, B.; Schroeder, W.; Kikinis, R. In The NA-MIC Kit: ITK, VTK, pipelines, grids and 3D slicer as an open platform for the medical image computing community, 3rd IEEE International Symposium on Biomedical Imaging: Nano to Macro, 2006., 6-9 April 2006; 2006; pp 698-701.
21. Wang, S.; Belemlilga, D.; Lei, Y.; Ganti, A. K. P.; Lin, C.; Asif, S.; Marasco, J. T.; Oh, K.; Zhou, S., Enhancing Survival Outcome Predictions in Metastatic Non-Small Cell Lung Cancer Through PET Radiomics Analysis. Cancers 2024, 16 (22), 3731.
22. Park, J. E.; Park, S. Y.; Kim, H. J.; Kim, H. S., Reproducibility and Generalizability in Radiomics Modeling: Possible Strategies in Radiologic and Statistical Perspectives. Korean J Radiol 2019, 20 (7), 1124-1137.
23. Koo, T. K.; Li, M. Y., A Guideline of Selecting and Reporting Intraclass Correlation Coefficients for Reliability Research. J Chiropr Med 2016, 15 (2), 155-63.
24. Moradmand, H.; Aghamiri, S. M. R.; Ghaderi, R., Impact of image preprocessing methods on reproducibility of radiomic features in multimodal magnetic resonance imaging in glioblastoma. J Appl Clin Med Phys 2020, 21 (1), 179-190.
25. Nyul, L. G.; Udupa, J. K.; Zhang, X., New variants of a method of MRI scale standardization. IEEE Trans Med Imaging 2000, 19 (2), 143-50.
26. Benchoufi, M.; Matzner-Lober, E.; Molinari, N.; Jannot, A. S.; Soyer, P., Interobserver agreement issues in radiology. Diagn Interv Imaging 2020, 101 (10), 639-641.
27. Polsterl, S., scikit-survival: A Library for Time-to-Event Analysis Built on Top of scikit-learn. Journal of Machine Learning Research 2020, 21 (212), 1-6 %M.
28. Chawla, N. V.; Bowyer, K. W.; Hall, L. O.; Kegelmeyer, W. P., SMOTE: synthetic minority over-sampling technique. Journal of artificial intelligence research 2002, 16, 321–357.
29. Wang, S.; Lin, C.; Kolomaya, A.; Ostdiek-Wille, G. P.; Wong, J.; Cheng, X.; Lei, Y.; Liu, C., Compute Tomography Radiomics Analysis on Whole Pancreas Between Healthy Individual and Pancreatic Ductal Adenocarcinoma Patients: Uncertainty Analysis and Predictive Modeling. Technology in Cancer Research & Treatment 2022, 21, 15330338221126869.
30. Huynh, L. M.; Bonebrake, B.; Tran, J.; Marasco, J. T.; Ahlering, T. E.; Wang, S.; Baine, M. J., Multi-Institutional Development and Validation of a Radiomic Model to Predict Prostate Cancer Recurrence Following Radical Prostatectomy. J Clin Med 2023, 12 (23).
31. Fortin, J. P.; Sweeney, E. M.; Muschelli, J.; Crainiceanu, C. M.; Shinohara, R. T.; Alzheimer’s Disease Neuroimaging, I., Removing inter-subject technical variability in magnetic resonance imaging studies. Neuroimage 2016, 132, 198-212.
The robustness of features with respect to these perturbations was assessed using Intraclass Correlation Coefficient (ICC), where unstable features were removed from final dataset for performing classification and predictive analysis.
Intensity Normalization
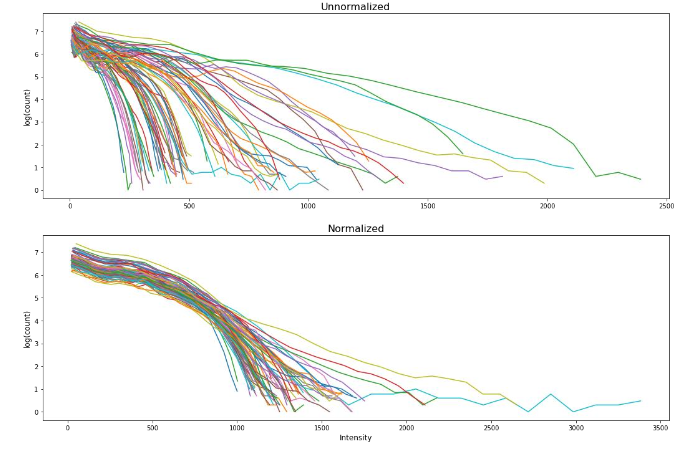
To get a consistent scheme for the comparison of MR images, the first problem to be addressed is the varying signal intensity that is received across MRI scans. Inter- and intra-scanner intensity non-uniformities across MRI scans can arise due to changes in RF frequency, coil uniformity, nonlinear fields, gradient fields, etc. Image pre-processing methods (intensity normalization among the various methods) were employed to mitigate these issues where possible.
Intensity normalization was performed using the method first introduced by Nyul et al., taking the approach of linear histogram matching in which the intensity distributions from a set of MR images can be mapped onto a “standard histogram” that acts as a map for renormalization. Figure 1 showed the MRI intensity normalization of the patient cohort.
Bin Width and Resampling
Image voxel size and extraction bin width are two important feature extraction parameters. We aimed to investigate how different bin widths and resampling techniques (with or without resampling) impact the stability of the extracted features. We chose five different gray-level discretization values for voxel intensity — 5, 10, 25, 50, and 75 — and applied them with the original resolution and a resampled resolution of 1.0 mm × 1.0 mm × 1.0 mm.
Original planar resolutions range from 0.52 mm × 0.52 mm to 1.2 mm × 1.2 mm and original slice width ranges from 1.4 mm to 2.5 mm. The combination of the bin width and resampling allowed for a total of ten different parameter sets to be explored for feature robustness. ICC > 0.75 was again the threshold for the determination of the robust features using different feature extraction parameters.
Feature Stability Evaluation
Intraclass Correlation Coefficient (ICC) is the statistical measure used to quantitatively assess the robustness of radiomics features against various perturbations. In this study, the MRI features were extracted under different perturbations to the dataset (bin width and intensity normalization) and evaluated for robustness using ICC.
Specifically, ICC (2,1) was selected to assess the single measurement absolute agreement with the 2-way random-effects model since this 2-way random-effects model is the appropriate model to generalize our reliability results, calculated as follows: ICC(2,1)=MSR−MSEMSR+(K−1)MSE+KN(MSC−MSE)\text{ICC(2,1)} = \frac{MS_R – MS_E}{MS_R + (K – 1)MS_E + \frac{K}{N}(MS_C – MS_E)}ICC(2,1)=MSR+(K−1)MSE+NK(MSC−MSE)MSR−MSE where MS is the statistical mean square for R = rows, C = columns, and E = error for the radiomics dataset.
Survival Analysis Workflow Utilizing Penalized Cox Model
We designed a survival analysis workflow that utilized a nested cross-validation approach to optimize a Cox Proportional Hazards model with elastic net regularization (penalized Cox model) for survival analysis as previously described.
Briefly, our workflow repeatedly split the data into outer training and test sets using 5-fold cross validation. Within each outer split, it performed multiple inner cross-validation repetitions, exploring various ‘l1_ratio’, ‘alpha_min_ratio’ and ‘alpha’ combinations using a grid search approach to identify the best hyperparameters. Then, the features with non-zero coefficients were ranked and stored for each inner repetition.
Subsequently, 7 best features, which were selected based on the frequency during the inner repetitions, were utilized to create a penalized cox model in the outer training set and evaluated by the outer test set. The best-performing 7-feature model was determined by its concordance index (CI) from the outer loop. Then, this best performing 7-feature model was evaluated using the independent test set (20% of the total patients) using concordance index (CI).
Three models were created by feeding clinical-only features, radiomics-only features, and a combination of both clinical and radiomics features, from the same training set (17 patients), into this workflow. The selected features were listed in Table 3.
Table 3. Feature Selected for Each Model
| Clinical Features | Radiomics Features | Composite Features |
|---|---|---|
| Chemo Drug_xeloda | wavelet-LHH_firstorder_Minimum | Resection_1 |
| Resection_1 | original_shape_Sphericity | wavelet-HHH_glrlm_LongRunEmphasis |
| N0=0, N+=1_1 | original_shape_Maximum2DDiameterRow | wavelet-LLL_firstorder_Kurtosis |
| Ethnicity_White | log-sigma-1.0-mm-3D_firstorder_Skewness | wavelet-HLL_firstorder_Mean |
| Age at Dx | wavelet-HHH_gldm_DependenceEntropy | wavelet-HHL_firstorder_Skewness |
| Rad Rx (cGy)_4000 | wavelet-LLL_firstorder_Kurtosis | Chemo Drug_xeloda |
| log-sigma-1.0-mm-3D_firstorder_Mean | Rad Rx (cGy)_3000 |
Note: N0=0, N+=1: Positive lymph node; Resection_1: Patients received resection
Classification Predictive Modeling
We trained three models utilizing the Random Forest framework, utilizing the Synthetic Minority Over-sampling Technique (SMOTE), on the same training set (54 patients) to differentiate the alive and deceased cases at 1 year.
These models utilized the same sets of clinical-only features, radiomics-only features, and a combination of both clinical and radiomics features, which were selected from the survival model. We utilized a grid-search approach to optimize the hyperparameters of the Random Forest classifier.
We utilized our in-house classification workflow to explore a parameter grid consisting of “max_depth”, “n_estimator”, “min_samples_split”, “min_samples_leaf”, “max_feature”, “bootstrap” and “criterion” with specific value ranges. We applied the Random Forest classifier with Synthetic Minority Over-Sampling Technique (SMOTE) with the best hyperparameters identified in the grid search and tested the model performance on the test dataset.
The performances of the classification models were quantified by the area under the receiver operating characteristic curve (AUC), accuracy, sensitivity, and specificity.
Results
Feature Extraction and Uncertainty Analysis
We extracted 924 radiomics features for each volume of interest on each patient from the T1-weighted MRI. Figure 2 showed the Intraclass Correlation Coefficient (ICC) of all the extracted features, grouped by their radiomics feature classes, against the variabilities in MRI signal intensity normalization. We found that 336 features (36.4%) had ICCs greater than 0.75 and were therefore considered stable features against perturbations.
| Model | Radiomics Features |
|---|---|
| Clinical-only | 239 features out of 928 had ICCs >0.6. |
| MRI Radiomics | Identified 95.2% of the radiomics features. |
Survival Analysis
As illustrated in Figure 5, the clinical radiomics model achieved a higher Concordance Index on the test set. The composite model demonstrated the best performance among the three models, suggesting that MR radiomics analysis has the potential to be integrated into the routine clinical decision-making as MR is one of the most common and non-invasive imaging modalities.
Feature Selection
The penalized Cox model differs from the traditional Cox Proportional Hazards model by incorporating L1 and/or L2 penalties, which allows it to perform feature selection and survival analysis simultaneously. This feature makes it more effective for modeling large and high-dimensional datasets.
The features of clinical-only, radiomics-only, and composite models were determined by our in-house workflow involving the use of the penalized Cox model. Figures 4, 6, and 8 showed the top selected features with their coefficients from the clinical-only, radiomics-only, and the composite models. The selected features were also summarized in Table 3.
Survival Analysis
Each 7-feature model (clinical-only, radiomics-only, and the composite) predicted a risk score for each patient, and the patients were grouped by comparing their risk scores to the mean risk score of all test patients (17 patients). Patients with scores above the mean were assigned to the high-risk group, whereas those with scores lower than the mean were assigned to the low-risk group for each model.
We then performed the log-rank test and calculated the p-value for each model. As illustrated in Figure 5, the clinical model achieved a log-rank test of 2.94 with a p-value of 0.0866. Figure 7 indicated that the radiomics model reached a log-rank test of 10.46 with a p-value of 1.22 × 10⁻³. Meanwhile, Figure 9 showed that the composite model obtained a log-rank test of 15.09 with a p-value of 1.02 × 10⁻⁴.
The three models obtained Concordance Index (CI) values of 0.615, 0.654, and 0.716 on the test dataset (17 patients).
Classification Accuracy
As shown in Figures 10A, 12A and 14A, repeated 5-fold cross-validation on the training dataset (54 patients) demonstrated that the clinical-only, radiomics-only, and composite models achieved average area under receiver operating characteristic curve (AUC) values of 0.87 (95% CI = 0.80–0.94), 0.89 (95% CI = 0.81–0.97), and 0.96 (95% CI = 0.93–0.99).
Upon evaluation with the same independent test dataset of 17 patients, each model achieved AUC values of 0.58, 0.77, and 0.79 (Figure 10B, 12B and 14B). The prediction accuracies of the three models were 0.529, 0.824, and 0.765. Figure 11 showed that after categorizing the patients into high or low risk, the clinical model achieved a sensitivity of 0.0 and a specificity of 0.69.
The MRI radiomics model demonstrated a sensitivity of 0.75 and a specificity of 0.85 (Figure 13). Meanwhile, Figure 15 illustrated that the composite model achieved a sensitivity of 0.50 and a specificity of 0.85.
Discussion
Owing to its capability of providing excellent soft tissue contrast, MRI is one of the most important imaging modalities in cancer management, especially for malignancies in the abdominal region. However, owing to its primary purpose of providing a visual representation of organs based on intrinsic differences in relaxation following a radiofrequency pulse, the intensity range of voxel values in MR images can vary substantially.
Additionally, the intensity distribution experiences significant intra- and inter-scanner variability due to differences in RF frequency, coil uniformity, nonlinear fields, and gradient fields. Radiomics features extracted from a set of MR images with significantly varied signal distributions can impair the robustness of the features and subsequent predictive modeling.
In our study, we addressed this issue by applying the Nyul intensity normalization on the contrast-enhanced T1-weighted MR images of our patient cohort. We demonstrated that only about 36.4% of the MR radiomics features are stable after the intensity was normalized across all the images.
We believe that intensity normalization should be a standard step in the MR radiomics workflow, as we observed significant variability in the intensity distribution of our MRI images, a relatively small sample size from a single institution.Our results also demonstrated that the MR radiomics features, after robustness analysis, provided at least complementary predictive power for predicting 2-year survival in pancreatic cancer patients. Radiomics-only model outperforms the clinical-only model as it achieved a better Concordance Index on the same test set. The composite model demonstrated the best performance among the three models, suggesting that MR radiomics analysis has the potential to be integrated into routine clinical decision-making as MR is one of the most common and non-invasive imaging modalities.
Our study has a few limitations. First, we have a relatively small sample size from a single institution, and our conclusion necessitates cautious interpretation and requires validation through external datasets. The discrepancy in AUC values observed between the training and test sets indicates that the sample size is small for a robust model evaluation. Second, we selected Min-Max normalization for data preprocessing to match the data range more effectively with the categorical variables and did not consider other normalization or transformation techniques. Third, we did not explore other intensity normalization methods such as least squares (LSQ) tissue mean normalization or Removal of Artificial Voxel Effect by Linear regression (RAVEL) methods. Moreover, continued assessment of our model is necessary following our proof-of-concept study. The model needs to be validated, and potentially improved, using external datasets. We also intend to carry out independent tests with newly acquired patient data.
Although our study has demonstrated that the T1-weighted MRI radiomics models can facilitate and enhance survival risk prediction for pancreatic cancer who received Stereotactic Body Radiation Therapy, future efforts are still warranted to investigate the radiomics model using other MRI modalities, such as functional MRI or those with more physiological relevance as Diffusion Weighted MRI. Furthermore, the biggest challenge in pancreatic cancer is the lack of a reliable early detection tool, as over 50% of pancreatic cancers are diagnosed at a late stage. Integrating radiomics models with imaging-based screening programs could potentially enhance early detection. More studies are needed in this area.
Conclusion
MR radiomics is promising in predicting the mortality of pancreatic cancer following SBRT and improving survival prediction capabilities. Intensity normalization is an essential preprocessing step to exclude unstable and/or redundant imaging features.
Conflict of Interest:
None.
Funding Statement:
None.
Acknowledgements:
None.
References
1. Siegel, R. L.; Miller, K. D.; Fuchs, H. E.; Jemal, A., Cancer statistics, 2022. CA Cancer J Clin 2022, 72 (1), 7-33.
2. SEER Database SEER Database: Percent of Cases & 5-Year Relative Survival by Stage at Diagnosis: Pancreatic Cancer. https://seer.cancer.gov/statfacts/html/pancreas.html.
3. Chin, V.; Nagrial, A.; Sjoquist, K.; O’Connor, C. A.; Chantrill, L.; Biankin, A. V.; Scholten, R. J.; Yip, D., Chemotherapy and radiotherapy for advanced pancreatic cancer. Cochrane Database Syst Rev 2018, 3 (3), CD011044.
4. Schizas, D.; Charalampakis, N.; Kole, C.; Economopoulou, P.; Koustas, E.; Gkotsis, E.; Ziogas, D.; Psyrri, A.; Karamouzis, M. V., Immunotherapy for pancreatic cancer: A 2020 update. Cancer Treat Rev 2020, 86, 102016.
5. Gerwing, M.; Herrmann, K.; Helfen, A.; Schliemann, C.; Berdel, W. E.; Eisenblatter, M.; Wildgruber, M., The beginning of the end for conventional RECIST – novel therapies require novel imaging approaches. Nat Rev Clin Oncol 2019.
6. Aerts, H. J.; Velazquez, E. R.; Leijenaar, R. T.; Parmar, C.; Grossmann, P.; Carvalho, S.; Cavalho, S.; Bussink, J.; Monshouwer, R.; Haibe-Kains, B.; Rietveld, D.; Hoebers, F.; Rietbergen, M. M.; Leemans, C. R.; Dekker, A.; Quackenbush, J.; Gillies, R. J.; Lambin, P., Decoding tumour phenotype by noninvasive imaging using a quantitative radiomics approach. Nat Commun 2014, 5, 4006.
7. Gillies, R. J.; Kinahan, P. E.; Hricak, H., Radiomics: Images Are More than Pictures, They Are Data. Radiology 2016, 278 (2), 563-77.
8. Lambin, P.; Leijenaar, R. T. H.; Deist, T. M.; Peerlings, J.; de Jong, E. E. C.; van Timmeren, J.; Sanduleanu, S.; Larue, R. T. H. M.; Even, A. J. G.; Jochems, A.; van Wijk, Y.; Woodruff, H.; van Soest, J.; Lustberg, T.; Roelofs, E.; van Elmpt, W.; Dekker, A.; Mottaghy, F. M.; Wildberger, J. E.; Walsh, S., Radiomics: the bridge between medical imaging and personalized medicine. Nat Rev Clin Oncol 2017, 14 (12), 749-762.
9. Parmar, C.; Grossmann, P.; Bussink, J.; Lambin, P.; Aerts, H. J., Machine Learning methods for Quantitative Radiomic Biomarkers. Sci Rep 2015, 5, 13087.
10. Sanduleanu, S.; Woodruff, H. C.; de Jong, E. E. C.; van Timmeren, J. E.; Jochems, A.; Dubois, L.; Lambin, P., Tracking tumor biology with radiomics: A systematic review utilizing a radiomics quality score. Radiother Oncol 2018, 127 (3), 349-360.
11. van Griethuysen, J. J. M.; Fedorov, A.; Parmar, C.; Hosny, A.; Aucoin, N.; Narayan, V.; Beets-Tan, R. G. H.; Fillion-Robin, J. C.; Pieper, S.; Aerts, H. J. W. L., Computational Radiomics System to Decode the Radiographic Phenotype. Cancer Res 2017, 77 (21), e104-e107.
12. Aerts, H. J., The Potential of Radiomic-Based Phenotyping in Precision Medicine: A Review. JAMA Oncol 2016, 2 (12), 1636-1642.
13. Bodalal, Z.; Trebeschi, S.; Nguyen-Kim, T. D. L.; Schats, W.; Beets-Tan, R., Radiogenomics: bridging imaging and genomics. Abdom Radiol (NY) 2019, 44 (6), 1960-1984.
14. Wu, J.; Tha, K. K.; Xing, L.; Li, R., Radiomics and radiogenomics for precision radiotherapy. J Radiat Res 2018, 59 (suppl_1), i25-i31.
15. Mazurowski, M. A., Radiogenomics: what it is and why it is important. J Am Coll Radiol 2015, 12 (8), 862-6.
16. Gevaert, O.; Mitchell, L. A.; Achrol, A. S.; Xu, J.; Echegaray, S.; Steinberg, G. K.; Cheshier, S. H.; Napel, S.; Zaharchuk, G.; Plevritis, S. K., Glioblastoma Multiforme: Exploratory Radiogenomic Analysis by Using Quantitative Image Features. Radiology 2015, 276 (1), 313.
17. Karlo, C. A.; Di Paolo, P. L.; Chaim, J.; Hakimi, A. A.; Ostrovnaya, I.; Russo, P.; Hricak, H.; Motzer, R.; Hsieh, J. J.; Akin, O., Radiogenomics of clear cell renal cell carcinoma: associations between CT imaging features and mutations. Radiology 2014, 270 (2), 464-71.
18. Abazeed, M. E.; Adams, D. J.; Hurov, K. E.; Tamayo, P.; Creighton, C. J.; Sonkin, D.; Giacomelli, A. O.; Du, C.; Fries, D. F.; Wong, K. K.; Mesirov, J. P.; Loeffler, J. S.; Schreiber, S. L.; Hammerman, P. S.; Meyerson, M., Integrative radiogenomic profiling of squamous cell lung cancer. Cancer Res 2013, 73 (20), 6289-98.
19. PyRadiomics Documentation. https://pyradiomics.readthedocs.io/en/latest/.
20. Pieper, S.; Lorensen, B.; Schroeder, W.; Kikinis, R. In The NA-MIC Kit: ITK, VTK, pipelines, grids and 3D slicer as an open platform for the medical image computing community, 3rd IEEE International Symposium on Biomedical Imaging: Nano to Macro, 2006., 6-9 April 2006; 2006; pp 698-701.
21. Wang, S.; Belemlilga, D.; Lei, Y.; Ganti, A. K. P.; Lin, C.; Asif, S.; Marasco, J. T.; Oh, K.; Zhou, S., Enhancing Survival Outcome Predictions in Metastatic Non-Small Cell Lung Cancer Through PET Radiomics Analysis. Cancers 2024, 16 (22), 3731.
22. Park, J. E.; Park, S. Y.; Kim, H. J.; Kim, H. S., Reproducibility and Generalizability in Radiomics Modeling: Possible Strategies in Radiologic and Statistical Perspectives. Korean J Radiol 2019, 20 (7), 1124-1137.
23. Koo, T. K.; Li, M. Y., A Guideline of Selecting and Reporting Intraclass Correlation Coefficients for Reliability Research. J Chiropr Med 2016, 15 (2), 155-63.
24. Moradmand, H.; Aghamiri, S. M. R.; Ghaderi, R., Impact of image preprocessing methods on reproducibility of radiomic features in multimodal magnetic resonance imaging in glioblastoma. J Appl Clin Med Phys 2020, 21 (1), 179-190.
25. Nyul, L. G.; Udupa, J. K.; Zhang, X., New variants of a method of MRI scale standardization. IEEE Trans Med Imaging 2000, 19 (2), 143-50.
26. Benchoufi, M.; Matzner-Lober, E.; Molinari, N.; Jannot, A. S.; Soyer, P., Interobserver agreement issues in radiology. Diagn Interv Imaging 2020, 101 (10), 639-641.
27. Polsterl, S., scikit-survival: A Library for Time-to-Event Analysis Built on Top of scikit-learn. Journal of Machine Learning Research 2020, 21 (212), 1-6 %M.
28. Chawla, N. V.; Bowyer, K. W.; Hall, L. O.; Kegelmeyer, W. P., SMOTE: synthetic minority over-sampling technique. Journal of artificial intelligence research 2002, 16, 321–357.
29. Wang, S.; Lin, C.; Kolomaya, A.; Ostdiek-Wille, G. P.; Wong, J.; Cheng, X.; Lei, Y.; Liu, C., Compute Tomography Radiomics Analysis on Whole Pancreas Between Healthy Individual and Pancreatic Ductal Adenocarcinoma Patients: Uncertainty Analysis and Predictive Modeling. Technology in Cancer Research & Treatment 2022, 21, 15330338221126869.
30. Huynh, L. M.; Bonebrake, B.; Tran, J.; Marasco, J. T.; Ahlering, T. E.; Wang, S.; Baine, M. J., Multi-Institutional Development and Validation of a Radiomic Model to Predict Prostate Cancer Recurrence Following Radical Prostatectomy. J Clin Med 2023, 12 (23).
31. Fortin, J. P.; Sweeney, E. M.; Muschelli, J.; Crainiceanu, C. M.; Shinohara, R. T.; Alzheimer’s Disease Neuroimaging, I., Removing inter-subject technical variability in magnetic resonance imaging studies. Neuroimage 2016, 132, 198-212.
We grouped the T staging into T4 and non-T4 categories, given that the definition of T4 has remained consistent from the 7th to the 8th edition of the AJCC cancer staging manual. Stage T4 is a critical factor in determining tumor resectability, as it typically refers to tumor involvement with the celiac trunk and/or superior mesenteric artery (SMA) exceeding 180 degrees for head/uncinate tumors or contact with the celiac trunk and aortic involvement for body/tail tumors.
| Characteristic | Value |
|---|---|
| Gender | Male: 42, Female: 29 |
| Age (years) | Median: 65 (35-81) |
MRI Acquisition
We retrospectively retrieved contrast-enhanced T1-weighted MR scans of the abdomen, which were acquired prior to the pancreas SBRT treatment for each of the 71 patients from 2006 to 2017. These scans were acquired on Philips Ingenia, Achieva, and Intera 1.5 T and 3 T MRI scanners at the University of Nebraska Medical Center. Original scans have an in-plane resolution between 0.52–1.20 mm and slice thicknesses range from 1.40–2.50 mm. Patients were intravenously injected with gadolinium-based contrast agents based on the standard protocol.
Volume of Interest Segmentation
The tumor region of all subjects was contoured by two trained medical researchers using the Varian Eclipse treatment planning system (Varian Medical Systems, Palo Alto, CA) and finalized by an attending radiation oncologist, who has more than 18 years of experience specializing in gastroenterology malignancies. Tumor volumes were delineated on the MRI with the original in-plane resolution and slice thickness. The MRI images with associated segmentations were stored and exported via DICOM format for processing and analysis.
Feature Extraction
Open-source software PyRadiomics was used to extract radiomics features from the set of MR images. The DICOM images and target delineation were converted to NRRD format using a batch process in 3D slicer software. We extracted nine hundred twenty-four (924) radiomics features from each tumor delineation. The radiomics features included first-order statistics, 3D shape-based features, Gray Level Co-occurrence Matrix (GLCM), Gray Level Run Length Matrix (GLRLM), Gray Level Size Zone Matrix (GLSZM), Neighboring Gray Tone Difference Matrix (NGTDM), and Gray Level Dependence Matrix (GLDM) from the original images, images derived from Laplacian of Gaussian (LoG) filters, and eight derived images from wavelet decompositions.
Clinical Endpoints
In this study, we chose to assess the role of radiomics features in modeling patients’ 2-year survival. We calculated the 2-year survival rate to establish a survival prediction model. The 2-year survival is determined by whether the patient is still alive at 2 years mark following the date of their diagnosis. In addition to calculating the 2-year survival rate, we also grouped the patients into alive or deceased categories at 1 year for a classification model.
Train/Test Datasets Split
As shown in Figure 1, the patients were randomly split into a training set (54 patients) and a test set (17 patients), by our in-house workflow, while ensuring the events were balanced and the binary categorical variables were stratified. We utilized the same train/test split for our clinical-only, radiomics-only, and composite models.
Uncertainty Analysis of Radiomics Features
In radiomics research, feature selection is a crucial step in the workflow due to the typically large number of available features compared to the limited number of cases in the patient cohort. Failure to perform feature selection may lead to overfitting, where the model may not generalize well to independent datasets and demonstrate accurate predictive power.
To assess the stability and reproducibility of the extracted features, we introduced two perturbations in the imaging preprocessing and the feature extraction process, specifically MRI intensity normalization and bin width for feature extraction. The goal is to ensure that extracted features are robust against the variabilities from the intensity distribution as well as feature extraction parameters and reliable such that the model can effectively adapt to new datasets.
The robustness of features with respect to these perturbations was assessed using Intraclass Correlation Coefficient (ICC), where unstable features were removed from final dataset for performing classification and predictive analysis.
Intensity Normalization
To get a consistent scheme for the comparison of MR images, the first problem to be addressed is the varying signal intensity that is received across MRI scans. Inter- and intra-scanner intensity non-uniformities across MRI scans can arise due to changes in RF frequency, coil uniformity, nonlinear fields, gradient fields, etc. Image pre-processing methods (intensity normalization among the various methods) were employed to mitigate these issues where possible.
Intensity normalization was performed using the method first introduced by Nyul et al., taking the approach of linear histogram matching in which the intensity distributions from a set of MR images can be mapped onto a “standard histogram” that acts as a map for renormalization. Figure 1 showed the MRI intensity normalization of the patient cohort.
Bin Width and Resampling
Image voxel size and extraction bin width are two important feature extraction parameters. We aimed to investigate how different bin widths and resampling techniques (with or without resampling) impact the stability of the extracted features. We chose five different gray-level discretization values for voxel intensity — 5, 10, 25, 50, and 75 — and applied them with the original resolution and a resampled resolution of 1.0 mm × 1.0 mm × 1.0 mm.
Original planar resolutions range from 0.52 mm × 0.52 mm to 1.2 mm × 1.2 mm and original slice width ranges from 1.4 mm to 2.5 mm. The combination of the bin width and resampling allowed for a total of ten different parameter sets to be explored for feature robustness. ICC > 0.75 was again the threshold for the determination of the robust features using different feature extraction parameters.
Feature Stability Evaluation
Intraclass Correlation Coefficient (ICC) is the statistical measure used to quantitatively assess the robustness of radiomics features against various perturbations. In this study, the MRI features were extracted under different perturbations to the dataset (bin width and intensity normalization) and evaluated for robustness using ICC.
Specifically, ICC (2,1) was selected to assess the single measurement absolute agreement with the 2-way random-effects model since this 2-way random-effects model is the appropriate model to generalize our reliability results, calculated as follows: ICC(2,1)=MSR−MSEMSR+(K−1)MSE+KN(MSC−MSE)\text{ICC(2,1)} = \frac{MS_R – MS_E}{MS_R + (K – 1)MS_E + \frac{K}{N}(MS_C – MS_E)}ICC(2,1)=MSR+(K−1)MSE+NK(MSC−MSE)MSR−MSE where MS is the statistical mean square for R = rows, C = columns, and E = error for the radiomics dataset.
Survival Analysis Workflow Utilizing Penalized Cox Model
We designed a survival analysis workflow that utilized a nested cross-validation approach to optimize a Cox Proportional Hazards model with elastic net regularization (penalized Cox model) for survival analysis as previously described.
Briefly, our workflow repeatedly split the data into outer training and test sets using 5-fold cross validation. Within each outer split, it performed multiple inner cross-validation repetitions, exploring various ‘l1_ratio’, ‘alpha_min_ratio’ and ‘alpha’ combinations using a grid search approach to identify the best hyperparameters. Then, the features with non-zero coefficients were ranked and stored for each inner repetition.
Subsequently, 7 best features, which were selected based on the frequency during the inner repetitions, were utilized to create a penalized cox model in the outer training set and evaluated by the outer test set. The best-performing 7-feature model was determined by its concordance index (CI) from the outer loop. Then, this best performing 7-feature model was evaluated using the independent test set (20% of the total patients) using concordance index (CI).
Three models were created by feeding clinical-only features, radiomics-only features, and a combination of both clinical and radiomics features, from the same training set (17 patients), into this workflow. The selected features were listed in Table 3.
Table 3. Feature Selected for Each Model
| Clinical Features | Radiomics Features | Composite Features |
|---|---|---|
| Chemo Drug_xeloda | wavelet-LHH_firstorder_Minimum | Resection_1 |
| Resection_1 | original_shape_Sphericity | wavelet-HHH_glrlm_LongRunEmphasis |
| N0=0, N+=1_1 | original_shape_Maximum2DDiameterRow | wavelet-LLL_firstorder_Kurtosis |
| Ethnicity_White | log-sigma-1.0-mm-3D_firstorder_Skewness | wavelet-HLL_firstorder_Mean |
| Age at Dx | wavelet-HHH_gldm_DependenceEntropy | wavelet-HHL_firstorder_Skewness |
| Rad Rx (cGy)_4000 | wavelet-LLL_firstorder_Kurtosis | Chemo Drug_xeloda |
| log-sigma-1.0-mm-3D_firstorder_Mean | Rad Rx (cGy)_3000 |
Note: N0=0, N+=1: Positive lymph node; Resection_1: Patients received resection
Classification Predictive Modeling
We trained three models utilizing the Random Forest framework, utilizing the Synthetic Minority Over-sampling Technique (SMOTE), on the same training set (54 patients) to differentiate the alive and deceased cases at 1 year.
These models utilized the same sets of clinical-only features, radiomics-only features, and a combination of both clinical and radiomics features, which were selected from the survival model. We utilized a grid-search approach to optimize the hyperparameters of the Random Forest classifier.
We utilized our in-house classification workflow to explore a parameter grid consisting of “max_depth”, “n_estimator”, “min_samples_split”, “min_samples_leaf”, “max_feature”, “bootstrap” and “criterion” with specific value ranges. We applied the Random Forest classifier with Synthetic Minority Over-Sampling Technique (SMOTE) with the best hyperparameters identified in the grid search and tested the model performance on the test dataset.
The performances of the classification models were quantified by the area under the receiver operating characteristic curve (AUC), accuracy, sensitivity, and specificity.
Results
Feature Extraction and Uncertainty Analysis
We extracted 924 radiomics features for each volume of interest on each patient from the T1-weighted MRI. Figure 2 showed the Intraclass Correlation Coefficient (ICC) of all the extracted features, grouped by their radiomics feature classes, against the variabilities in MRI signal intensity normalization. We found that 336 features (36.4%) had ICCs greater than 0.75 and were therefore considered stable features against perturbations.
| Model | Radiomics Features |
|---|---|
| Clinical-only | 239 features out of 928 had ICCs >0.6. |
| MRI Radiomics | Identified 95.2% of the radiomics features. |
Survival Analysis
As illustrated in Figure 5, the clinical radiomics model achieved a higher Concordance Index on the test set. The composite model demonstrated the best performance among the three models, suggesting that MR radiomics analysis has the potential to be integrated into the routine clinical decision-making as MR is one of the most common and non-invasive imaging modalities.
Feature Selection
The penalized Cox model differs from the traditional Cox Proportional Hazards model by incorporating L1 and/or L2 penalties, which allows it to perform feature selection and survival analysis simultaneously. This feature makes it more effective for modeling large and high-dimensional datasets.
The features of clinical-only, radiomics-only, and composite models were determined by our in-house workflow involving the use of the penalized Cox model. Figures 4, 6, and 8 showed the top selected features with their coefficients from the clinical-only, radiomics-only, and the composite models. The selected features were also summarized in Table 3.
Survival Analysis
Each 7-feature model (clinical-only, radiomics-only, and the composite) predicted a risk score for each patient, and the patients were grouped by comparing their risk scores to the mean risk score of all test patients (17 patients). Patients with scores above the mean were assigned to the high-risk group, whereas those with scores lower than the mean were assigned to the low-risk group for each model.
We then performed the log-rank test and calculated the p-value for each model. As illustrated in Figure 5, the clinical model achieved a log-rank test of 2.94 with a p-value of 0.0866. Figure 7 indicated that the radiomics model reached a log-rank test of 10.46 with a p-value of 1.22 × 10⁻³. Meanwhile, Figure 9 showed that the composite model obtained a log-rank test of 15.09 with a p-value of 1.02 × 10⁻⁴.
The three models obtained Concordance Index (CI) values of 0.615, 0.654, and 0.716 on the test dataset (17 patients).
Classification Accuracy
As shown in Figures 10A, 12A and 14A, repeated 5-fold cross-validation on the training dataset (54 patients) demonstrated that the clinical-only, radiomics-only, and composite models achieved average area under receiver operating characteristic curve (AUC) values of 0.87 (95% CI = 0.80–0.94), 0.89 (95% CI = 0.81–0.97), and 0.96 (95% CI = 0.93–0.99).
Upon evaluation with the same independent test dataset of 17 patients, each model achieved AUC values of 0.58, 0.77, and 0.79 (Figure 10B, 12B and 14B). The prediction accuracies of the three models were 0.529, 0.824, and 0.765. Figure 11 showed that after categorizing the patients into high or low risk, the clinical model achieved a sensitivity of 0.0 and a specificity of 0.69.
The MRI radiomics model demonstrated a sensitivity of 0.75 and a specificity of 0.85 (Figure 13). Meanwhile, Figure 15 illustrated that the composite model achieved a sensitivity of 0.50 and a specificity of 0.85.
Discussion
Owing to its capability of providing excellent soft tissue contrast, MRI is one of the most important imaging modalities in cancer management, especially for malignancies in the abdominal region. However, owing to its primary purpose of providing a visual representation of organs based on intrinsic differences in relaxation following a radiofrequency pulse, the intensity range of voxel values in MR images can vary substantially.
Additionally, the intensity distribution experiences significant intra- and inter-scanner variability due to differences in RF frequency, coil uniformity, nonlinear fields, and gradient fields. Radiomics features extracted from a set of MR images with significantly varied signal distributions can impair the robustness of the features and subsequent predictive modeling.
In our study, we addressed this issue by applying the Nyul intensity normalization on the contrast-enhanced T1-weighted MR images of our patient cohort. We demonstrated that only about 36.4% of the MR radiomics features are stable after the intensity was normalized across all the images.
We believe that intensity normalization should be a standard step in the MR radiomics workflow, as we observed significant variability in the intensity distribution of our MRI images, a relatively small sample size from a single institution.Our results also demonstrated that the MR radiomics features, after robustness analysis, provided at least complementary predictive power for predicting 2-year survival in pancreatic cancer patients. Radiomics-only model outperforms the clinical-only model as it achieved a better Concordance Index on the same test set. The composite model demonstrated the best performance among the three models, suggesting that MR radiomics analysis has the potential to be integrated into routine clinical decision-making as MR is one of the most common and non-invasive imaging modalities.
Our study has a few limitations. First, we have a relatively small sample size from a single institution, and our conclusion necessitates cautious interpretation and requires validation through external datasets. The discrepancy in AUC values observed between the training and test sets indicates that the sample size is small for a robust model evaluation. Second, we selected Min-Max normalization for data preprocessing to match the data range more effectively with the categorical variables and did not consider other normalization or transformation techniques. Third, we did not explore other intensity normalization methods such as least squares (LSQ) tissue mean normalization or Removal of Artificial Voxel Effect by Linear regression (RAVEL) methods. Moreover, continued assessment of our model is necessary following our proof-of-concept study. The model needs to be validated, and potentially improved, using external datasets. We also intend to carry out independent tests with newly acquired patient data.
Although our study has demonstrated that the T1-weighted MRI radiomics models can facilitate and enhance survival risk prediction for pancreatic cancer who received Stereotactic Body Radiation Therapy, future efforts are still warranted to investigate the radiomics model using other MRI modalities, such as functional MRI or those with more physiological relevance as Diffusion Weighted MRI. Furthermore, the biggest challenge in pancreatic cancer is the lack of a reliable early detection tool, as over 50% of pancreatic cancers are diagnosed at a late stage. Integrating radiomics models with imaging-based screening programs could potentially enhance early detection. More studies are needed in this area.
Conclusion
MR radiomics is promising in predicting the mortality of pancreatic cancer following SBRT and improving survival prediction capabilities. Intensity normalization is an essential preprocessing step to exclude unstable and/or redundant imaging features.
Conflict of Interest:
None.
Funding Statement:
None.
Acknowledgements:
None.
References
1. Siegel, R. L.; Miller, K. D.; Fuchs, H. E.; Jemal, A., Cancer statistics, 2022. CA Cancer J Clin 2022, 72 (1), 7-33.
2. SEER Database SEER Database: Percent of Cases & 5-Year Relative Survival by Stage at Diagnosis: Pancreatic Cancer. https://seer.cancer.gov/statfacts/html/pancreas.html.
3. Chin, V.; Nagrial, A.; Sjoquist, K.; O’Connor, C. A.; Chantrill, L.; Biankin, A. V.; Scholten, R. J.; Yip, D., Chemotherapy and radiotherapy for advanced pancreatic cancer. Cochrane Database Syst Rev 2018, 3 (3), CD011044.
4. Schizas, D.; Charalampakis, N.; Kole, C.; Economopoulou, P.; Koustas, E.; Gkotsis, E.; Ziogas, D.; Psyrri, A.; Karamouzis, M. V., Immunotherapy for pancreatic cancer: A 2020 update. Cancer Treat Rev 2020, 86, 102016.
5. Gerwing, M.; Herrmann, K.; Helfen, A.; Schliemann, C.; Berdel, W. E.; Eisenblatter, M.; Wildgruber, M., The beginning of the end for conventional RECIST – novel therapies require novel imaging approaches. Nat Rev Clin Oncol 2019.
6. Aerts, H. J.; Velazquez, E. R.; Leijenaar, R. T.; Parmar, C.; Grossmann, P.; Carvalho, S.; Cavalho, S.; Bussink, J.; Monshouwer, R.; Haibe-Kains, B.; Rietveld, D.; Hoebers, F.; Rietbergen, M. M.; Leemans, C. R.; Dekker, A.; Quackenbush, J.; Gillies, R. J.; Lambin, P., Decoding tumour phenotype by noninvasive imaging using a quantitative radiomics approach. Nat Commun 2014, 5, 4006.
7. Gillies, R. J.; Kinahan, P. E.; Hricak, H., Radiomics: Images Are More than Pictures, They Are Data. Radiology 2016, 278 (2), 563-77.
8. Lambin, P.; Leijenaar, R. T. H.; Deist, T. M.; Peerlings, J.; de Jong, E. E. C.; van Timmeren, J.; Sanduleanu, S.; Larue, R. T. H. M.; Even, A. J. G.; Jochems, A.; van Wijk, Y.; Woodruff, H.; van Soest, J.; Lustberg, T.; Roelofs, E.; van Elmpt, W.; Dekker, A.; Mottaghy, F. M.; Wildberger, J. E.; Walsh, S., Radiomics: the bridge between medical imaging and personalized medicine. Nat Rev Clin Oncol 2017, 14 (12), 749-762.
9. Parmar, C.; Grossmann, P.; Bussink, J.; Lambin, P.; Aerts, H. J., Machine Learning methods for Quantitative Radiomic Biomarkers. Sci Rep 2015, 5, 13087.
10. Sanduleanu, S.; Woodruff, H. C.; de Jong, E. E. C.; van Timmeren, J. E.; Jochems, A.; Dubois, L.; Lambin, P., Tracking tumor biology with radiomics: A systematic review utilizing a radiomics quality score. Radiother Oncol 2018, 127 (3), 349-360.
11. van Griethuysen, J. J. M.; Fedorov, A.; Parmar, C.; Hosny, A.; Aucoin, N.; Narayan, V.; Beets-Tan, R. G. H.; Fillion-Robin, J. C.; Pieper, S.; Aerts, H. J. W. L., Computational Radiomics System to Decode the Radiographic Phenotype. Cancer Res 2017, 77 (21), e104-e107.
12. Aerts, H. J., The Potential of Radiomic-Based Phenotyping in Precision Medicine: A Review. JAMA Oncol 2016, 2 (12), 1636-1642.
13. Bodalal, Z.; Trebeschi, S.; Nguyen-Kim, T. D. L.; Schats, W.; Beets-Tan, R., Radiogenomics: bridging imaging and genomics. Abdom Radiol (NY) 2019, 44 (6), 1960-1984.
14. Wu, J.; Tha, K. K.; Xing, L.; Li, R., Radiomics and radiogenomics for precision radiotherapy. J Radiat Res 2018, 59 (suppl_1), i25-i31.
15. Mazurowski, M. A., Radiogenomics: what it is and why it is important. J Am Coll Radiol 2015, 12 (8), 862-6.
16. Gevaert, O.; Mitchell, L. A.; Achrol, A. S.; Xu, J.; Echegaray, S.; Steinberg, G. K.; Cheshier, S. H.; Napel, S.; Zaharchuk, G.; Plevritis, S. K., Glioblastoma Multiforme: Exploratory Radiogenomic Analysis by Using Quantitative Image Features. Radiology 2015, 276 (1), 313.
17. Karlo, C. A.; Di Paolo, P. L.; Chaim, J.; Hakimi, A. A.; Ostrovnaya, I.; Russo, P.; Hricak, H.; Motzer, R.; Hsieh, J. J.; Akin, O., Radiogenomics of clear cell renal cell carcinoma: associations between CT imaging features and mutations. Radiology 2014, 270 (2), 464-71.
18. Abazeed, M. E.; Adams, D. J.; Hurov, K. E.; Tamayo, P.; Creighton, C. J.; Sonkin, D.; Giacomelli, A. O.; Du, C.; Fries, D. F.; Wong, K. K.; Mesirov, J. P.; Loeffler, J. S.; Schreiber, S. L.; Hammerman, P. S.; Meyerson, M., Integrative radiogenomic profiling of squamous cell lung cancer. Cancer Res 2013, 73 (20), 6289-98.
19. PyRadiomics Documentation. https://pyradiomics.readthedocs.io/en/latest/.
20. Pieper, S.; Lorensen, B.; Schroeder, W.; Kikinis, R. In The NA-MIC Kit: ITK, VTK, pipelines, grids and 3D slicer as an open platform for the medical image computing community, 3rd IEEE International Symposium on Biomedical Imaging: Nano to Macro, 2006., 6-9 April 2006; 2006; pp 698-701.
21. Wang, S.; Belemlilga, D.; Lei, Y.; Ganti, A. K. P.; Lin, C.; Asif, S.; Marasco, J. T.; Oh, K.; Zhou, S., Enhancing Survival Outcome Predictions in Metastatic Non-Small Cell Lung Cancer Through PET Radiomics Analysis. Cancers 2024, 16 (22), 3731.
22. Park, J. E.; Park, S. Y.; Kim, H. J.; Kim, H. S., Reproducibility and Generalizability in Radiomics Modeling: Possible Strategies in Radiologic and Statistical Perspectives. Korean J Radiol 2019, 20 (7), 1124-1137.
23. Koo, T. K.; Li, M. Y., A Guideline of Selecting and Reporting Intraclass Correlation Coefficients for Reliability Research. J Chiropr Med 2016, 15 (2), 155-63.
24. Moradmand, H.; Aghamiri, S. M. R.; Ghaderi, R., Impact of image preprocessing methods on reproducibility of radiomic features in multimodal magnetic resonance imaging in glioblastoma. J Appl Clin Med Phys 2020, 21 (1), 179-190.
25. Nyul, L. G.; Udupa, J. K.; Zhang, X., New variants of a method of MRI scale standardization. IEEE Trans Med Imaging 2000, 19 (2), 143-50.
26. Benchoufi, M.; Matzner-Lober, E.; Molinari, N.; Jannot, A. S.; Soyer, P., Interobserver agreement issues in radiology. Diagn Interv Imaging 2020, 101 (10), 639-641.
27. Polsterl, S., scikit-survival: A Library for Time-to-Event Analysis Built on Top of scikit-learn. Journal of Machine Learning Research 2020, 21 (212), 1-6 %M.
28. Chawla, N. V.; Bowyer, K. W.; Hall, L. O.; Kegelmeyer, W. P., SMOTE: synthetic minority over-sampling technique. Journal of artificial intelligence research 2002, 16, 321–357.
29. Wang, S.; Lin, C.; Kolomaya, A.; Ostdiek-Wille, G. P.; Wong, J.; Cheng, X.; Lei, Y.; Liu, C., Compute Tomography Radiomics Analysis on Whole Pancreas Between Healthy Individual and Pancreatic Ductal Adenocarcinoma Patients: Uncertainty Analysis and Predictive Modeling. Technology in Cancer Research & Treatment 2022, 21, 15330338221126869.
30. Huynh, L. M.; Bonebrake, B.; Tran, J.; Marasco, J. T.; Ahlering, T. E.; Wang, S.; Baine, M. J., Multi-Institutional Development and Validation of a Radiomic Model to Predict Prostate Cancer Recurrence Following Radical Prostatectomy. J Clin Med 2023, 12 (23).
31. Fortin, J. P.; Sweeney, E. M.; Muschelli, J.; Crainiceanu, C. M.; Shinohara, R. T.; Alzheimer’s Disease Neuroimaging, I., Removing inter-subject technical variability in magnetic resonance imaging studies. Neuroimage 2016, 132, 198-212.