

Socio-Economic Deprivation’s Impact on Obesity and Diabetes
The role of socio-economic deprivation in developing of Obesity and Diabetes type 2 among population aged 16 and over in England and Sweden, 2021-2024
Anzhelika Magomedova¹
- University of Essex, Wivenhoe Park, Colchester CO4 3SQ
OPEN ACCESS
PUBLISHED: 31 August 2025
CITATION: Magomedova, A., 2025. The role of socio-economic deprivation in developing of Obesity and Diabetes type 2 among population aged 16 and over in England and Sweden, 2021–2024. Medical Research Archives, [online] 13(8).
https://doi.org/10.18103/mra.v13i8.6834
COPYRIGHT: © 2025 European Society of Medicine. This is an open-access article distributed under the terms of the Creative Commons Attribution License, which permits unrestricted use, distribution, and reproduction in any medium, provided the original author and source are credited.
DOI https://doi.org/10.18103/mra.v13i8.6834
ISSN 2375-1924
Abstract
Background: Diabetes type 2 is the fastest growing non-communicable endocrine disease affecting over 830 million people globally. Diabetes complications include cardiovascular and renal disorders, loss of vision and foot amputations. Obesity is a complex chronic disease defined by excessive fat deposits which negatively impact health and the main risk factor of diabetes type 2. Similarly to diabetes type 2, prevalence of obesity shows a negative increasing trend. Obesity in adults has doubled since 1990, and fourfold in children and adolescents. According to several research studies, both obesity and diabetes type 2 have the same social determinants as social and socio-economic deprivation, isolation, low level of education and unhealthy eating habits. Aim: The aim of this research is to examine the role of socio-economic deprivation in an increasing trend and prevalence of obesity and diabetes type 2 among people aged 16+ in England and Sweden, based on the routine epidemiological data for 2021-2024 years. Methods: A statistical analysis is based on 61 England counties & unitary authorities, of these 16 counties relate to the most and second most deprived areas of England, and 15 to the least and second least ones. By simple random sampling technique 31 counties & unitary authorities were randomly picked for the analysis. Pearson’s product-moment correlation coefficient and multiple regression analyses were used to investigate possible associations, their strength and direction between the prevalence of diabetes, socio-economic deprivation, obesity and daily fruit and vegetables consumption. Data on four health indicators were retrieved from the England’s electronic database – Public Health Profiles. For Sweden, seven health indicators reflecting the prevalence of diabetes, obesity, economic standard and level of daily fruit, berries and vegetables intake, according to socio-economic area type and income quantile were extracted from the Swedish Public Health Database. A comparative analysis and visual presentation of results were implemented for Sweden. Findings: For both countries, positive associations were revealed between socio-economic deprivation, prevalence of obesity and diabetes type 2. In addition to this, the overall low consumption of fruit and vegetables was detected in low-income areas, with socio-economic challenges. This research showed that the prevalence of obesity and diabetes type 2 is increasing, and conversely, daily fruit and vegetables consumption is decreasing with the increase in deprivation level of area. The results of the statistical analysis for England showed high statistical significance and a strong level of associations revealed. Conclusion: In conclusion, the analysis of the routine epidemiological data for 2021-2024 years in England and Sweden showed that socio-economic deprivation is associated with higher prevalence of diabetes type 2 and obesity among people aged 16+ in both countries. Increase in a deprivation level has linear relationships with the prevalence of obesity and diabetes type 2. Additionally, areas with higher deprivation status, prevalence of obesity and diabetes type 2 demonstrate lower daily consumption of fruits and vegetables compared to areas with good socio-economic conditions. Overall, socio-economic deprivation plays a significant role in increasing trends for both obesity and diabetes type 2.
Funding: No funding was provided for this article, and the author has nothing to declare.
Keywords
Diabetes mellitus, Obesity, Deprivation, Healthy Diet, Global Health.
Introduction
Diabetes mellitus is one of the common endocrine diseases characterized by metabolic disturbance and hyperglycemia. The disease affects almost all age groups with the type 2 accounting for most cases (around 95%). In the past three decades the incidence of diabetes has grown dramatically worldwide from 200 million in 1990 to 830 million in 2022. Diabetes type 2 demonstrates a stable increasing trend in countries of all income levels. Inadequately controlled diabetes with persistent hyperglycemia causes chronic inflammation and impairments in microcirculatory vascular system which in its turn leads to multiple health issues like blindness, kidney failure, heart attacks and lower limb amputation. The treatment of diabetes imposes an extensive financial burden on health systems, leading to disability and premature mortality. In 2021, diabetes and diabetes renal complication caused over 2 million deaths, additionally, around 11% of cardiovascular deaths were caused by persistent hyperglycemia.
Formerly, the onset of diabetes type 2 was usually detected only in adults. However, the latest observations revealed that diabetes type 2 is increasingly frequently occurring in children. The same tendency can be observed in obesity among children, in 2024, 35 million children under the age of 5 were overweight.
Regarding obesity, the recent data published by the World Health Organization (WHO) showed that, in 2022, 2.5 billion adults in the world were overweight and 890 million of these were living with obesity. The economic impact of overweight and obesity (OAO) in 2019, is estimated at 2.19% of global gross domestic product (GDP) and is projected to increase if current trends continue to 3.29% of GDP globally by 2060.
The role of deprivation as one of the most essential determinants of obesity and diabetes type 2 cannot be overlooked, as it is usually associated with an unhealthy diet, social isolation, lower level of education and poor access to medical care and treatment. According to several research studies, the population living in areas with low socio-economic status faces a higher risk of developing diabetes and diabetes complications than those of higher socioeconomic groups. Low socio-economic status is associated with a lack of access to prevention and care, poor diet and metabolic control. Marginalized groups face structural barriers like poverty, education and housing, which pose difficulties in accessing healthy food. The differences in socio-economic status led to health inequalities between higher and lower income population groups.
The studies from UK, France, Spain, Italy, US and Australia demonstrated the similar inferences- deprived regions reflected higher incidence and complications of diabetes type 2 and obesity.
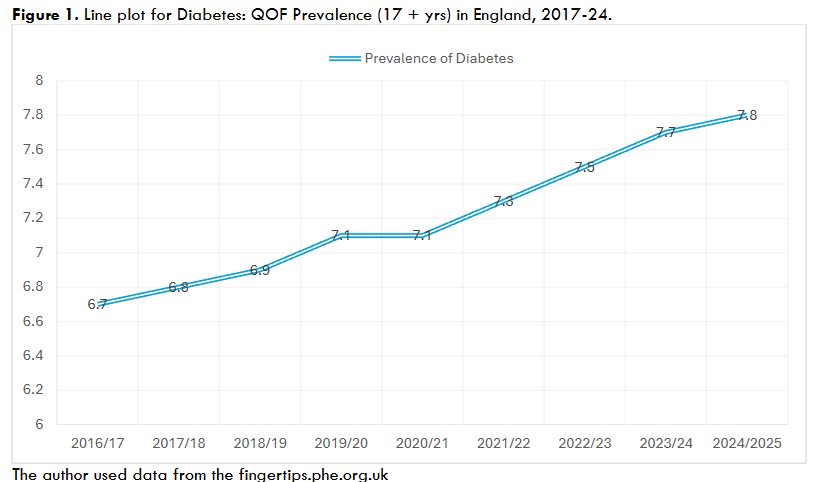
In the UK, there are currently 4.4 million people living with Type 2 diabetes, with more than 13.6 million people estimated at increased risk of diabetes type 2 and other serious health conditions. This number is projected to increase to 4.9 million to 2050. Health expenditures on the treatment of diabetes complications constitute at least $10 billion annually on the National Health Service. It was estimated that there was a total of 3.6 million people aged 16 and over in England with diabetes type 2, in 2021. The West Midlands region had the highest estimated prevalence (8.6%) and the South East region the lowest (7.0%). The prevalence of diabetes has increased from 6.7% in 2017 to 7.8% in 2025.
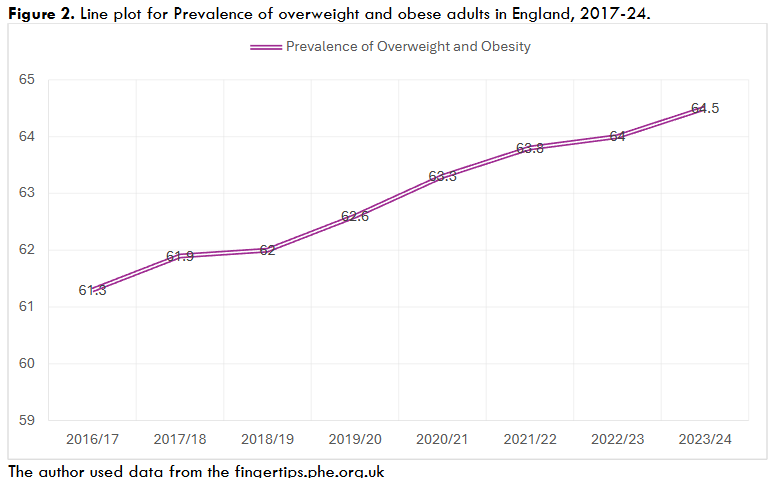
A similar pattern is detected in the percentage of overweight and obese adults in England. The number of overweight and obese people increased from 61.3% in 2017 to 64.5% in 2024.
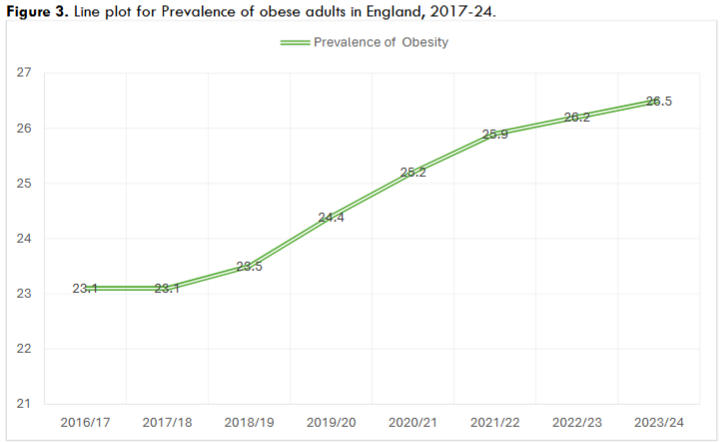
The negative increasing trend was also observed in adults having obesity, with the numbers changing from 23.1% in 2017 to 26.5% in 2024.
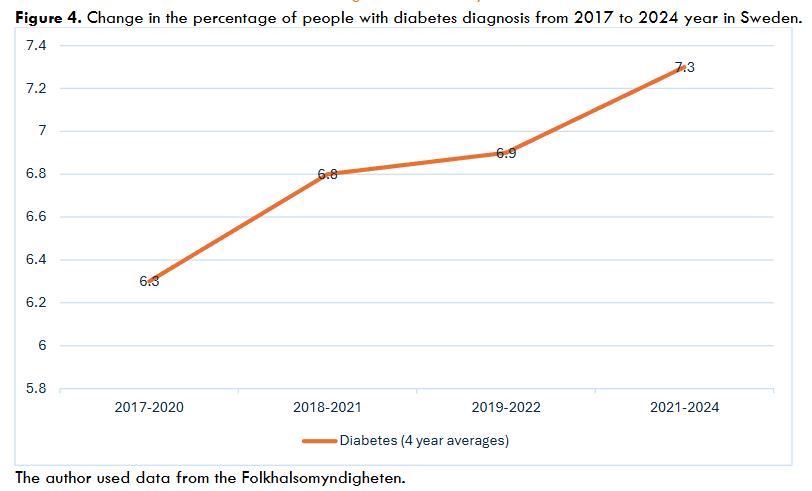
Concerning Sweden, about 566.6 thousand of residents had diagnosis of diabetes in 2024, the future projection is that this number will increase to 663.5 thousand in 2050. Although Sweden has a lower prevalence of diabetes as compared to other European countries, a similar increasing trend for the prevalence of diabetes can be observed in Sweden: the number of people suffering from diabetes has grown from 6.3% in 2017 to 7.3% in 2024.
The existed research on the topic includes the study of Grundmann et al, (2014), based on the analysis of a large survey conducted in 2006 in Germany at a municipal level. The survey sample involved 39908 adults aged 20 or older assessed by income, educational level and overall socio-economic status. 4700 municipalities were assigned to a deprivation quantile. The results of the study revealed a positive association of area deprivation with diabetes type 2 and obesity. The odds ratios for municipalities located in the most deprived quantile were significantly increased for T2D (OR 1.35; 95% CI 1.12–1.64) as well as for obesity (OR 1.14; 95% CI 1.02–1.26). These associations were similar for both women and men.
Another research investigation on the associations of Diabetes type 2 and obesity with deprivation in South Korea was performed by Choi, et al, (2020). The cohort study examined the effect of socioeconomic deprivation on the outcomes of diabetes complications in patients with diabetes type 2. 7510 patients newly diagnosed with diabetes type 2, aged 40 and above were included. Study participants were classified according to the regional socio-economic deprivation index into five deprivation quantiles. The aim of the study was to examine inequalities in hospital admissions and mortality due to diabetes complications. The results showed that participants with higher socio-economic deprivation had higher hazard ratios (HR) for hospitalisation and mortality for diabetes complications. The percentages of participants in the least deprived quantile to the most deprived one were 25.4%, 28.8%, 32.4%, 34.6% and 37.6% for hospitalization due to diabetes complications and 1.3%, 2.1%, 2.5%, 2.9%, 3.6% for deaths from diabetes complications. Participants with higher socio-economic deprivation had a higher HR for hospitalization and mortality from all-cause and diabetes complications.
Concerning the British regional research, the study of Au-Yeung et al, (2024) investigated the association of socio-economic deprivation and ethnicity on the risk of diabetes in Birmingham. Data was collected from 108514 National Service Health Checks conducted in Birmingham from 2018 to 2023 years. The number of events avoidable and the prevalence odds ratios of determinants were estimated. The research finding of the statistical analysis revealed that 64% of diabetes and 44% of pre-diabetes cases could be attributed to socio-economic deprivation. Additionally, the Swedish research on socio-economic inequalities revealed that 17.2% of the diabetes burden in men and 20.1% of the burden in women were attributed to lower educational levels in Sweden.
These studies contribute largely to understanding the wider determinants of health outcomes and inequalities including diabetes. However, the existed research did not provide data on the influence of daily vegetable and fruit consumption on the prevalence of diabetes type 2 as well as the data for wider regional levels like counties and unitary authorities of England and Sweden. The aim of this research is to examine the role of socio-economic deprivation in an increasing trend and prevalence of diabetes type 2 and obesity among people aged 16+ in England and Sweden based on the routine epidemiological data for 2021-2024 years.
Methodology
This research follows a case study design. Data collection was conducted using electronic databases of England and Sweden featuring results from National Public Health Surveys, local governments and communities’ profiles, National Health Service (NHS) and data from local general practice registers.
For England, secondary routine numerical data collected annually and reported in public health profiles was analyzed using descriptive statistics and quantitative analysis. The following indicators were chosen for the analysis: the Index of Multiple Deprivation Score (IMD), (2019/23), Percentage of adults meeting the “5-a-day” fruit and vegetable consumption recommendations, Diabetes: QOF Prevalence (17+Yrs) and Obesity prevalence in adults, (using adjusted self-reported height and weight (18+). All three health indicators reflect combined data for 4-year period (2021-2024). The data for the deprivation level indicator was partly added and renewed in April 2023.
| Valid number | Mean | Minimum | Maximum | Std Deviation | |
|---|---|---|---|---|---|
| Obesity prevalence in adults | 31 | 27.45484 | 15.50000 | 36.80000 | 5.96047 |
| IMD 2019 | 31 | 23.62258 | 8.40000 | 40.60000 | 11.51144 |
| Diabetes QOF Prevalence | 31 | 7.66129 | 2.70000 | 10.50000 | 1.78450 |
| 5-a-day fruit and vegetables consumption | 31 | 29.77097 | 19.10000 | 42.40000 | 7.03644 |
Simple random sampling (every other) was used for the analysis; the two most deprived and two least deprived deciles each including 15-16 counties & unitary authorities (UA) of England (based on deprivation deciles defined in 2019/23 years) were chosen for the analysis. The sampling is based on the availability of data and the division of local authorities.
| Health Indicator | Definition | Data Source |
|---|---|---|
| Diabetes: QOF Prevalence (17+Yrs) (2021/22/23/24) | Represents the percentage of patients aged 17 or over with Diabetes mellitus recorded on practice disease register. | National Health Service (NHS) Routine primary care data National clinical audit data |
| The Index of Multiple Deprivation Score (2019/23) | The English Indices of Deprivation use 37 separate indicators, organised across seven distinct domains of deprivation which can be combined, using appropriate weights, to calculate the Index of Multiple Deprivation (IMD) | Department of Communities and Local Government |
| Percentage of adults meeting the “5-a-day” fruit and vegetable consumption recommendations (2021/23/24) | The indicator includes the percentage of respondents aged 16 and over who reported they had eaten 5 or more portions of fruit and vegetables on the previous day. | Local authority estimates from Sport England’s Active Lives Adult Survey data. |
| Obesity prevalence in adults, (using adjusted self-reported height and weight (18+) (2021/22/23/24) | The indicator represents percentages of adults aged 18 and over classified as obese (BMI greater than or equal to 30kg/m2). | Local authority estimates from Sport England’s Active Lives Adult Survey data and Health Survey data. |
The author used data from electronic database fingertips.phe.org.uk. The Pearson product-moment correlation coefficient (PPMCC) was implemented to examine the existence and strength of possible linear relationships between deprivation level, daily consumption of vegetable and fruit, prevalence and distribution of diabetes type 2 and its most common determinant – obesity. The positive correlations were established as a significant one at the p-value equal or lower than 0.05. Additionally, the Fisher’s Z analysis was applied to test the significance and strength of relationships between two variables for the purpose of triangulation of results. The test of Kolmogorov-Smirnoff was applied to analyze normality of data distribution. The analysis was implemented using STATISTICA 10 software.
Regarding Sweden, a statistical analysis was not performed due to lack of randomization possibility and sufficient data to perform analysis with the results of high validity and reliability. Instead, the comparative analysis of values and visual presentation of the retrieved data was carried out. The data was retrieved from the national electronic database with public health profiles from national, regional and municipal levels featuring routine secondary data derived from 21 counties of Sweden.
| Health Indicator | Definition | Data Source |
|---|---|---|
| Fruit and vegetable intake by gender, region and year (vegetables and root vegetables/ fruit and berries at least 2 times a day (4-year averages) 2021-2024. | The indicators defined the frequency of fruit and vegetable consumption by the survey respondents. | The report is based on the National Public Health Survey which represents a sample survey among the population aged 16 and older. |
| Diabetes by sex, region and year (4-year averages). | The indicator demonstrates the percentage of the survey respondents who answered positively to the question- “Do you have diabetes? | The data was retrieved from the National Public Health Survey. The sample survey includes the population aged 16-84 years. |
| Economic Standard by gender, region and year. 2021-2023. | Economic Standard is defined as a household disposable income, after taxes and other expenses have been deducted. It is measured in thousands of kronor per consumption unit. | National Public Health Survey The sample survey includes the population aged 16-84 years. |
| Vegetable and root vegetable intake by household income and year among adult 16+ population (3-year average 2021,2022,2024) | The indicator reflects the percentage of people who consume vegetables and root vegetables at least 2 times in five different income quantiles. The division of quantiles depends on the household disposable income per consumption unit. | National Public Health Survey The sample survey includes the population aged 16-84 years. |
| Vegetable and root vegetable intake by socioeconomic area type, gender and year among adult 16+ population (2022,2024) | The indicator defines the percentage of people who consume vegetables and root vegetables at least 2 times a day in five different socio-economic area types. | The report is based on data from the National Public Health Survey among the population aged 16-84 years. |
| Overweight and obesity by socio-economic area type, sex and year. 2022,2024. | The indicator represents the percentage of overweight and obese people aged 16-84 year, based on the results of the survey with self-reported weight and height. | The data was obtained from the National Public Health Survey, conducted among population aged 16-84 years. |
| Overweight and obesity by BMI, disposable income, gender and year among adult 16+ population. | Disposable income refers to the sum of all income and transfers (e.g. child and housing allowances and subsistence allowances), minus final tax. It is divided by the consumption weight that applies to the household. | The report is based on the Living Conditions Survey conducted annually. It is a sample survey among the registered population aged 16 years and older. |
The author used data from electronic database Folkhalsomyndigheten.
The Kolmogorov-Smirnoff’s test confirmed that data for all health indicators included in the statistical analysis followed a normal distribution pattern (p > 0.05). With regards to England, the Pearson product-moment correlation coefficient (PPMCC) analysis based on 31 cases for 2021-2024 revealed strong statistically significant correlations between all four predefined variables.
| Deprivation decile | County & UA | Diabetes: QOF Prevalence 17+ yrs 2021/22/23/24 combined data | Obesity prevalence in adults, (using adjusted self-reported height and weight (18+) (2021/22/23/24 combined data) | Percentage of adults meeting the “5-a-day” fruit and vegetable Consumption recommendations (2021/23/24 combined data) | IMD, 2019/2023 |
|---|---|---|---|---|---|
| Most Deprived | Birmingham | 9.4 | 29.3 | 23.3 | 38.1 |
| Most Deprived | Blackburn with Darwen | 7.0 | 27.6 | 21.1 | 34.2 |
| Most Deprived | Salford | 6.6 | 23.5 | 27.6 | 40.0 |
| Most Deprived | Knowsley | ||||
| Second most deprived | Manchester | 6.6 | 23.5 | 27.6 | 40.0 |
| Second most deprived | Nottingham | 10.5 | 31.9 | 21.5 | 34.9 |
| Second most deprived | Sandwell | 10.4 | 36.2 | 21.3 | 31.6 |
| Second most deprived | Tameside | 9.3 | 31.1 | 27.7 | 32.1 |
| Second most deprived | Wolverhampton | 9.3 | 31.1 | 27.7 | 32.1 |
| Second most deprived | Redcar and Cleveland | 8.7 | 34.9 | 28.1 | 29.9 |
| Second most deprived | Barnsley | 8.5 | 31.8 | 26.8 | 31.3 |
| Second most deprived | Doncaster | 8.5 | 31.8 | 26.8 | 31.3 |
| Second most deprived | North East Lincolnshire | 8.5 | 31.8 | 26.8 | 31.3 |
| Second most deprived | South Tyneside | 8.8 | 32.8 | 23.2 | 30.6 |
| Second most deprived | Sunderland | 8.8 | 32.8 | 23.2 | 30.6 |
| Second most deprived | Bolton | 10.3 | 26.6 | 21.5 | 30.9 |
| Second most deprived | Leicester | 10.3 | 26.6 | 21.5 | 30.9 |
| Second most deprived | St. Helens | 6.0 | 22.9 | 31.6 | 32.5 |
| Second most deprived | Hackney | 6.0 | 22.9 | 31.6 | 32.5 |
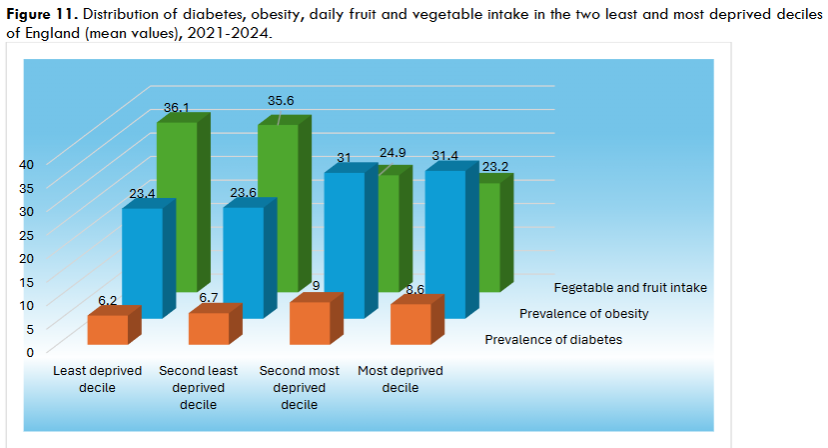
Table 4 demonstrates values for prevalence of obesity, diabetes, fruit and vegetable intake, according to the deprivation index of the area in the two most deprived deciles of England, 2021-2024.
| Deprivation decile | County & UA | Diabetes: QOF Prevalence 17+ yrs 2021/22/23/24 combined data | Obesity prevalence in adults, (using adjusted self-reported height and weight (18+) (2021/22/23/24 combined data) | Percentage of adults meeting the “5-a-day” fruit and vegetable Consumption recommendations (2021/23/24 combined data) | IMD, 2019/2023 |
|---|---|---|---|---|---|
| Second least deprived | Bromley | 7.8 | 27.3 | 32.1 | 12.3 |
| Second least deprived | Leicestershire | 7.6 | 27.0 | 41.4 | 13.4 |
| Second least deprived | Sutton | 6.4 | 24.3 | 34.0 | 13.9 |
| Second least deprived | Cambridgeshire | 6.4 | 24.3 | 34.0 | 13.9 |
| Second least deprived | Cheshire East | 7.6 | 27.0 | 41.4 | 13.4 |
| Second least deprived | Harrow | 6.8 | 19.6 | 35.6 | 14.6 |
| Second least deprived | Merton | 6.8 | 19.6 | 35.6 | 14.6 |
| Second least deprived | Hampshire | 7.6 | 24.9 | 38.7 | 14.9 |
| Second least deprived | Gloucestershire | 7.6 | 24.9 | 38.7 | 14.9 |
Table 5 provides data for the four health and socio-economic level indicators in the two least deprived deciles of England, 2021-2024.
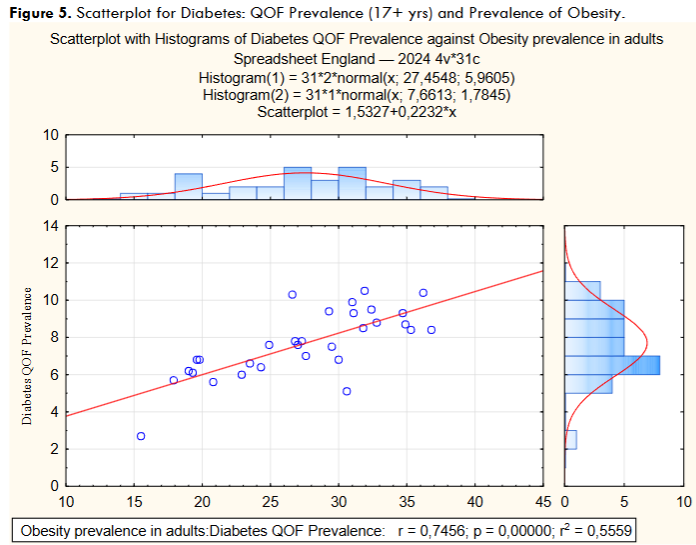
The results of the statistical analysis showed strong linear positive relations between the following health indicators:
- Diabetes: QOF Prevalence (17+ yrs) and Obesity prevalence in adults, (using adjusted self-reported height and weight (18+) (r = 0.7), Fisher’s Z- 0.963.
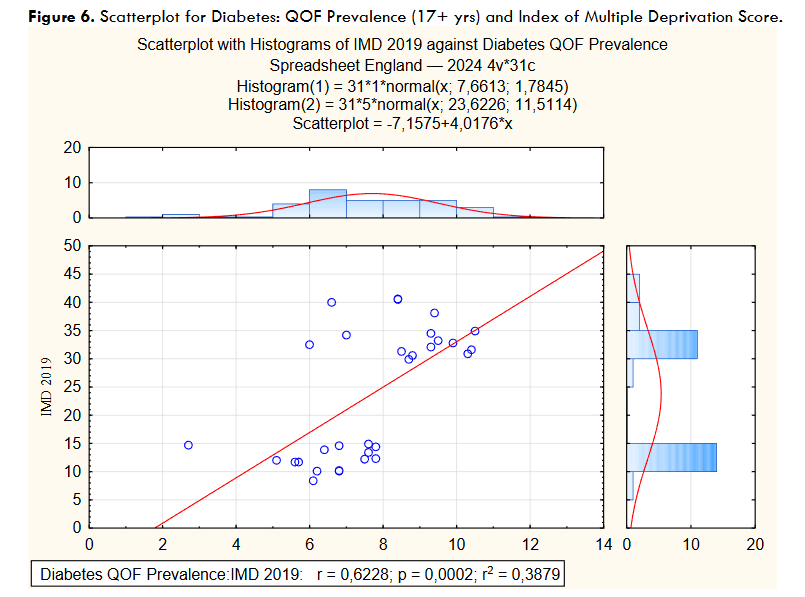
- Diabetes: QOF prevalence (17+ yrs) and Index of Multiple Deprivation score, (2019/23) (r =0.6), p= 0.0002. Fisher’s Z- 0.729.
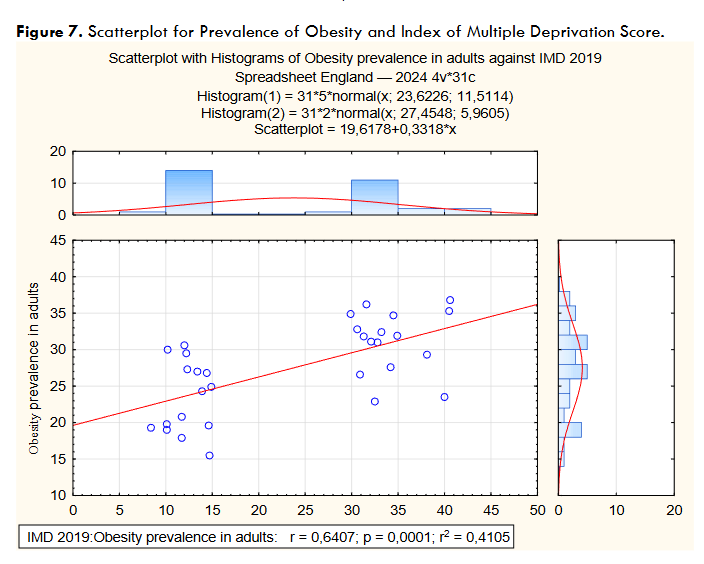
- Obesity prevalence in adults (using adjusted self-reported height and weight (18+) and the Index of Multiple Deprivation Score (2019/23). The correlation revealed is strong, with r = 0.6, Fisher’s Z- 0.759.
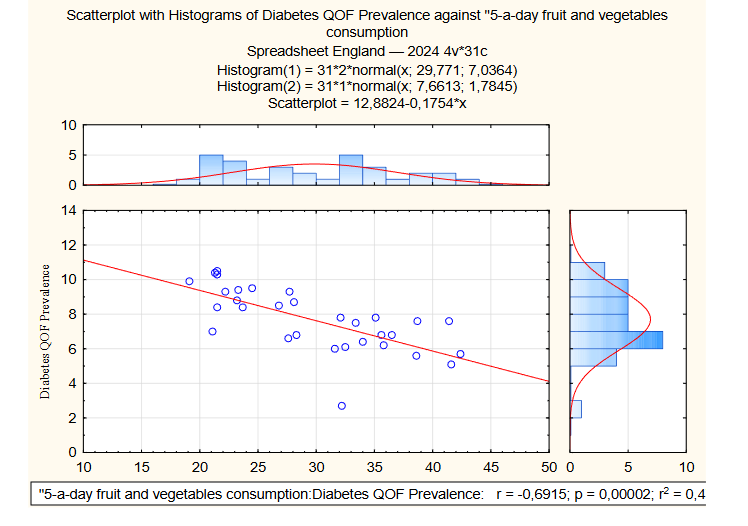
- Diabetes: QOF Prevalence (17+ yrs) and Percentage of adults meeting the “5-a-day” fruit and vegetable consumption recommendations (r = 0.7) Fisher’s Z- 0.851, p= 0.00002.
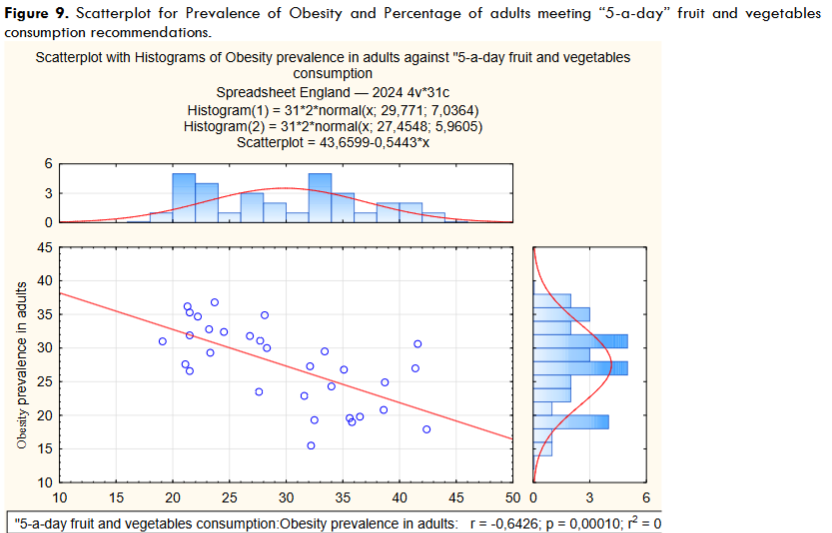
- Obesity prevalence in adults (using adjusted self-reported height and weight (18+) and Percentage of adults meeting the “5-a-day” fruit and vegetable consumption recommendations (r = -0.6), Fisher’s Z – 0.851, p= 0.00010.
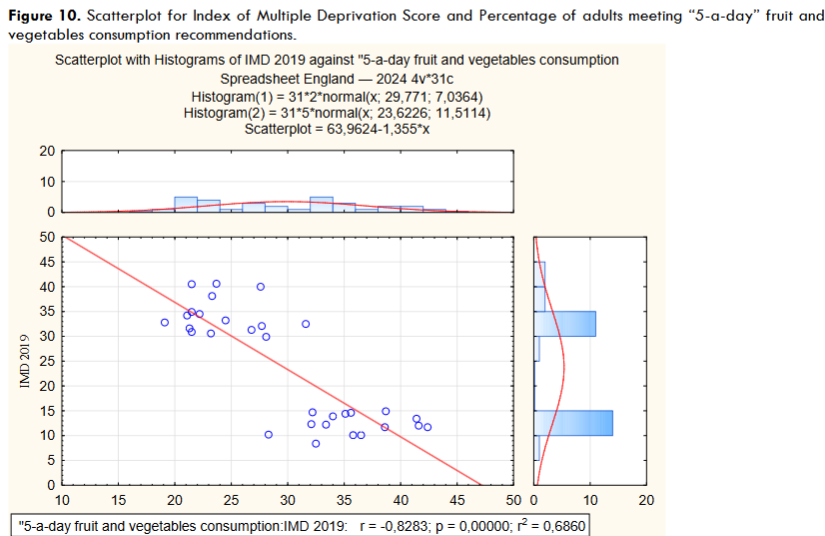
- Index of Multiple Deprivation Score (2019/23) and Percentage of adults meeting the “5-a-day” fruit and vegetable consumption recommendations (r = -0.8) Fisher’s Z- 1.182, p= 0.00000.
Overall, all four predefined health indicators showed strong positive and negative interrelations, clearly indicating that obesity and diabetes type 2 are more prevalent in counties & UA with higher deprivation scores and lower daily consumption of fruit and vegetables.
| Variable | Pearson’s R | P-value | Fisher’s Z |
|---|---|---|---|
| Diabetes QOF Prevalence / Obesity prevalence in adults | 0.746 | 0.00000 | 0.963 |
| Diabetes QOF Prevalence / IMD | 0.623 | 0.0002 | 0.729 |
| Obesity prevalence in adults/ IMD | 0.641 | 0.0001 | 0.759 |
| Obesity prevalence in adults/ Percentage of adults meeting “5-a-day” fruit and vegetable consumption recommendations | -0.643 | 0.00010 | 0.762 |
| Percentage of adults meeting “5-a-day” fruit and vegetable consumption recommendations/ IMD | -0.828 | 0.00000 | 1.182 |
| Diabetes QOF Prevalence / Percentage of adults meeting “5-a-day” fruit and vegetable consumption recommendations | -0.692 | 0.00002 | 0.851 |
The multiple regression analysis showed similar research findings: strong positive relationships were detected between health indicators featuring diabetes, obesity and deprivation level with the coefficient b* ranging from 0.623 to 0.746. Strong negative relationships were observed between diabetes, obesity, deprivation and fruit and vegetable consumption indicators – coefficient b* reached -0.830 between daily fruit and vegetable consumption indicator and deprivation; -0.690 and -0.640 between diabetes, obesity and daily fruit and vegetable intake indicators.
| Variable | b* | P-value | R |
|---|---|---|---|
| Diabetes QOF Prevalence / Obesity prevalence in adults | 0.746 | 0.000097 | 0.745 |
| Diabetes QOF Prevalence / IMD | 0.623 | 0.000183 | 0.623 |
| Obesity prevalence in adults/ IMD | 0.641 | 0.000103 | 0.641 |
| Diabetes QOF Prevalence / “5-a-day” fruit and vegetable consumption | -0.690 | 0.000001 | 0.691 |
| “5-a-day” fruit and vegetable consumption/ IMD | -0.830 | 0.000016 | 0.828 |
| Obesity prevalence in adults/ “5-a-day” fruit and vegetable consumption | -0.640 | 0.000097 | 0.643 |
The unequal distribution of diabetes and obesity, with higher prevalence in the most and second most deprived deciles of England, is observed in a graphic presentation of health indicators.
With regards to Sweden, the comparative analysis of data for seven health indicators showed similar results, indicating an overall increasing trend, from 2021 to 2024, in a percentage of overweight, obese adults and those having diabetes type 2, with higher numbers registered and residing in more deprived socio-economic areas and income quantiles. The numbers are increasing with the increase in a deprivation level.
| County | 2017-2020 | 2018-2021 | 2019-2022 | 2021-2024 |
|---|---|---|---|---|
| Stockholm | 5.4 | 5.4 | 5.5 | 6.1 |
| Uppsala | 5.7 | 6.6 | 7.0 | 7.6 |
| Södermanland | 6.4 | 6.8 | 7.5 | 9.5 |
| Östergötland | 5.5 | 5.7 | 6.5 | 7.9 |
| Jönköping | 5.5 | 6.4 | 6.9 | 7.3 |
| Kronoberg | 6.7 | 6.2 | 5.2 | 4.5 |
| Kalmar | 7.2 | 7.3 | 8.5 | 7.9 |
| Gotland | 7.1 | 8.2 | ||
| Blekinge | 7.2 | 6.8 | 6.4 | 6.5 |
| Skåne | 7.2 | 6.9 | 6.8 | 6.8 |
| Halland | 5.4 | 5.4 | 4.4 | 4.9 |
| Vastra Götaland | 5.8 | 5.9 | 6.0 | 6.7 |
| Varmland | 7.4 | 7.1 | 7.2 | 8.9 |
| Örebro | 7.0 | 6.9 | 7.5 | 7.5 |
| Vastmanland | 8.5 | 8.2 | 8.1 | 7.7 |
| Dalarna | 7.5 | 7.7 | 7.9 | 7.9 |
| Gavleborg | 7.8 | 8.6 | 8.7 | 6.5 |
| Vasternorrland | 7.3 | 7.6 | 7.5 | 6.9 |
| Jamtland | 6.7 | 6.8 | 7.3 | 11.2 |
| Vasterbotten | 5.7 | 5.4 | 5.3 | 6.2 |
| Norrbotten | 6.6 | 6.8 | 6.9 | 6.8 |
Table 8 displays the increase in the percentage of people having diagnosis of diabetes from 2017 to 2024 in 14 counties of Sweden.
Table 9 shows the economic standard of 21 different counties of Sweden; the decrease in the level of disposable income can be observed across all counties including higher and lower income areas from 2021 to 2023.
| County | 2021 | 2022 | 2023 |
|---|---|---|---|
| Stockholm | 382.5 | 370.3 | 366.1 |
| Uppsala | 342.7 | 331.0 | 326.0 |
| Södermanland | 319.1 | 308.6 | 303.7 |
| Östergötland | 326.9 | 315.9 | 311.3 |
| Jönköping | 327.5 | 315.9 | 310.6 |
| Kronoberg | 322.8 | 311.3 | 307.8 |
| Kalmar | 314.2 | 303.8 | 298.9 |
| Gotland | 313.1 | 303.8 | 297.9 |
| Blekinge | 316.1 | 306.1 | 304.9 |
| Skåne | 330.2 | 319.9 | 315.5 |
| Halland | 348.3 | 337.4 | 333.8 |
| Vastra Götaland | 340.5 | 330.1 | 325.5 |
| Varmland | 317.5 | 308.7 | 304.8 |
| Örebro | 317.7 | 307.0 | 302.3 |
| Vastmanland | 326.9 | 315.7 | 310.1 |
| Dalarna | 315.5 | 305.0 | 301.8 |
| Gavleborg | 313.6 | 302.4 | 295.5 |
| Vasternorrland | 319.5 | 308.2 | 301.2 |
| Jamtland | 315.0 | 304.9 | 298.1 |
| Vasterbotten | 324.4 | 314.4 | 309.4 |
| Norrbotten | 330.4 | 312.3 | 314.9 |
Table 9 shows the economic standard of 21 different counties of Sweden; the decrease in the level of disposable income can be observed across all counties including higher and lower income areas from 2021 to 2023.
Table 10 presents the values for prevalence of overweight and obesity, according to the type of socio-economic area. The number of overweight and obese people are considerably higher, almost twice for obesity BMI 30.0 or higher and 1.4 times for overweight and obesity in areas with socio-economic challenges as compared to areas with good socio-economic conditions.
| Major Socio-economic challenges | Socio-economic challenges | Socio-economically mixed areas | Good socio-economic conditions. | Very good socio-economic conditions. | |
|---|---|---|---|---|---|
| 2022 | 61.9 | 55.7 | 56.3 | 49.2 | 42.6 |
| 2024 | 61.9 | 59.3 | 57.7 | 51.7 | 45.0 |
Table 10 presents the values for prevalence of overweight and obesity, according to the type of socio-economic area. The number of overweight and obese people are considerably higher, almost twice for obesity BMI 30.0 or higher and 1.4 times for overweight and obesity in areas with socio-economic challenges as compared to areas with good socio-economic conditions.
Table 11 demonstrates that obesity is more prevalent in the first and second most deprived quantiles in a 4-year combined period. The values degrade gradually from quantile 1(17.4%) to quantile 5(12.9%).
| Income quantile 1 | Income quantile 2 | Income quantile 3 | Income quantile 4 | Income quantile 5 |
|---|---|---|---|---|
| 17.4 | 18.3 | 17.0 | 15.1 | 12.9 |
Table 11 demonstrates that obesity is more prevalent in the first and second most deprived quantiles in a 4-year combined period. The values degrade gradually from quantile 1(17.4%) to quantile 5(12.9%).
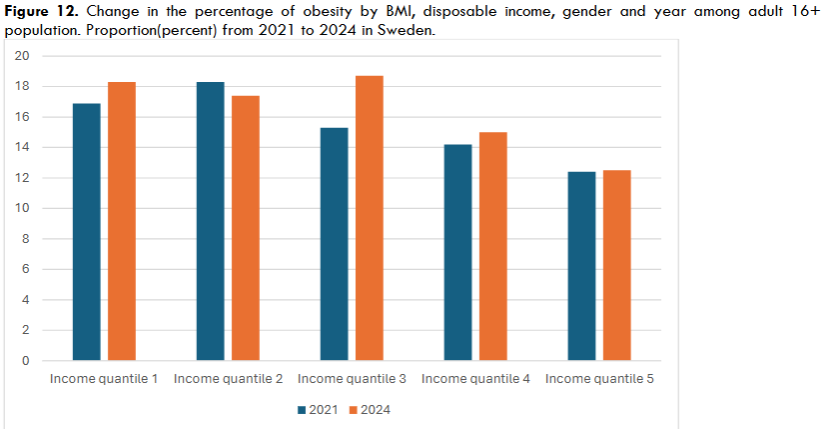
Table 12 shows a steady increase in prevalence of obesity in the most deprived quantile 1 – from 16.9% in 2021 to 18.3% in 2024; the highest increase is observed in quantile 3 – from 15.3% to 18.7%. The least deprived quantiles have the lowest prevalence of diabetes across 2021-2024 years.
| Income quantile 1 | Income quantile 2 | Income quantile 3 | Income quantile 4 | Income quantile 5 |
|---|---|---|---|---|
| 16.9 | 16.7 | 17.8 | 18.3 | 18.7 |
Table 12 shows a steady increase in prevalence of obesity in the most deprived quantile 1 – from 16.9% in 2021 to 18.3% in 2024; the highest increase is observed in quantile 3 – from 15.3% to 18.7%. The least deprived quantiles have the lowest prevalence of diabetes across 2021-2024 years.
Figure 13. Obesity by BMI, disposable income, gender and year among adult 16+ population. Average proportion (percent) 2021-2024.
The linear diagram shows that in lower income quantiles 1 and 2, the prevalence of obesity is the highest – quantile 1-17.5%, quantile 2-18.3%; in contrast, the least deprived quantile shows the lowest prevalence of obesity- 12.9%.
Table 13 demonstrates inequality in a daily consumption of fruits, berries and vegetables across 21 counties of Sweden.
| County | Vegetables and root vegetables, at least 2 times/day | Fruit and berries at least 2 times /day |
|---|---|---|
| Stockholm | 37.7 | 23.2 |
| Uppsala | 38.8 | 23.8 |
| Södermanland | 29.6 | 21.8 |
| Östergötland | 31.8 | 24.1 |
| Jönköping | 25.8 | 25.2 |
| Kronoberg | 33.9 | 24.6 |
| Kalmar | 28.7 | 21.5 |
| Gotland | 31.1 | 23.7 |
| Blekinge | 32.1 | 29.1 |
| Skåne | 33.2 | 23.8 |
| Halland | 32.0 | 23.8 |
| Vastra Götaland | 31.7 | 25 |
| Varmland | 25.5 | 20.3 |
| Örebro | 25.7 | 19.6 |
| Vastmanland | 29.6 | 20.9 |
| Dalarna | 32.5 | 23.2 |
| Gavleborg | 28.9 | 23.7 |
| Vasternorrland | 24.0 | 20.2 |
| Jamtland | 25.3 | 20.6 |
| Vasterbotten | 29.9 | 21.6 |
| Norrbotten | 23.9 | 19.0 |
Table 13 demonstrates inequality in a daily consumption of fruits, berries and vegetables across 21 counties of Sweden.
Figure 14 compares indicators for diabetes, fruit and vegetable intake shows that counties with the lowest consumption have the highest prevalence of diabetes.
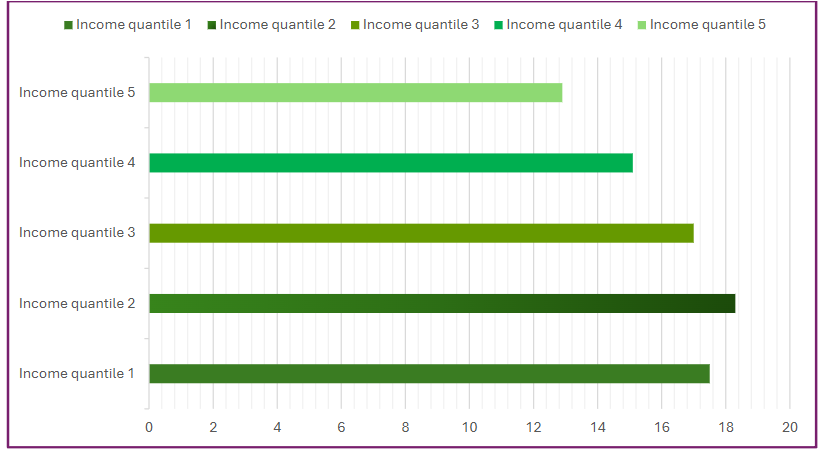
Table 14 indicates a negative trend in daily vegetable consumption across all income quantiles over a 3-year period.
| Income quantile 1 | Income quantile 2 | Income quantile 3 | Income quantile 4 | Income quantile 5 |
|---|---|---|---|---|
| 32.1 | 31.3 | 30.1 | 37.4 | 38.6 |
Table 14 indicates a negative trend in daily vegetable consumption across all income quantiles over a 3-year period.
Table 15 shows the inequal distribution of daily vegetable consumption across five income quantiles.
| Income quantile 1 | Income quantile 2 | Income quantile 3 | Income quantile 4 | Income quantile 5 |
|---|---|---|---|---|
| 31.1 | 29.1 | 31.3 | 33.6 | 37 |
Table 15 shows the inequal distribution of daily vegetable consumption across five income quantiles.
Discussion
This study evaluated the effects of socio-economic deprivation on the prevalence and distribution of diabetes type 2 and obesity among population aged 16 and over in England and Sweden. The results of the Pearsons’ correlation coefficient and multiple regression analyses showed that both the prevalence of diabetes type 2 and obesity increase with the increasing area deprivation at the county and unitary authorities’ level. The strong positive correlations (r> 0.6) were identified between the indictors of diabetes, obesity prevalence and area deprivation score. Conversely, strong negative correlations (r from -0.6 to -0.8) were revealed between the indicator of daily fruit and vegetable intake, prevalence of obesity, diabetes and area deprivation. The strength of linear relationships revealed is high across all variables. The results of the Pearsons’ correlation coefficient and multiple regression analyses reached high statistical significance, with p-values considerably lower than a minimum of 0.05. For multiple regression analysis, the R squared of all examined variables indicated that the model well explains the variability.
The results of multiple regression analysis showed a strong positive correlation between the diabetes and obesity prevalence with b* = 0.7 and p= 0.000; the diabetes prevalence and Index of multiple deprivation score – b* = 0.6 and p =0.000. The most pronounced negative relationship was identified between “5-a-day” fruit and vegetable consumption and deprivation level – b*= -0.8 (p=0.000). This result revealed that daily fruit and vegetable intake significantly decreases with the increase in deprivation level.
Drawing on the results of Pearson’s correlation and multiple regression analyses, the following inferences can be made – more deprived counties of England demonstrate lack of affordability and access to healthy food like fruit and vegetables for people residing in these areas. In addition to this, strong negative correlations were detected between the prevalence of diabetes, obesity and “5-a-day” fruit and vegetable consumption with b*= -0.7 and b*= -0.6, respectively. P value for both reached high statistical significance p= 0.000. The results of the study clearly indicate that areas with higher fruit and vegetables intake have lower prevalence of obesity and diabetes.
Overall, considering the results of this study, it is obvious that socio-economic deprivation imposes a significant negative impact on health; living in the deprived areas is associated with a higher risk of developing diabetes and its main prerequisite obesity. In addition to this, deprivation areas consume less vegetables and fruits. The analysis of Pearson’s correlation coefficient also revealed that the prevalence of diabetes and obesity decreased with the increasing consumption of fruit and vegetables. The mean value for daily fruit and vegetables consumption indicator in the two second most deprived areas of England is 24.5% meaning that only ¼ of the population can afford fruits and vegetables daily.
The similar inferences can be made drawing on the results for Sweden. In general, diabetes type 2 in Sweden is distributed unequally, with the higher values registered in lower income counties. Also, the increase in prevalence of diabetes in counties with higher economic standards is relatively small compared to more deprived ones. For instance, the percentage of people with diabetes raised from 6.6 to 6.8 % in Norbotten, 5.4 to 6.1% in Stockholm, 5.7 to 6.2% in Vasterbotten, within the period from 2017 to 2024 year; in Halland, the prevalence of diabetes even dropped from 5.4 to 4.9%. All above mentioned counties relate to higher income quantiles and the overall increase in the prevalence of diabetes type 2 did not exceed 1%.
Conversely, the counties located in lower income areas demonstrate a stable increase in the prevalence of diabetes type 2. The most pronounced values describing the changes in percentage of people with the diagnosis of diabetes from 2017/2020 to 2021/2024 period can be observed in counties with lower economic standard and related to more deprived quantiles like Jamtland -from 6.7 to 11.2 (increased by 4.5%); Varmland- from 7.4 to 8.9; Södermanland – from 6.4 to 9.5% (increased by 3.1%); Jönköping – from 5.5 to 7.3%.
In Sweden, the following five area types are used to determine and divide area type according to its deprivation status – Area type 1 – represents area with major socio-economic challenges, Area type 2– area with socio-economic challenges, Area type 3- socio-economically mixed areas, Area type 4- areas with good socio-economic conditions, Area type 5- areas with very good socio-economic conditions. Additionally, the five different income quantiles are used, divided depending on the total disposable income per household minus taxes. Disposable income per consumption is divided into quantiles, where quantile 1 refers to the fifth of the population with the lowest income and quantile 5 the fifth population with the highest income.
Based on these area divisions, it can be observed that the prevalence of obesity and diabetes increase gradually from the least deprived quantiles and socio-economic area type to the most deprived areas with major socio-economic challenges. The results for the prevalence of overweight and obesity replicate the research findings for England with the highest percentage of obese and overweight populations residing in the lower income quantiles 1 and 2 and areas with major socio-economic issues.
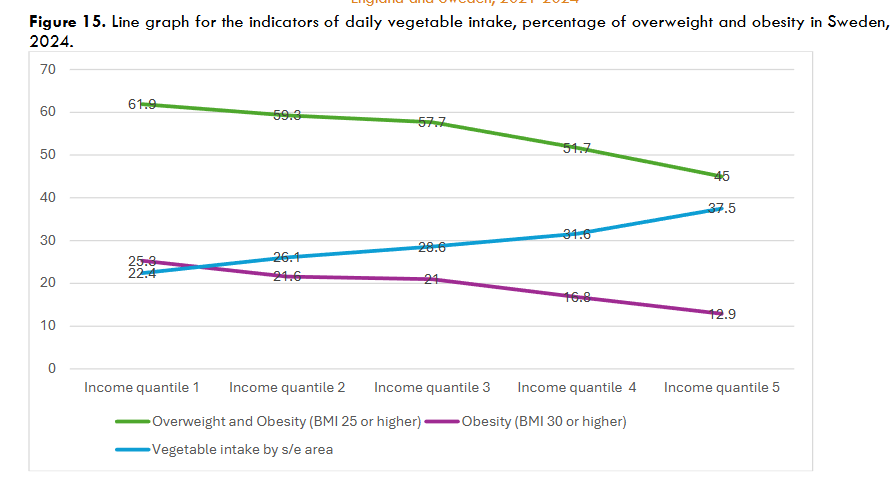
For instance, values steadily decrease from 25.3% for obesity and 61.9% for overweight and obesity to 12.9% in quantile 4 and 45% in quantile 5, respectively (Figure 15). The proportion of overweight and obese population increased across all five area types; however, the highest numbers relate to areas marked as having major socio-economic challenges (61.9%), socio-economic challenges (55.7%), and socio-economically mixed types (57.7%), in 2024. The lowest percentage of overweight and obese population reside in the area type with a very good socio-economic condition (45% in 2024) (Table 10).
Regarding the obesity with BMI 30.0 or higher, the negative increasing trend can also be observed in all socio-economic area types and income quantiles, but the numbers differ significantly depending on the area type. For example, in 2024, the prevalence of obesity was 25.2% in the area type marked as having major socio-economic challenges, whereas only 12.9% of those were identified in area type with very good socio-economic conditions, meaning that more deprived area types demonstrate almost twofold higher prevalence of obesity (Table 10). Similar results can be seen in obesity, measured according to the disposable income division; lower income quantiles 1–3 reflect a higher proportion of obese population: income quantile 1 – 18.3%, income quantile 2 – 17.4%, income quantile 3 – 18.7%, in 2024. What’s more, the higher income quantiles showed a minimal growth in the prevalence of obesity over a 4-year period (2021–2024); income quantile 4 – from 14.2% to 15.0%, and income quantile 5 – from 12.4% to 12.5% (Table 12).
Concerning the associations between diabetes, obesity, fruit and vegetables intake, areas with socio-economic challenges and low economic standards are associated with lower fruit and vegetables intake and higher prevalence of diabetes and obesity (Figure 14,15, Table 9,13). For example, the elevated level in 11.2% of patients with diabetes is registered in Jamtland county, whereas the fruit and vegetables consumption remain low – 20.6% for fruit and berries, and 25.3% for vegetables. A similar pattern can be seen in Dalarna county with 7.9% of diabetes, 23.2% for fruit and berries and 24% for vegetables. The opposite results can be observed in counties with higher levels of fruit and vegetable consumption like Stockholm, Kronoberg, Blekinge, Skane, Halland. The counties with the lowest prevalence of diabetes like Halland (4.9%) and Kronoberg (4.5%) demonstrate a high daily intake of fruit and vegetables – 33.9% and 32%, respectively (Figure 14, Table 8,13).
The consumption of vegetables and fruits is the lowest in the two most deprived income quantiles 1 – 22.4% and quantile 2 – 26.1%, and the highest in the two least deprived ones – quantile 4 – 31.6% and quantile 5 – 37.5%. There are few exceptions like Gavleborg, Uppsala and Norrbotten, but in general, the prevalence of diabetes is increasing in counties with decreased levels of fruit and vegetable consumption (Figure 12, Table 13–16).
The vegetable and root vegetable consumption also decreased in all socio-economic and income area types. Areas marked as having socio-economic challenges demonstrate the lowest intake with a negative tendency – 29.4% in 2021 and 22.4% in 2024, in the area with major socio-economic challenges; 31.1% in 2021 and 26.1% in 2024, in the area with socio-economic challenges. Although a total daily intake of vegetables decreased in all area types, the overall decline is considerably higher in the deprived types having socio-economic challenges – numbers decreased by 7% and 5%, from 2021 to 2024, respectively (Table 16).
Concerning measurements in the income quantiles, in general, the analysis revealed a negative trend in vegetable consumption across all income quantiles; even in the least deprived quantile 5, the numbers dropped from 37.4% in 2021 to 34.9% in 2024 (Table 14,15). This tendency coincides with a decline in the population’s income expressed in the Economic standard indicator. The total population’s income decreased in all 21 counties of Sweden from 2021 to 2023 (Table 9). The additional support to these findings can be obtained from the study of Ball et al. (2015) which found evidence of an association between fruit and vegetable intake and neighbourhood-level socio-economic status in Canada, New Zealand, Scotland and Portugal, with increased odds of greater fruit and vegetable consumption in neighbourhoods with higher socio-economic status.²⁷
Similar inferences were made from the cross-sectional survey of Southwest China: the urban areas with higher income and socio-economic status consume more fruit and vegetables and generally are more likely to practice healthy eating habits than those residing in rural areas with socio-economic challenges.²⁸
Fruit and vegetables are known to reduce hunger and promote satiety with the lower calories and energy intake; a regular intake of fruit and vegetables prevents excessive weight gain and leads to decrease in body weight over time among overweight and obese people. Bioactive elements, vitamins and phytonutrients contained in fruit and vegetables reduce blood lipids, lipogenesis and oxidative damage to cells, increase lipolysis, insulin sensitivity and improve microbiomes for better health.²⁹,³⁰ According to several research studies, among other benefits, higher intake of fruit and vegetables is associated with a decreased risk of developing cardiovascular disorders and lower mortality rates.³¹ WHO suggests daily intake of more than 400 grams of fruits and vegetables aids in improving overall health and reducing the risk of certain non-communicable diseases including diabetes type 2.³²
The findings of this research on interrelations of diabetes type 2, obesity, deprivation, fruit and vegetable consumption corroborate with the results of other studies, investigating the association of deprivation, low consumption of fruit and vegetables and their role in developing obesity and diabetes type 2. A meta-analysis of Li et al. (2014) found that higher consumption of fruit or green leafy vegetables is associated with a significantly reduced risk of type 2 diabetes. The results were based on the pooled analysis of prospective cohort studies including 24,013 cases of type 2 diabetes and 434,342 participants.³³
Concerning deprivation, the European Central Bank reported in its overview that euro area budgets are facing challenges due to uncertain and vulnerable geopolitical uncertainties and global conflicts. Many euro area countries, including large economies, are expected to have budget deficits in 2025 year. Such an environment poses downside risks to an overall economic growth, increase in inflation and decline in Global Domestic Product which has already been observed in European area from 2020 to 2024 years.³⁴
Regarding Sweden, the Table 9 shows that from 2021 to 2023 the Economic standard indicators in all 21 counties follows a negative trend; the total household income is declining across all income quantiles. This negative tendency coincides with a steady decline in overall daily fruit and vegetable consumption and increase in the prevalence of obesity and diabetes type 2 particularly in lower income quantiles and areas with socio-economic challenges (Table 8,10,13,14,16). In addition to this, the World Bank presented the results of Food insecurity Experience Scale surveys, which revealed that the percentage of people who cannot afford healthy food increased from 2022 to 2023. For instance, in 2022, 4.9% of participants responded positively to the question “Unable to eat healthy and nutritious food because of a lack of money or other resources”, 5.6% of participants “Worried you would not have enough food to eat because of a lack of money or other resources” and 7.7% to “Ate only a few kinds of foods because of a lack of money or other resources”.³⁵ The same survey for 2023 year showed that these numbers increased by 0.8%, 0.7% and 1.2%, respectively.³⁶
The data for the United Kingdom demonstrates a similar worsening trend from 2022 to 2023: the percentage of people unable to eat healthy food changed from 7.5% to 10.4%; ate few foods due to lack of resources – from 7% to 8.1%; worried about not having enough food due to lack of resources – from 9.1% to 10.4%. In general, the United Kingdom has a higher overall number of people who experienced food insecurity.³⁷,³⁸
STRENGTHS
This study adds valuable knowledge to research on associations of area deprivation and health. The analyses are based on large nationwide datasets including register-based routine data sources as well as national health surveys. Health surveys provide additional and relatively accurate data on the prevalence of diabetes adjusted by age, sex, ethnic group and deprivation.¹⁹,³⁹ This is the first study to examine interrelations between health indicators representing diabetes, obesity, deprivation, income level, fruit and vegetables intake in Sweden on a county level. The analysis of data for England has a high statistical power since a large sample size was selected for this study. Also, the data was collected independently of the study, and this reduces various types of biases.⁴⁰,⁴¹ Randomization used for the data in the statistical analysis for England reduces a
selection bias and enhances a quality of evidence-based research increasing generalizability and validity of the results.⁴²
LIMITATIONS
This study has some limitations, first, the true prevalence of diabetes can be higher in both countries because the data was retrieved from self-reported national surveys and some respondents may be unaware of their diabetes status (undiagnosed diabetes, prediabetes). Also, secondary routine epidemiological data has lower quality – only those who are registered in health services and approach them are recorded, this means that a large proportion of the population might be underreported or undetected in the disease.⁴⁴ Secondly, one of the common drawbacks of the surveys is response bias and social desirability bias, especially this is a frequent issue of self-reported surveys, where people can provide inaccurate data to look more socially acceptable. In nationwide surveys this bias is extremely hard to control.¹⁸,⁴³ Another limitation is that, for England, the prevalence of diabetes indicates all types of diabetes, however, most cases (95%) constitute diabetes type 2. Additionally, no separate data on all four health indicators was available and only combined 4-year average values were presented.²,¹⁷ Regarding Sweden, the data for Gotland County was not provided within the period of 2022–2023. The Economic standard indicator did not contain data for 2024 year. Lastly, results are based on cross-sectional data which limits their interpretation in a casual way.⁴⁴
This analysis along with other existed research on topic shows that unhealthy diet and low consumption of fruit and vegetables are not only driven by personal will choice and hazard behaviours, but also by a lack of financial resources and access to healthier food, precisely, consumption of fruit and vegetables daily. Therefore, it is recommended to prioritize the implementation of intervention measures and policies to promote access to healthy food ingredients in areas with lower socio-economic status and higher deprivation level, as well as provide opportunities for residents of deprived areas to engage in healthy dietary behaviours through education and governmental support.⁶,⁴⁵
Conclusion
In conclusion, this research study shows that diabetes type 2 and obesity are unequally distributed in England and Sweden with the higher prevalence of both diseases in areas with lower socio-economic status and higher level of deprivation. The results should be interpreted with precautions due to the limitations of the study. Strong positive linear relationships between diabetes type 2, obesity and deprivation were identified in England through the statistical analysis of routine epidemiological data. A comparative analysis of data for Sweden demonstrated similar trends with the increase in prevalence of obesity and diabetes type 2 in more deprived counties. The highest numbers are reported in area types with major socio-economic challenges (quantile 1 and 2) in Sweden and the most and second most deprived deciles in England. Conversely, the highest daily fruit and vegetables consumption was observed in the least deprived 4th and 5th quantiles in Sweden and the least and second least deciles in England. Strong negative associations were detected between fruit and vegetables daily intake and socio-economic deprivation in England. The data for Sweden reflects a similar tendency, with the decrease in fruit and vegetables consumption declining with the increase in deprivation level. Lower daily intake of fruit and vegetables registered in areas with socio-economic challenges can also be considered as one of the contributing factors to obesity through an unhealthy diet. Scarcity of resources may prevent people from eating healthier food.⁶,⁴⁵ Overall, socio-economic deprivation can be considered as one of the main contributing factors to increasing trends for obesity and diabetes type 2 in England and Sweden.
References
1. World Health Organisation. Diabetes. Geneva WHO. 2024. https://www.who.int/news-room/fact-sheets/detail/diabetes Accessed June 27, 2025.
2. Office for Health Improvement and Disparities. Official Statistics. Diabetes profile: statistical commentary, March 2025. 2025. https://www.gov.uk/government/statistics/diabetes-profile-update-march-2025/diabetes-profile-statistical-commentary-march-2025 Accessed June 23, 2025
3. Global Burden of Disease Collaborative Network. Global Burden of Disease Study 2021. Results. Institute for Health Metrics and Evaluation. 2024 (https://vizhub.healthdata.org/gbd-results/). Accessed July 10, 2025.
4. World Health Organisation. Obesity and overweight. Geneva WHO. 2025. https://www.who.int/news-room/fact-sheets/detail/obesity-and-overweight Accessed June 27, 2025.
5. Okunogbe A, Nugent R, Spencer G, Powis J, Ralston J, Wilding J. Economic impacts of overweight and obesity: current and future estimates for 161 countries. BMJ Glob Health. 2022; 7(9): e009773. https://pubmed.ncbi.nlm.nih.gov/36130777/ Accessed June 27, 2025.
6. Au-Yeung CL, Ellis D, Dallaway A, Riley J et al. Socioeconomic and ethnic inequalities increase the risk of type 2 diabetes: an analysis of NHS health check attendees in Birmingham. Front. Public Health. 2024; 12. https://www.frontiersin.org/journals/public-health/articles/10.3389/fpubh.2024.1477418/full Accessed June 22, 2025.
7. Choi D-W, Lee SA, Lee DW, Joo JH et al. Effect of socioeconomic deprivation on outcomes of diabetes complications in patients with type 2 diabetes mellitus: a nationwide population-based cohort study of South Korea. BMJ Open Diabetes Research & Care. 2020; 8: e000729. https://drc.bmj.com/content/8/1/e000729?__cf_chl_rt_tk=gNKh30iL9r1CEK61.qz8RAeNZeCUw28GBvH5leFK1Ww-1750192871-1.0.1.1-vUHdl3Kzu57ofGaOb4U3tKUCjKTckAK6DXxvh2Wn_3g#sec-9 Accessed June 22, 2025.
8. Grundmann N, Mielck A, Siegel M et al. Area deprivation and the prevalence of type 2 diabetes and obesity: analysis at the municipality level in Germany. BMC Public Health. 2014; 14:1264. https://bmcpublichealth.biomedcentral.com/articles/10.1186/1471-2458-14-1264#citeas Accessed June 22, 2025.
9. International Diabetes Federation. United Kingdom. Diabetes country report 2000-2050. 2025. https://diabetesatlas.org/data-by-location/country/united-kingdom/ Accessed July 10, 2025.
10. Overweight (including obesity) prevalence in adults, (using adjusted self-reported height and weight) (18+ yrs). Proportion – % https://fingertips.phe.org.uk/search/Overweight%20and%20obesity#page/4/gid/1938133368/pat/159/par/K02000001/ati/15/are/E92000001/iid/93088/age/168/sex/4/cat/-1/ctp/-1/yrr/1/cid/4/tbm/1 Accessed July 10, 2025.
11. Public Health Profiles. Obesity prevalence in adults, (using adjusted self-reported height and weight (18+). Proportion (percent). 2025. https://fingertips.phe.org.uk/search/Obesity#page/3/gid/1938133152/pat/10146/par/cat-146-1/ati/402/iid/93881/age/168/sex/4/cat/-1/ctp/-1/yrr/1/cid/4/tbm/1 Accessed June 7, 2025.
12. Folkhalsomyndigheten. Public health data. Diabetes by sex,region and year (4-year averages). Proportion(percent).2025. https://fohm-app.folkhalsomyndigheten.se/Folkhalsodata/pxweb/sv/A_Folkhalsodata/A_Folkhalsodata__Z_ovrigdata__HLVkn__Hals/diabet.px/ Accessed June 6, 2025.
13. International Diabetes Federation. Sweden. Diabetes country report 2000-2050.2025. https://diabetesatlas.org/data-by-location/country/sweden/ Accessed June 23, 2025.
14. Agardh EE, Sidorchuk A, Hallqvist J, Ljung R. Burden of type 2 diabetes attributed to lower educational levels in Sweden. Population Health Metrics. 2011; 9:60. file:///C:/Users/HP/Downloads/1478-7954-9-60.pdf Accessed June 23, 2025.
15. Public Health Profiles. Deprivation score. 2025. https://fingertips.phe.org.uk/search/Deprivation%20score%202019#page/3/gid/1/pat/10160/ati/502/are/E09000002/iid/93553/age/1/sex/4/cat/-1/ctp/-1/yrr/1/cid/4/tbm/1 Accessed June 7, 2025.
16. Public Health Profiles. Percentage of adults meeting the “5-a-day” fruit and vegetable consumption recommendations. Proportion (percent). 2025. https://fingertips.phe.org.uk/search/Percentage%20of%20adults%20meeting%20the%205%20a%20day%20fruit%20and%20vegetable%20consumption%20recommendations#page/3/gid/1/pat/10160/par/cat-160-1/ati/502/iid/93982/age/164/sex/4/cat/-1/ctp/-1/yrr/1/cid/4/tbm/1 Accessed June 7, 2025.
17. Public Health Profiles. Diabetes: QOF prevalence. 2025. https://fingertips.phe.org.uk/search/Diabetes%20QOF%20prevalence#page/3/gid/1/pat/10146/ati/402/are/E09000006/iid/241/age/187/sex/4/cat/-1/ctp/-1/yrr/1/cid/4/tbm/1 Accessed June 7, 2025.
18. Saunders MNK, Lewis P, Thornhill A. Research Methods for Business Students. Eighth edition. New York. Pearson Education Limited. 2019. 12: 564-636. Accessed July 7, 2025.
19. Bruce N, Pope D, Stanistreet D. Quantitative methods for health research. A Practical Interactive Guide to Epidemiology and Statistics. Chichester: Wiley-Blackwell. c2008. https://www.vlereader.com/Reader?ean=9780470022764 Accessed July 4, 2025.
20. Folkhalsomyndigheten. Public health data. Overweight and obesity by BMI, disposable income, gender and year. Proportion (percent). 2025.Available from: https://fohm-app.folkhalsomyndigheten.se/Folkhalsodata/pxweb/sv/A_Folkhalsodata/A_Folkhalsodata__Z_ovrigdata__Vikt%20(BMI)__ViktULF/BMIULFink.px/table/tableViewLayout1/ Accessed June 6, 2025.
21. Folkhalsomyndigheten. Public health data. Overweight and obesity by socioeconomic area type, sex and year. Proportion (percentage).2025. https://fohm-app.folkhalsomyndigheten.se/Folkhalsodata/pxweb/sv/A_Folkhalsodata/A_Folkhalsodata__A_Mo8__Halsoutfall__09Riskfakt__09.01overfet/overfettyp.px/table/tableViewLayout1/ Accessed June 6, 2025.
22. Folkhalsomyndigheten. Public health data. Vegetable and root vegetable intake by household income, gender and year. Share (percent).2025. https://fohm-app.folkhalsomyndigheten.se/Folkhalsodata/pxweb/sv/A_Folkhalsodata/A_Folkhalsodata__A_Mo8__6_Levanor__02Okad__06.22gronsakdag/gronsakdagbeko.px/table/tableViewLayout1/ Accessed June 6, 2025.
23. Folkhalsomyndigheten. Public health data. Vegetable and root vegetable intake by socioeconomic area type, gender and year. Proportion (percent).2025. https://fohm-app.folkhalsomyndigheten.se/Folkhalsodata/pxweb/sv/A_Folkhalsodata/A_Folkhalsodata__A_Mo8__6_Levanor__02Okad__06.22gronsakdag/gronsakdagtyp.px/table/tableViewLayout1/ Accessed June 6, 2025.
24. Folkhalsomyndigheten. Public health data. Economic Standard by gender, region and year. Thousands of kronor. 2025.
https://fohm-app.folkhalsomyndigheten.se/Folkhalsodata/pxweb/sv/A_Folkhalsodata/A_Folkhalsodata__A_Mo8__4_Inkomst__01Fordelink__04.01Dink/DinkReg.px/ Accessed June 6, 2025.
25. Public Health Profiles. Indicator Definitions and Supporting Information. 2025. https://fingertips.phe.org.uk/search/Diabetes%20QOF%20prevalence#page/6/gid/1/pat/15/par/E92000001/ati/502/are/E09000002/iid/241/age/187/sex/4/cat/-1/ctp/-1/yrr/1/cid/4/tbm/1 Accessed June 22, 2025.
26. Fruit and vegetable intake by gender, region and year (4-year averages) 2021-2024. Proportion(percent). https://fohm-app.folkhalsomyndigheten.se/Folkhalsodata/pxweb/sv/A_Folkhalsodata/A_Folkhalsodata__Z_ovrigdata__HLVkn__Mat/fruktgront.px/ Accessed July 1, 2025.
27. Ball K, Lamb KE, Costa C, Cutumisu N et al. Neighbourhood socioeconomic disadvantage and fruit and vegetable consumption: a seven countries comparison. Int J Behav Nutr Phys Act. 2015; 12: 68. https://link.springer.com/article/10.1186/s12966-015-0229-x#Sec8 Accessed June 30, 2025.
28. Fu L, Shi Y, Li S et al. Healthy Diet-Related Knowledge, Attitude, and Practice (KAP) and Related Socio-Demographic Characteristics among Middle-Aged and Older Adults: A Cross-Sectional Survey in Southwest China. Nutrients. 2024;16(6): 869. https://pmc.ncbi.nlm.nih.gov/articles/PMC10974890/#sec4-nutrients-16-00869 Accessed July 11, 2025.
29. Prentice AM, Jebb SA. Fast foods, energy density and obesity: a possible mechanistic link. Obes Rev. 2003; 4(4):187-94. https://pubmed.ncbi.nlm.nih.gov/14649369/ Accessed July 3, 2025.
30. Krishnaswamy K & Gayathri R. Nature’s bountiful gift to humankind: Vegetables & fruits & their role in cardiovascular disease & diabetes. Indian Journal of Medical Research. 2018; 148(5): 569-595. https://journals.lww.com/ijmr/fulltext/2018/48050/nature_s_bountiful_gift_to_humankind__vegetables__.13.aspx Accessed June 27, 2025.
31. Mente A, Dehghan M, Rangarajan S, O’Donnell M, et al. Diet, cardiovascular disease, and mortality in 80 countries. Eur Heart J. 2023; 44(28): 2560-2579. https://pmc.ncbi.nlm.nih.gov/articles/PMC10361015/#abstract1 Accessed July 3, 2025.
32. World Health Organization. Increasing fruit and vegetable consumption to reduce the risk of non-communicable diseases. e-Library of Evidence for Nutrition Actions (eLENA). Geneva WHO.2023. https://www.who.int/tools/elena/interventions/fruit-vegetables-ncds Accessed June 28, 2025.
33. Li M, Fan Y, Zhang X, Hou W et al. Fruit and vegetable intake and risk of type 2 diabetes mellitus: meta-analysis of prospective cohort studies. BMJ Open. 2014; 4: e005497. https://bmjopen.bmj.com/content/4/11/e005497.long Accessed June 28, 2025.
34. Andreeva D, Bednarek P, Cera K, Daly P et al. European Central Bank. Financial Stability Review. https://www.ecb.europa.eu/press/financial-stability-publications/fsr/html/ecb.fsr202505~0cde5244f6.en.html#toc2 Accessed June 30, 2025.
35. The World Bank. FAO Statistics Division. Food Insecurity Experience Scale 2022. Sweden, 2022. file:///C:/Users/HP/Downloads/ddi-documentation-english_microdata-6063.pdf Accessed June 30, 2025.
36. The World Bank. FAO Statistics Division. Food Insecurity Experience Scale 2023. Sweden, 2023. file:///C:/Users/HP/Downloads/ddi-documentation-english_microdata-6334.pdf Accessed June 30, 2025.
37. The World Bank. FAO Statistics Division. Food Insecurity Experience Scale 2022. United Kingdom, 2023. file:///C:/Users/HP/Downloads/ddi-documentation-english_microdata-6026.pdf Accessed June 30, 2025.
38. The World Bank. FAO Statistics Division. Food Insecurity Experience Scale 2023.United Kingdom, 2023. file:///C:/Users/HP/Downloads/ddi-documentation-english_microdata-6304.pdf Accessed June 30, 2025.
39. Bonita R, Beaglehole R, Kiellstrom T. Basic Epidemiology. Geneva: WHO Press. c2012. https://rl.talis.com/3/essex/lists/FEE24BB6-E10B-385C-1484-AAB365FA5EBC.html?lang=en-GB Accessed July 11, 2025.
40. Pop B, Fetica B, Blaga ML, et al. The role of medical registries, potential applications and limitations. Med Pharm Rep. 2019; 92(1): 7-14. https://www.ncbi.nlm.nih.gov/pmc/articles/PMC6448488/ Accessed July 8, 2025.
41. Thygesen L.G, Ersboll A.K. When the entire population is the sample: strengths and limitations in register-based epidemiology. Eur J Epidemiol 2014; 29(8): 551-558. http://www.jstor.org/stable/43775005 Accessed July 6, 2025.
42. Lim CY, In J. Randomization in clinical studies. Korean J Anesthesiol. 2019; 72(3): 221-232. https://www.ncbi.nlm.nih.gov/pmc/articles/PMC6547231/ Accessed July 3, 2025.
43. Mooney SJ, Westreich DJ, El-Sayed AM. Epidemiology in the Era of Big Data. Epidemiology. 2015; 26(3): 390-394. https://www.ncbi.nlm.nih.gov/pmc/articles/PMC4385465/ Accessed July 9, 2025.
44. Green J, Tones K, Cross R., et al. Health Promotion: Planning and Strategies. Edition: 4th. London: SAGE. c2019. https://online.vitalsource.com/#/books/9781526470980/cfi/6/30!/4/2/4/2@0:0 Accessed July 8, 2025.
45. Hill-Briggs F, Adler NE, Berkowitz SA, Chin MH et al. Social determinants of health and diabetes: a scientific review. Diabetes Care. 2020; 44: 258-79. https://diabetesjournals.org/care/article/44/1/258/33180/Social-Determinants-of-Health-and-Diabetes-A#3283076 Accessed July 11, 2025.