

Vaccination Strategies in Random and Scale-Free Networks
Vaccination Campaigns on Random and Scale-Free Networks
Fernando E. Cornes 1, Claudio O. Dorso 1,2, Guillermo A. Frank 3*
- Departamento de Física, Facultad de Ciencias Exactas y Naturales, Universidad de Buenos Aires, Pabellón I, Ciudad Universitaria, 1428 Buenos Aires, Argentina.
- Instituto de Física de Buenos Aires, Pabellón I, Ciudad Universitaria, 1428 Buenos Aires, Argentina.
- Unidad de Investigación y Desarrollo de las Ingenierías, Universidad Tecnológica Nacional, Facultad Regional Buenos Aires, Av. Medrano 951, 1179 Buenos Aires, Argentina.
OPEN ACCESS
PUBLISHED: 31 March 2025
CITATION: Cornes, FE., Dorso, CO., et al., 2025. Vaccination Campaigns on Random and Scale-Free Networks. Medical Research Archives, [online] 13(3). https://doi.org/10.18103/mra.v13i3.6405
COPYRIGHT: © 2025 European Society of Medicine. This is an open-access article distributed under the terms of the Creative Commons Attribution License, which permits unrestricted use, distribution, and reproduction in any medium, provided the original author and source are credited.
DOI https://doi.org/10.18103/mra.v13i3.6405
ISSN 2375-1924
ABSTRACT
The spreading of person-to-person infectious diseases (such as influenza) depends significantly on the contact network of the community. Any successful vaccination plan demands a complete understanding of how the disease can possibly propagate on this network. For this purpose, we examined vaccination actions on two specific community networks: scale-free networks and random networks. We applied a “random” vaccination plan and a “strategic” vaccination plan on both networks. The former corresponds to vaccine interventions regardless of the community structure, while the latter corresponds to preferential interventions according to the individual’s degree of connectivity. The “random” vaccination shows to be capable of reducing the infection peak, but the overall performance varies significantly if applied on a scale-free or random network. The “strategic” plan, on the contrary, prioritized vaccination actions on highly connected individuals. It showed more effective results since it slowed down the disease propagation while providing more time for immunization. We further applied the “strategic” plan to families instead of individuals alone. The plan appeared to perform nicely but not as effectively as vaccinating highly connected individuals.
Keywords: COVID-19, Complex networks, Small world.
1. Introduction
The spread of disease within large population groups is a complex phenomenon, shaped by the interactions between individuals and the internal dynamics of the disease within each person. These factors can vary widely across communities1-4 and depend on the specific infectious agent involved5-7. This variability helps to explain the diverse outcomes observed during the COVID-19 pandemic in 20208-10.
Research indicates that a consistent pattern of contagion cannot be established without considering the role of human mobility. Mobility can create connections between individuals outside their immediate social environment, such as family or friends2,5. Studies on common mobility patterns suggest that these can differ depending on the spatial scale being examined11. Nonetheless, there is wide consensus in the literature that people tend to follow a “scale-free” spatial distribution within a typical urban environment12-14. In a nutshell, this means that a small number of individuals are responsible for the majority of social interactions, while most people only attain a few social contacts15.
Human mobility introduces some degree of heterogeneity in the connectivity pattern. For instance, some groups may exhibit more connections than expected, leading to the formation of social communities. Consequently, epidemiological analysis must be conducted on two levels: a “global” scale that considers the overall progression of the disease and a “local” scale that focuses on the spreading within specific communities16. These scales are not necessarily spatial, as distinct “social layers” can overlap within the same geographic area15.
Given these complexities, a microscopic approach to epidemiological modeling becomes essential. This approach considers each individual as part of an epidemiological environment similar to a “small world” network17. Within this framework, individuals may become infected, and the disease spreads according to established models, typically involving three stages (SIR models) or four stages (SEIR models), though additional stages may also be considered18.
Incorporating vaccination strategies into this analysis adds another layer of complexity19. Vaccination can alter mobility patterns and social interactions by reducing the likelihood of disease transmission. For instance, vaccinated individuals may have fewer restrictions on their movement, which can impact how the disease spreads through different social groups20.
Our investigation stands on the above perspective for the COVID-19 spreading. We simulated and compared different vaccination strategies in order to mitigate the disease propagation. The paper is organized as follows: Section 2 describes the epidemiological model and the different mitigation strategies. Section 3 details the simulation procedure. Section 4 displays the results of our investigation. These results are later discussed in Section 5. Finally, conclusions are drawn in Section 5.
2. The Model
This section outlines the presumed environment for the disease propagation. We first summarize the main features of the connectivity network (see Sections 2.1 and 2.2). We secondly detail the compartmental model of the disease (see Section 2.3).
2.1 RANDOM AND SCALE-FREE NETWORKS
A network is essentially a collection of nodes (say, N) linked between each other in a specific manner. The random network and the scale-free network are possible examples that come up after establishing a rule for linking the nodes. The rules are as follows:
- (a) Random linking: a fixed probability π is set, and nodes are connected according to this probability, as detailed in Ref. 21.
- (b) Scale-free linking: the probability π of connecting an unlinked (new) node to an already attached node to the network depends on the degree of the latter22-23. That is, if the attached node i has an associated degree ki, the probability of connection to this node is given by:
𝐶𝐵(𝑖) = ∑𝑗≠𝑘∈𝑁 𝑏𝑖𝑗𝑘⁄𝑏𝑗𝑘
This is called a preferential attachment23. It has been shown that this connection probability generates a scale-free (or power-law) connectivity distribution24,25. Real-world examples of such networks include the Internet and the human brain26,27.
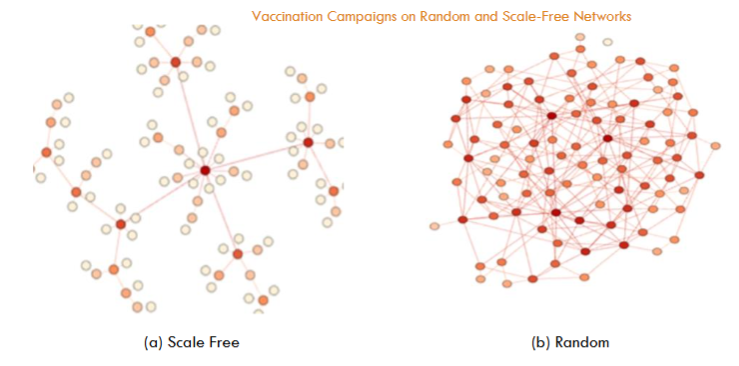
In network science, a node with an exceptionally high number of links is called a hub24. The existence of these hubs is the key difference between random networks and scale-free networks. Notice that the degree k in random networks is the same for all nodes. In scale-free networks, however, a few nodes (hubs) attain a high degree, while most of the nodes are scarcely linked.
2.2 THE CAVEMAN MODEL
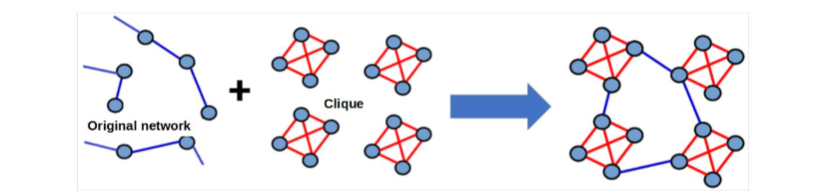
Disregarding the type of network (see Section 2.1), a caveman model can also be present in the network. This model captures the intra-family and inter-family social structure29. The common procedure to include the caveman model in the network is by first selecting randomly groups of four nodes (the family) and connecting them as a cliqué. Next, these family units were connected in a presumed fashion, allowing for interactions between different families, and thereby, reflecting a broader social network (see Fig. 2). It’s important to note that every individual is embedded within a family structure after this model.
2.3 THE SEIR EPIDEMIOLOGICAL MODEL
Throughout our investigation, we use the SEIRV epidemiological model to describe the disease evolution (see below). This model is widely used in epidemiology to simulate how diseases spread within a population. It offers a structured approach to understanding the dynamics of the disease transmission by categorizing the population into different stages30,31.
In this context, each individual (out of a population of N) stands on a compartmental stage of the disease. The stage corresponds to some (discrete) step in the evolution of the disease. This is a kind of approximation that categorizes the complex evolution of the disease into major compartments of specific features. The number of compartments depends on the disease under study. We consider five compartmental stages, since this suits the behavior of a wide family of diseases like COVID-19. The compartmental stages are as follows:
- (1) Susceptible S(t): number of individuals who can become infected upon contact with an infected person.
- (2) Exposed E(t): number of individuals carrying the disease but not yet able to infect others.
- (3) Infected I(t): number of individuals capable of transmitting the infection to susceptible individuals.
- (4) Recovered or removed R(t): number of individuals who have recovered and are immune.
- (5) Vaccinated V(t): number of individuals who are immune due to vaccination.
where S(t)+E(t)+I(t)+R(t)+V(t)=N.
We stress that these basic compartments provide a preliminary approximation for the disease evolution. However, the specific complexities of each disease may require more detailed compartments for a more accurate description5,7,32.
Notice that unlike other epidemiological models (SIS, SIR, etc.), the SEIR model fits better the behavior of the COVID-19 epidemic because it includes individuals in an incubation period of 5-6 days who are not yet infectious33.
3. Methods
3.1 THE NETWORKS IMPLEMENTATION
As already mentioned in Section 2.1, we implemented the random and scale-free (preferential attachment) networks22. Recall that each one expresses a very different contact structure. The scale-free network, however, has been shown to express accurately human mobility patterns22. The random network, although naive, is useful as a comparison to other social situations.
We programmed both types of networks in low-level codes in order to simulate networks as big as one million nodes (N). These may represent cities the size of Rosario or Mendoza in Argentina. We further run at least 30 realizations for statistical sampling.
The detailed procedure for building the random and scale-free networks can be found in Ref.34. We just remind here that our implementation of the random network yields degrees that do not exceed k≈10. The scale-free network, instead, yields nodes of very high degree values acting as hubs (k>100).
We also included cliqués for each kind of network, as explained in Section 2.2. These mimic the family structure in the network, although they do not change significantly the degree distributions in the network. Recall that the degree distribution for scale-free networks follows a power-law behavior (see Ref.34 for details).
The minimum allowable degree for our simulations was k=4 due to the cliqués. The corresponding scale-free distribution (say, the network attaining preferential attachment and family structure) exhibited a power law with exponent γ = −2.82.
The paramount network attribute concerning our investigation is its “minimum path length”, that is, the shortest distance between any two nodes in the network.
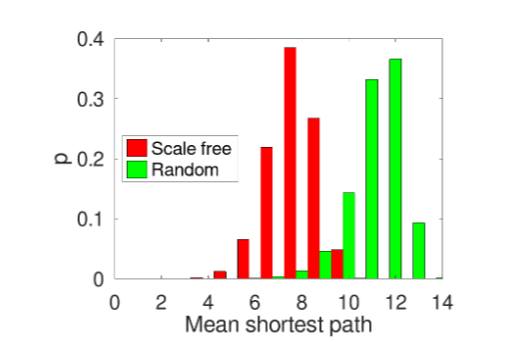
As can be noticed from Fig. 3, the average distance between any two nodes in the scale-free network is smaller with respect to the random network. This is due to the scale-free network’s structure, since the high-degree nodes, acting as hubs, enable more efficient and rapid dissemination of information across the network. Consequently, any “infection signal” or similar phenomenon within the scale-free network will spread more quickly than it would in the random network.
3.2 THE SEIR MODEL IMPLEMENTATION
The SEIRV model implementation follows the same steps as detailed for the SEIR model in Ref.34. But now we introduce the immunity stage due to vaccination (the ending V in the name of the model). We briefly resume the SEIR steps presented in Ref.34.
- Start the simulation by randomly infecting an individual from a susceptible population.
- List the “susceptible” (S) individuals linked to the infected one and switch their stage to “exposed” (E) with fixed probability p (see Ref.34).
- Switch those exposed (E) individuals to the “infected” (E) stage after the incubation period.
- Repeat the above steps until the end of the simulation.
The average values of the incubation and infection periods for COVID-19 reported in Ref.35 were considered.
The SEIRV model implements the vaccination strategy at step 2. Vaccination is applied exclusively on susceptible individuals since these are the ones at risk of becoming infected. However, we assumed that the vaccine provides immunity to the individual starting the day after its application.
The vaccines may be applied randomly on the population. However, an order of priority is also possible. For instance, the degree of connectivity in the network may establish an order of priority. Nodes are sorted according to the corresponding degree (in ascending or descending order), and the vaccines are strictly applied in this order.
According to literature, it appears to be some kind of relation between people’s age and the number of daily interactions they have (see, for example, Ref.36). Young individuals typically attain higher degrees of connectivity among the population than seniors. Thus, the order of priority based on the connectivity degree may be implemented by ordering people by their age. We will come back to this point in Section 4.2.
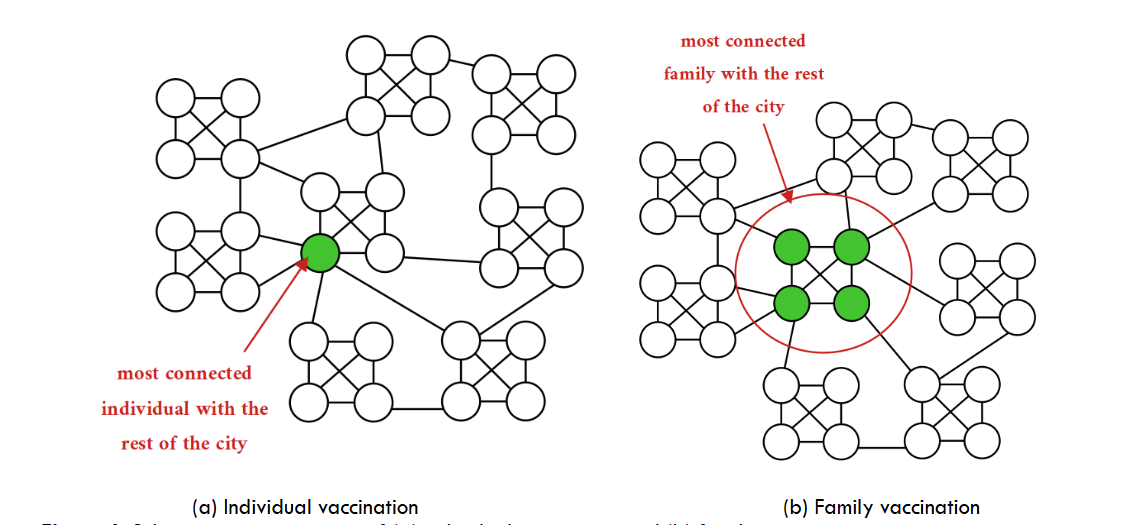
Complementary to random or priority vaccination of individuals, we may implement a family vaccination process.
4. Results
Our results are divided into two parts. As a first step, we studied the disease spreading using a random vaccination strategy, where vaccines were administered regardless of the individual’s connectivity. This approach, although naive, served as a baseline for the rest of the research. The “no matter who” intervention is the most elementary way of acknowledging how the disease propagates when a fraction of the population becomes immune.
As a second step, we focused on the more strategic intervention that prioritizes those (susceptible) individuals with a higher degree. This targeted strategy presumes that the mitigation efficiency depends on how fast the disease links can be broken. The higher the degree, the more links removed in a single shot.
4.1. RESULTS FOR THE RANDOM VACCINATION PROCESS
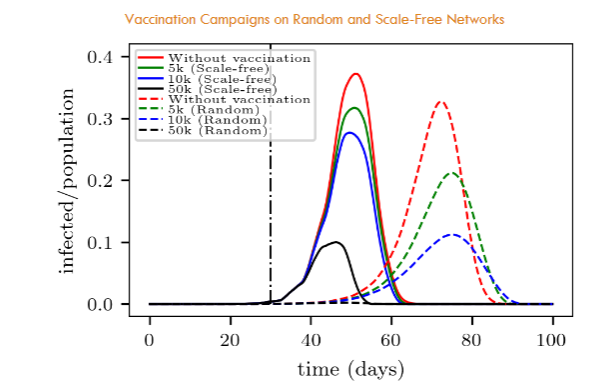
The curves for the random network in Fig. 5 are a clear example of the commonly referred to “curve flattening” phenomenon that is known to be quite relevant when dealing with possible overcrowdings of medical-care centers. But also calls attention to the fact of the timing: the more people can be vaccinated daily, the better.
Fig. 5 further allows the comparison between the vaccination in the random network and in the scale-free network. For instance, in a random network, 50,000 daily interventions appear enough for an almost complete stop of the disease propagation (in the context of our model). But, surprisingly, this is not the case for the scale-free network where people may be easily reached, according to Fig. 3. This is an apparent paradox since many propagation links are now unavailable due to vaccination. We will discuss this point in Section 5.1.
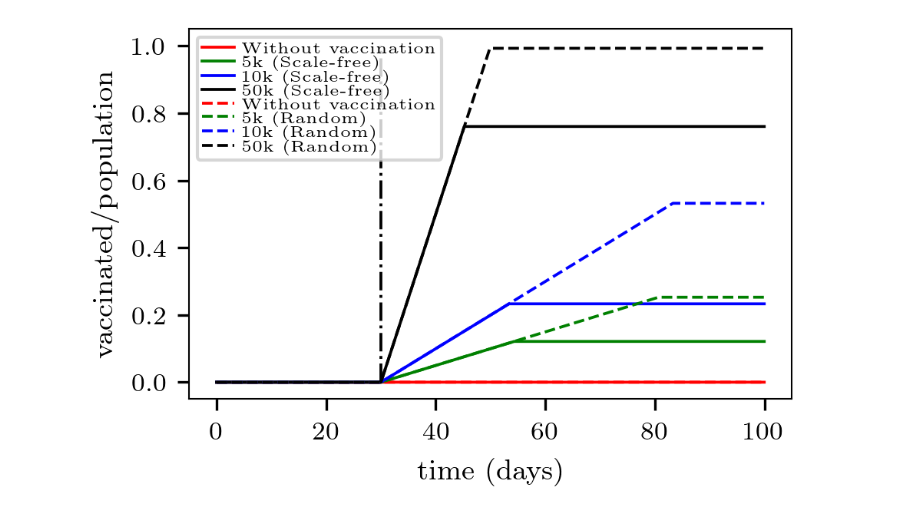
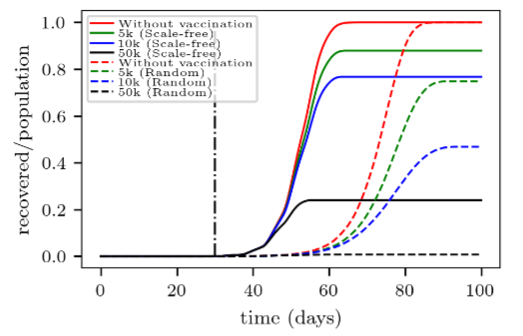
Fig. 6 completes the picture by showing the corresponding number of recovered individuals over time. It can be observed that the final effectiveness of the vaccination differs between the analyzed networks. For instance, applying 10,000 vaccines daily prevents 60% of the population from becoming infected in the random network, while this percentage drops to nearly 20% in the scale-free network (for the analyzed contagion probability).
4.2 Results for the Strategic vaccination process
So far, we have analyzed the effectiveness of the vaccination campaign for a somewhat “no matter how” procedure. A step forward in our investigation is considering the degree of connectivity of each individual. We therefore turn to a vaccination procedure targeting individuals according to their degree of connectivity in the network.
We idealize the community as belonging to the following categories: senior or young individuals. The former are presumed to attain fewer contacts than the latter, as already mentioned in Section 3.2. Thus, in the context of our model, we will associate for a while low-degree nodes to seniors and high-degree nodes to young people. However, we want to make clear that this is just a simplifying hypothesis, although more complex situations may appear in practice.
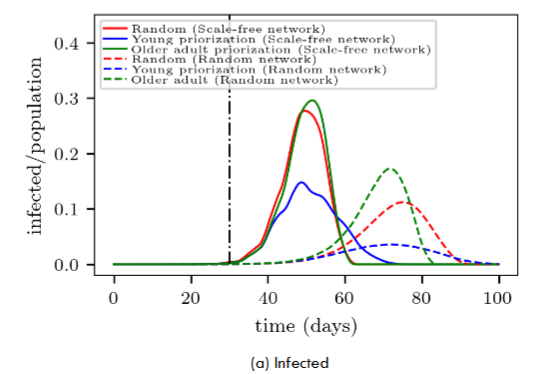
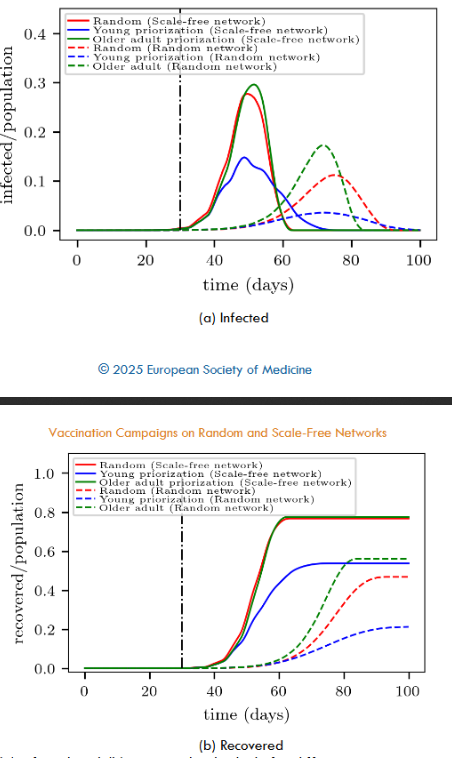
A first inspection of Fig. 8a shows that the vaccination campaign exhibits more “flattened” curves on the random networks (dashed lines) than on the scale-free networks (continuous lines) for the same priority strategy. This phenomenon was already present when analyzing the random vaccination process (see Section 4.1 for details). We observe that it remains present despite prioritizing seniors or youngers within the context of our model.
A closer examination of the random and scale-free networks in Fig. 8a shows that prioritizing younger people (blue lines) yields the most promising results (within the same kind of network). This means that starting the vaccination campaign on people attaining high-degree connectivity significantly improves the success of the campaign. The obvious reason is that vaccination gives immunity to highly connected people before the disease reaches them. However, not so obvious is that prioritizing younger people provides more time to vaccinate other larger portions of the population.
We emphasize that our hypothesis of associating low-degree nodes to seniors and high-degree nodes to youngers is quite ideal. There may exist in practice other reasons for prioritizing specific groups of individuals. However, from the logistic point of view, simply asking the age of the individual appears to be a feasible procedure.
Besides, a qualitative difference between the scale-free network and the random network can be noticed from Fig. 8a. The scale-free network does not show any significant difference between seniors priority and random vaccination. But this is not the case for the random network, where random vaccination somehow flattens the infection curve.
Fig. 8b confirms the above difference between the scale-free network and the random network. The former shows the same number of recovered individuals, regardless of proceeding with a seniors priority or a random vaccination. The latter, however, favors the random vaccination in comparison to seniors priority vaccination (say, by around 10% at the end of the campaign).
4.3 RESULTS FOR THE FAMILY VACCINATION PROCESS
The vaccination strategies discussed so far focus solely on individuals not considering the family social structure (see Section 2.2). We now turn our attention to vaccinating families based on their degree of connectivity, as defined at the end of Section 3.2.
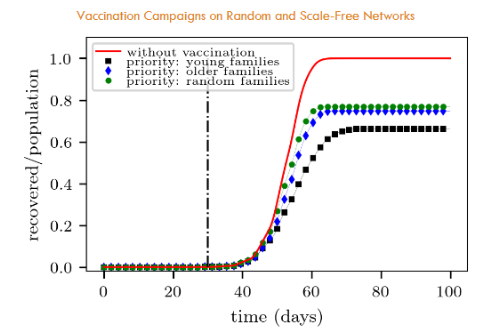
We can see in Fig. 9 that priority vaccination of younger families appears as the most promising strategy. This is in agreement with the results shown in Section 4.2.
5. Discussion
5.1 THE RANDOM VACCINATION PARADOX
We noticed in Section 4.1 that the “no matter how” vaccination strategy performs better in the scale-free network than in the random network. Fig. 6 served to illuminate this point by showing that the random vaccination strategy fails to reach many individuals before the disease catches them. This is the key point of the paradox.
Recall that in the scale-free networks, only a few nodes (i.e. hubs) attain an extremely high number of connections (k>100), while many nodes only achieve a small number of connections. However, the vaccination process of “no matter how” yields equal immunity to individuals regardless of their degree of connectivity. Thus, some hubs may not be reached on time by the vaccination campaign while the disease continues spreading easily throughout the network. This is not the case in the random network, where the degree does not exceed k≈10, and consequently, there is more time for people to become immune.
In summary, this paradox expresses a somewhat competitive dynamic between the disease propagation and the vaccination rate. The “no matter how” vaccination at a fixed daily rate ignores the underlying contact structure, and thus, may lose effectiveness whenever the disease is allowed to spread easily throughout the network. We illustrated this phenomenon by means of a scale-free environment.
5.2 WHO TO VACCINATE FIRST?
We explored in Section 4.2 the priority vaccination strategy, targeting individuals according to their degree of connectivity in the network. We associated low-degree nodes to seniors and high-degree nodes to youngers, as a simplifying hypothesis. We emphasized that, although this is quite ideal and more complex situations may exist in practice, it appears as a reasonable starting point for the analysis.
Fig. 8 showed that starting the vaccination campaign on young people significantly improves the success of the campaign, regardless of the type of network (random or scale-free). This is not in question within our context, but other arguments may come into discussion in practice.
The most controversial arguments might involve seniors priority. Fig. 8 shows that the random vaccination procedure is preferred to seniors priority in the context of random networks. Thus, there are not a priori reasons to implement a seniors priority strategy if the network suggests some kind of linking randomness. But, as mentioned above, other reasons (out of the scope of our model) may exist for insisting on prioritizing seniors.
The scale-free network does not show any significant difference between seniors priority and random vaccination. This point is quite relevant when planning a campaign. The planner may prioritize the seniors, missing that the disease shortcuts through those younger, acting as hubs. Instead, the planner should consider thoughtfully if the random scheme is worth the logistics.
We conclude this Section emphasizing that priority procedures exhibit promising results. However, these should be considered with care according to the environmental conditions. As a guideline, any successful strategy should prioritize individuals attaining high degrees, such as young people in our model. But the precise vaccination procedure may deal with issues out of our model.
5.3 IS THE FAMILY VACCINATION AN EFFECTIVE STRATEGY?
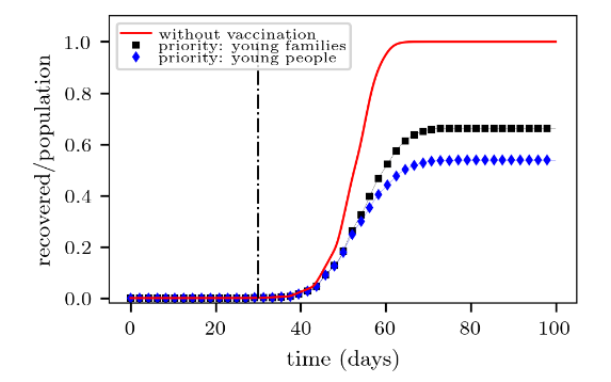
We noticed in Fig. 10 that the fraction of recovered people at the end of the campaign is slightly higher for the “young families” target than for the “young individuals” target. This means that the former yields a less effective campaign than the latter. Recall that recovered people are those who were not vaccinated at all.
The above results are quite understandable since young families are expected to include mostly young individuals. However, some young people may not belong to young families, but to senior families (in a small fraction, though). Thus, they may still propagate the disease easily. This is the reason why the “young families” vaccination appears in Fig. 10 slightly beyond the “young individuals” vaccination. Or in other words, the former is less effective than the latter.
The priority vaccination of “senior families” shows somewhat no difference with respect to “random families” vaccination (see Fig. 9). This is also in agreement with the corresponding results shown in Fig. 8b for individuals alone. Indeed, the argument given in Section 4.2 remains valid here, say, that the disease shortcuts through younger people (belonging to younger families), acting as hubs. The priority of “senior families” makes no significant difference from a random family vaccination.
We arrive at two major conclusions in this Section. First, that the priority vaccination of young families is preferred over senior families priority or random families vaccination (in the context of our model). Secondly, and not intuitive, that vaccinating (young) individuals alone expects a more promising campaign than vaccinating the young families.
We call attention (once more) to the fact that our model neither considers logistic features nor social reasons for evaluating the effectiveness of the vaccination campaign.
6. Conclusions
The investigation studies the spatial-temporal evolution of an infection (similar to COVID-19) from a microscopic point of view. We focus on the analysis of vaccination strategies on different network structures. Two main strategies were considered: (a) the random vaccination strategy, where vaccines are applied regardless of the network connectivity structure, and (b) the priority vaccination, which targets individuals (or families) according to their connectivity degree within the network.
We simulated random and scale-free networks for both kinds of strategies.
Our major conclusion is that prioritizing highly connected individuals (associated here with young people) appears as the most promising vaccination procedure within the context of our model. This is valid either for random networks or scale-free networks. We further noticed that prioritizing youngers not only slows down significantly the disease propagation, but also provides more time for the vaccination of other large portions of the population.
Whenever prioritizing highly connected individuals is not possible, we noticed that a random vaccination strategy is preferred with respect to prioritizing low-connected individuals (associated here to seniors). Random or “no matter how” vaccination does not actually have any advantage over seniors priority in scale-free networks. But it appears as a slightly more successful procedure in random networks.
We may feature a somewhat general rule from the above: the random vaccination is expected to be more effective in random networks, while targeted vaccination is expected to perform better in scale-free networks (according to our model). Thus, the campaign planner should analyze the nature of the connectivity structure and point to those highly linked individuals first.
Tailoring the vaccination procedures to target highly linked individuals is of paramount relevance when dealing with social groups. We compared a family-based procedure versus an individual-based procedure, prioritizing highly connected families or individuals, respectively (in the scale-free network). We noticed a loss of effectiveness in the former with respect to the latter. The reason is that highly linked families do not target all the highly linked individuals but a fraction of them. There is a remainder of highly linked individuals out of the highly linked families.
Our final conclusion concerns the planning of the vaccination campaign. A precise understanding of the underlying network structure allows for better tailoring of the vaccination strategy. However, our tailoring rule is limited to the scope of our model. Other issues may be relevant for the welfare of the population. Thus, the planner should thoughtfully weight our recommendations with those out-of-model arguments for the final decision.
Acknowledgments
C.O. Dorso is Superior Researcher at Consejo Nacional de Investigaciones Científicas y Técnicas (CONICET) and Chief Prof. at Depto. de Física-FCEN-UBA. G.A (retired). Frank is Adjoin Researcher at CONICET. F.E. Cornes is PhD researcher at FCEN-UBA.
References
- C. Heine, K. O’Keeffe, P. Santi, Travel distance, frequency of return, and the spread of disease, Sci Rep. 13, 14064 (2023).
- A. Medus, C. Dorso, Diseases spreading through individual based models with realistic mobility patterns., arXiv:1104.4913 [q-bio.PE] (2011).
- S. E. Eikenberry, M. Mancuso, E. Iboi, T. Phan, K. Eikenberry, Y. Kuang, E. Kostelich, A. B. Gumel, To mask or not to mask: Modeling the potential for face mask use by the general public to curtail the covid-19 pandemic, Infectious Disease Modelling 5, 293-308 (2020).
- X. Zhang, Y. Song, H. Wanga, G.-P. Jiang, Epidemic spreading combined with age and region in complex networks, Hindawi Mathematical Problems in Engineering 5 (2020).
- D. Barmak, C. Dorso, M. Otero, Modelling dengue epidemic with human mobility, Physica A 47 129-140 (2016).
- F. Cornes, G. Frank, C. Dorso, Covid-19 spreading under containment actions, Physica A: Statistical Mechanics and its Applications 588, 126566 (2022).
- F. Cornes, G. Frank, C. Dorso, Estrategia cíclica de aislamiento y actividad económica durante la pandemia covid-19., Anales AFA 31(4) (2021).
- Y. M. Bar-On, A. Flamholz, R. Phillips, R. Milo, Science forum: Sars-cov-2 (covid-19) by the numbers, eLife 9, e57309 (2020).
- R. Li, S. Pei, B. Chen, Y. Song, T. Zhang,W. Yang, J. Shaman, Substantial undocumented infection facilitates the rapid dissemination of novel coronavirus (covid-19), medRxiv (2020).
- J. Read, J. Bridgen, D. Cummings, A. Ho, C. Jewell, Novel coronavirus 2019-ncov: early estimation of epidemiological parameters and epidemic predictions, Philosophical Transactions of the Royal Society b: Biological Sciences 376, 376 (2021).
- X.-Y. Yan, C. Zhao, Y. Fan, Z. Di, W.-X. Wang, Universal predictability of mobility patterns in cities, Journal of The Royal Society Interface 11 (2013).
- D. Brockmann, L. Hufnagel, T. Geisel, The scaling laws of human travel., Nature 439, 462-465 (2006).
- M. González, C. Hidalgo, A. Barabási, Understanding individual human mobility patterns, Nature 453, 779-782 (2008).
- I. Rhee, M. Shin, S. Hong, K. Lee, S. Chong, On the levy-walk nature of human mobility., IEEE INFOCOM 2008 – The 27th Conference on Computer Communications, Phoenix, AZ, USA. 924-932 (2008).
- I. A. Perez, M. A. Di Muro, C. E. La Rocca, L. A. Braunstein, Disease spreading with social distancing: A prevention strategy in disordered multiplex networks, Phys. Rev. E 102 022310 (2020).
- L. Valdez, L. Braunstein, S. Havlin, Epidemic spreading on modular networks: The fear to declare a pandemic., Phys. Rev. E. 101 032309 (2020).
- M. Kuperman, G. Abramson, Small world effect in an epidemiological model., Phys. Rev. Lett. 86, 2909 (2001).
- H. Wearing, M. P. Rohani, Appropriate models for the management of infectious diseases., PloS Medicine 2(7) 0621–0627 (2005).
- K. A. Kabir, K. Kuga, J. Tanimoto, The impact of information spreading on epidemic vaccination game dynamics in a heterogeneous complex network, Chaos, Solitons and Fractals 132 109548 (2020).
- M. Shahzamal, B. Mans, F. d. Hoog, D. Paini, R. Jurdak, Vaccination strategies on dynamic networks with indirect transmission links and limited contact information, PLOS ONE 15 (11) 1–24 (2020).
- P. Erdôs, A. Rényi, On random graphs, Publ. Math. Debrecen 6 290-297 (1959).
- A.-L. Barabási, R. Albert., Emergence of scaling in random networks., Science 286 509-512 (1999).
- Albert, L. Barabási, Network Science 1st Edition, Cambridge University Press, (2016).
- A.-L. Barabási, E. Bonabeau, Scale-free networks., Scientific American 208(5) 60-69 (2003).
- M. Newman, Fast algorithm for detecting community structure in networks, Phys. Rev. E. 69, 066133 (2004).
- M. van den Heuvel, O. Sporns, Network hubs in the human brain., Trends in Cognitive Sciences 12(12) 683-696 (2013).
- M. Saberi, R. Khosrowabadi, A. Khatibi, B. Misic, G. Jafari, Topological impact of negative links on the stability of resting-state brain network, Scientific Reports 11(1) 269-271 (2021).
- S. Perera, M. Bell, M. Bliemer, Network science approach to modelling the topology and robustness of supply chain networks: a review and perspective, Applied Network Science 2, 33 (2017).
- D. Watts, S. Strogatz, A social network model based on caveman network, Nature 393(6684) 440-442 (1998).
- R. M. Anderson, R. M. May, Infectious diseases of humans, (Oxford University Press, Oxford, 1991) (1992).
- W. O. Kermack, A. G. McKendrick, A contribution to the mathematical theory of epidemics, Proc. R. Soc. Lond. A 115 (1927).
- D. H. Barmak, C. O. Dorso, M. Otero, H. G. Solari, Dengue epidemics and human mobility, Phys. Rev. E 84 (2011) 011901.
- F. Cornes, G. Frank, C. Dorso, Estrategia cı́clica de aislamiento y actividad económica durante la pandemia covid-19., Anales AFA 31(4) (2021).
- H. Benı́tez, F. Cornes, C. Dorso, G. Frank, Disease spreading through complex small world networks, Medical Research Archives 12 (8) (2024).
- Y. Wu, L. Kang, Z. Guo, J. Liu, M. Liu, W. Liang, Incubation period of covid-19 caused by unique sars-cov-2 strains: A systematic review and meta-analysis., JAMA Netw Open 5(8) e2228008 (2022).
- E. Bokányi, E. Heemskerk, F. Takes, The anatomy of a population-scale social network, Sci Rep 13 (9209) (2023).