


Canned Beans Enhance Nutrient Intake and Diet Quality
Replacing Protein Foods for Canned Beans Increases Shortfall Nutrient Intakes and Improves Diet Quality in Adults
Yanni Papanikolaou 1, Ava Papanikolaou 1, Joanne Slavin 2
- Nutritional Strategies, Nutrition Research & Regulatory Affairs, Kitchener, ON, Canada; [email protected]
- Nutritional Strategies, Nutrition Research & Regulatory Affairs, Kitchener, ON, Canada
- Department of Food Science and Nutrition, University of Minnesota, St. Paul, MN, USA
OPEN ACCESS
PUBLISHED: 30 September 2025
CITATION:PAPANIKOLAOU, Yanni; PAPANIKOLAOU, Ava; SLAVIN, Joanne. Replacing Protein Foods for Canned Beans Increases Shortfall Nutrient Intakes and Improves Diet Quality in Adults. Medical Research Archives. Available at: <https://esmed.org/MRA/mra/article/view/6993>.
COPYRIGHT: © 2025 European Society of Medicine. This is an open-access article distributed under the terms of the Creative Commons Attribution License, which permits unrestricted use, distribution, and reproduction in any medium, provided the original author and source are credited.
DOI: https://doi.org/10.18103/mra.v13i9.6993
ISSN 2375-1924
ABSTRACT
Background: Limited research has assessed nutrient and diet quality implications resulting from the replacement of protein-rich foods with canned beans.
Objective: The purpose of the present modeling analysis was to examine shortfall nutrient intakes and diet quality when isocalorically substituting protein foods with canned beans, including kidney beans, black beans, chickpeas, and pinto beans.
Methods: A modeling analysis was completed in free-living American adults using data from What We Eat in American 2001-2018, the dietary component of the United States National Health and Nutrition Examination Survey.
Results: The isocaloric substitution of protein foods with 1 and 2 servings of canned beans daily to the US typical dietary pattern significantly improved shortfall nutrient intakes. Intake of dietary fiber increased by 30% and 51%, respectively, with replacement of protein foods with 1 and 2 servings of canned beans, relative to the US typical dietary pattern (p<0.0001). Intake of iron, magnesium, potassium, and folate increased in the range of approximately 6-7% and 10-13% with replacement of protein foods with 1 and 2 servings of canned beans compared to the US typical dietary pattern (p<0.0001). Isocaloric substitution of protein foods with 1 and 2 servings of canned beans with the US typical dietary pattern led to 12% and 15% higher total Healthy Eating Index-2015 scores, respectively (p<0.0001).
Conclusions: Replacing commonly consumed protein foods with canned beans significantly increased shortfall nutrient intakes and improved diet quality. Greater canned bean consumption should be considered within future dietary recommendations as a strategy to promote nutrient intake shortfalls and improve deficits with current diet quality scores.
Keywords
canned beans; shortfall nutrients; diet quality; protein;
Introduction
Previous and current United States (US) Dietary Guidelines for Americans (DGA 2020-2025), have consistently encouraged greater consumption of beans within a defined healthy dietary pattern, due to the relatively low energy contribution and a high nutrient density profile. The recent release of the Scientific Report of the 2025 Dietary Guidelines Advisory Committee (2025 DGAC) further promotes greater bean consumption for Americans. Indeed, 2025 DGAC has been highly supportive of substitution or replacement of saturated fat-rich foods with a variety of plant-based foods, including plant-based protein-rich foods like beans, peas and lentils to reduce risk of cardiovascular disease. Beans of all varieties, including canned beans, represent a nutrient-dense food option to not only align with DGA 2020-2025 and 2025 DGAC recommendations, but also may help close gaps in meeting nutrient recommendations for nutrients of public health concern and overall shortfall nutrient intakes as identified by DGA 2020-2025 and previous dietary guidelines. For approximately 120 kcal, a 100 g serving of canned red kidney beans contains 9 g protein, 0.6 g total fat, 25 g carbohydrate, 8 g dietary fiber, 433 mg potassium, 50 mg magnesium, 311 mg sodium, 2 mg iron, and 39 µg folate, DFE. A recent panel of experts examining the evidence surrounding carbohydrate food quality reported fruits, vegetables, beans and other legume products had the highest quality carbohydrate scores. This is predominantly due to the contribution of greater dietary fiber and potassium levels and reduced amounts of sugar and sodium levels. Beans, peas, and lentils are unique foods in that they can be considered a part of the protein foods group as well as the vegetable group. DGA 2020-2025 has previously shifts are needed within the protein foods group to add variety and selecting from the seafood subgroup or the beans, peas, and lentils subgroup more often could help meet recommendations while still ensuring adequate protein consumption. Bean consumption in Americans remains minimal in American children and adults, with about 1 in 5 individuals at or above recommendations for beans, peas and lentils. Recent intake data show that beans, peas, and legumes are consumed in relatively small amounts, at an average of 0.1 cup eq/day and canned beans account for approximately 75% of units sold at US retail, outselling other forms by roughly 4:1. Concurrent to canned beans representing the majority of bean intake, limited evidence is available on the nutritional contribution of canned bean products in American dietary patterns. The consumption of canned and non-canned beans in American adults has been previously associated with reduced systolic blood pressure relative to non-consumers of beans, parallel to greater daily sodium intakes. Similarly, consumption of a variety of beans was significantly related to higher shortfall nutrient intakes, lower discretionary fat and added sugar intake, and improved weight-related variables, in comparison to non-bean intake. Recent analyses identifying bean dietary patterns of consumption in adults further demonstrated relationships with nutrient intakes, such that bean consumption was associated with higher intake of several shortfall nutrients, including dietary fiber, calcium, magnesium, potassium, iron, folate, and choline, when compared to non-bean consumption. Further, adults including beans as part of their typical dietary pattern had elevated total diet quality scores. Historical diet quality scores in US dietary patterns are well below authoritative recommendations, despite amassing data substantiating greater pulse, vegetables and fruit consumption to support diet quality and help promote longevity. A recent modeling analysis has further considered the implications of replacing pulses (i.e., canned and non-canned combined) for other foods routinely consumed in the DGA 2020-2025 recommended Healthy U.S.-Style Dietary Pattern. Indeed, adding approximately ¼ cup of pulses per day to replace one ounce per day of protein foods led to a nearly 14% increase in dietary fiber intake. Similarly, the addition of approximately ¼ cup of pulses per day to substitute for one ounce of refined grains led to substantial increases in several shortfall nutrients. While this work demonstrated numerous benefits associated with substitution of protein foods and grain foods with pulses within the recommended Healthy U.S.-Style Dietary Pattern, the analysis did not focus on benefits resulting from canned beans or how such substitution can have an impact on the US typical dietary pattern (i.e., a representation of how Americans typically consume foods and beverages) and total diet quality. As research is beginning to show numerous nutrient and diet quality benefits associated with various types of canned and dry bean consumption, limited data are available to assess the nutritional contribution of canned bean consumption alone in American dietary patterns. In particular, evaluating the shortfall nutrient intake and diet quality impact from substitution of routinely consumed protein foods with plant-based protein-rich foods in the typical US dietary pattern remains a void in the scientific literature. Thus, the purpose of the present modeling analysis focused on examining the isocaloric replacement of protein foods in the US typical dietary pattern with protein-rich canned beans to assess associations with shortfall nutrient intakes and diet quality in adults.
Methods
UNITED STATES NATIONAL HEALTH AND NUTRITION EXAMINATION SURVEY
The present modeling study represents a secondary analysis which used observational data from the United States National Health and Nutrition Examination Survey (NHANES), which is a continuous study directed by the Centers for Disease Control and Prevention (CDC). The NHANES dataset is a cross-sectional, nationally representative sample of free-living American individuals, of which includes infants, children and adult representation. Ethical protocols, including informed consent from study participants have been previously obtained, approved and documented by the CDC ethic boards. The current analysis amalgamated 9 NHANES datasets, thus spanning nearly 20 years of dietary recall data (i.e., NHANES 2001-2002, NHANES 2003-2004, NHANES 2005-2006, NHANES 2007-2008, NHANES 2009-2010, NHANES 2011-2012, NHANES 2013-2014, NHANES 2015-2016, and NHANES 2017-2018). Energy and nutrients assessed stem from the U.S. Department of Agriculture (USDA) Food and Nutrient Database for Dietary Studies (FNDDS) database for NHANES. The FNDDS databases determine food and beverage nutrient values in What We Eat in America (WWEIA), which represents the dietary intake component of NHANES. The collection procedure for WWEIA involves use of the Automated Multiple Pass Method (AMPM), representing a dietary collection tool that provides a valid, evidence-based approach for gathering data for national dietary surveys. Accuracy, effectiveness, and efficiency of the AMPM method has been comprehensively described and previously published.
STUDY PARTICIPANTS
Dietary recall data were obtained for individuals 19 years of age, with exclusions for incomplete data (N=44,574). Data interpreted to be reliable comprised completed 24-hour recalled dietary data. Pregnant and lactating females were not included in the analysis.
STATISTICAL AND MODELING ANALYSES
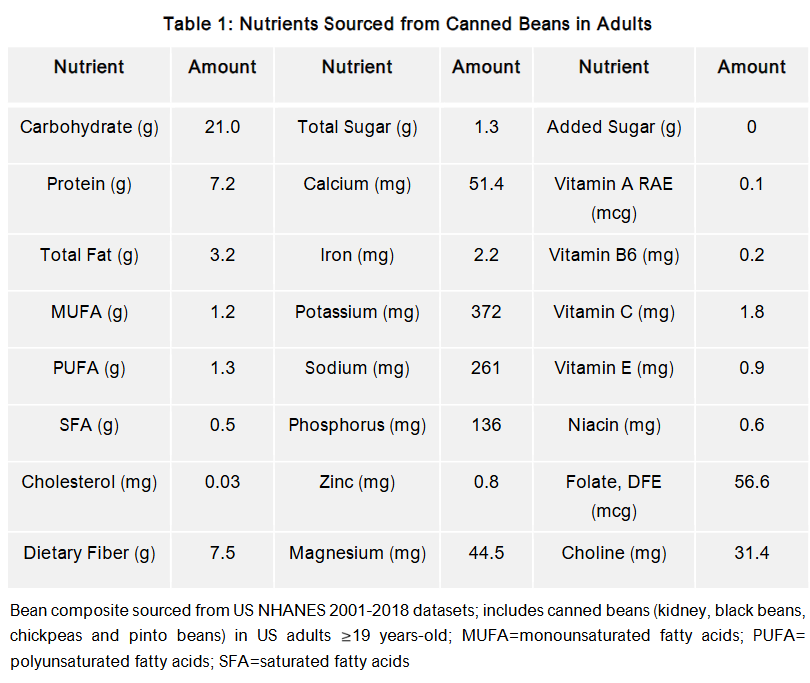
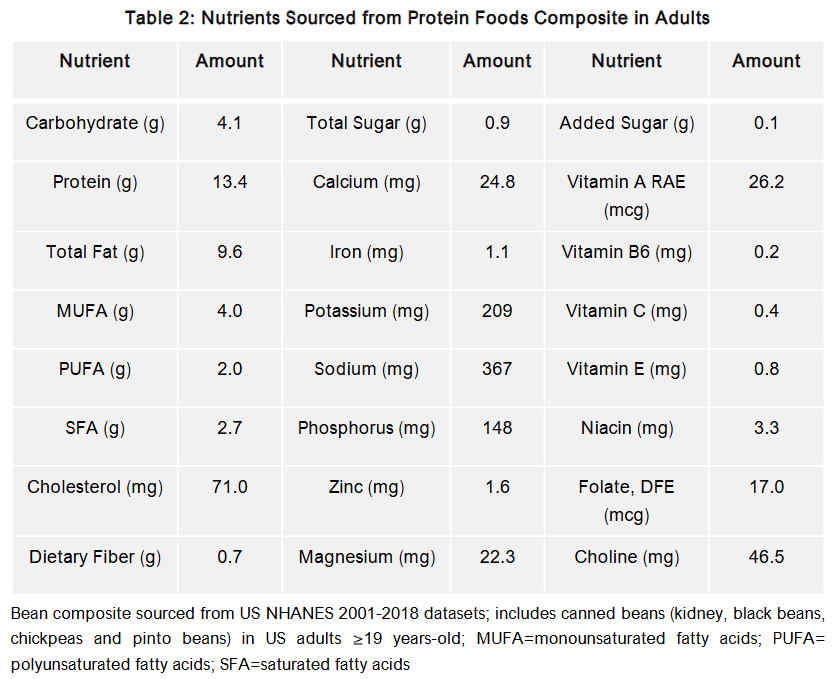
A canned bean composite based on all United States Department of Agriculture (USDA) identified canned bean foods from WWEIA 2001-2018 was used to determine energy and nutrient contribution from canned beans (see Table 1) and used to model replacement of protein foods into the typical US dietary pattern of adults. Canned beans were defined as USDA category 2802 with canned in the description notes. All refried beans listed by USDA were excluded from the analysis. The nutrient amounts for the canned bean composite were the weighted averages per reference amount customarily consumed (RAAC) summed overall all intakes in the bean definition category. Bean consumption included the principal type of canned beans routinely consumed by Americans and included kidney beans, black beans, chickpeas, and pinto beans, with exclusion of soybeans. Serving sizes were based on RAAC. Similarly, a protein foods composite based on all foods within the USDA protein foods category (i.e., meats, poultry, eggs, seafood, nuts, seeds and soy products) of WWEIA 2001-2018 was calculated and presented in Table 2. Diet quality was examined using USDA s Healthy Eating Index 2015 (HEI-2015) a validated dietary tool that measures conformance to US dietary guidance. Further details and strengths of the HEI-2015 diet quality scale remain well-documented and thoroughly reported within the scientific literature.
To complete our objectives, the United States Department of Agriculture (USDA) dietary modeling approach was used. The USDA s Food Patterns provide amounts of foods from the five major food groups and subgroups, including (1) Fruits; (2) Vegetables (dark green, red, and orange, beans and peas, starchy, and other); (3) Dairy (milk, cheese, yogurt, includes calcium-fortified soy beverages); (4) Grains (whole grains and refined grains); and (5) Protein Foods (meats, poultry, and eggs; seafood; nuts, seeds, and soy products). The USDA generates food item clusters of the defined food groups and then calculates energy and nutrient amounts that would be obtained by consuming different foods within each food group. The USDA then creates dietary patterns with the suggested levels of consumption of each food group/sub-group and confirms that the patterns meet the energy and nutrient needs for the various age groups within the American population. For the present analysis, the protocol made changes to the protein foods consumed (decrease other protein food amounts and increase bean consumption). The following modeling scenarios were used to determine, nutrient intakes and diet quality outcomes:
- Baseline: No modifications to the typical US dietary pattern (i.e., no isocaloric replacements of protein foods with canned beans)
- Model 1: Isocaloric replacement of 1 serving of protein foods with 1 serving of canned beans (i.e., ½ cup of canned beans) in the US typical dietary pattern to assess nutrient intakes
- Model 2: Isocaloric replacement of 2 servings of protein foods with 2 serving of canned beans (i.e., 1 cup of canned beans) in the US typical dietary pattern to assess energy and nutrient intakes
- Model 3: Isocaloric replacement of 1 serving of protein foods with 1 serving of canned beans (i.e., ½ cup of canned beans) in the US typical dietary pattern to assess total and sub-component diet quality scores
- Model 4: Isocaloric replacement of 2 servings of protein foods with 2 serving of canned beans (i.e., 1 cup of canned beans) in the US typical dietary pattern to assess total and sub-component diet quality scores.
Statistical Analysis System (SAS) software (Version 9.4, SAS Institute, Cary, NC, USA) was used to generate all statistical processes. The investigation used day 1 dietary survey weights to develop nationally representative estimates for all adults, along with adjustment for the complex sample design of the database. Covariate adjustments were not required since sample weights adjusted for typical demographic variables. Means (± standard errors (SE)) for daily energy, nutrient intakes and HEI-2015 total and sub-component scores were determined and t-tests were used to assess differences at baseline and all modeling analysis.
Results
CANNED BEAN ENERGY AND NUTRIENT COMPOSITE
Using canned bean data collected within NHANES, the identified canned bean composite contributed approximately 138.5 kcal (90 g serving). Table 1 presents the nutrients contributed from canned beans. The canned bean composite further demonstrates the nutrient density of canned beans, such that canned beans a significant source of several shortfall nutrients (i.e., magnesium, iron, dietary folate and choline) and three of the four DGAC nutrients of public health concern (i.e., dietary fiber, potassium, calcium). Canned beans also contribute negligible amounts of total sugar and no added sugar per 138.5 total calories, while concurrently being a substantial source of protein. While sodium contribution is elevated, the sodium to potassium ratio is greater than 1.0, thus, falling into recommendations set forth by the American Heart Association to add more potassium-rich foods to dietary patterns to blunt the effects of sodium.
PROTEIN FOODS ENERGY AND NUTRIENT COMPOSITE
The NHANES identified protein foods composite contributed approximately 157.3 kcal (68.6 g serving). Table 2 presents the nutrients contributed from all protein foods, without consideration for any bean products. The protein foods composite illustrates protein foods substantially contribute to intakes of protein and choline, but relative to canned beans, are lower in iron, potassium, magnesium and dietary folate. Protein foods also contribute greater amounts of monounsaturated, polyunsaturated, saturated and total fat compared to canned beans. Further, sodium contribution from the protein foods composite is greater than the canned beans composite, while potassium is greater in canned beans and lower in protein foods. This creates a sodium to potassium ratio in protein foods which is less than 1.0, thus, not meeting recommendations set forth by the American Heart Association.
ISOCALORIC SUBSTITUTION OF PROTEIN FOODS WITH CANNED BEANS IN THE US TYPICAL DIETARY PATTERN AND NUTRIENT INTAKES
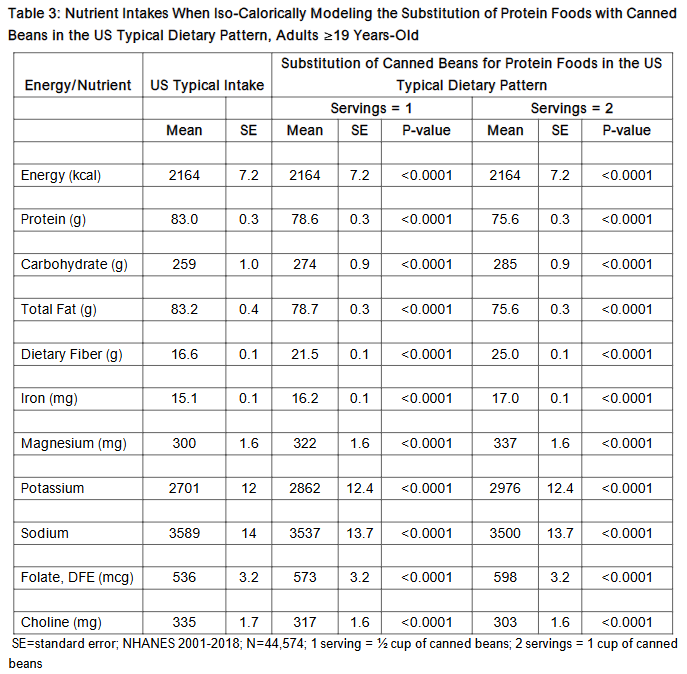
Modeling the isocaloric substitution of protein foods with the addition of beans to the diet significantly increased nutrients identified as nutrients of public health concern by dietary guidelines (See Table 3). Specifically, dietary fiber increased approximately 30% and 51% when protein foods were replaced with 1 and 2 serving of canned beans in the US typical dietary pattern (16.6±0.1 vs. 21.5±0.1 and 16.6±0.1 vs. 25.0±0.1, respectively; p<0.0001) when compared to the US typical dietary pattern consumed by adults. Similarly, potassium intake significantly increased approximately 6% and 10% when protein foods were replaced with 1 and 2 serving of canned beans in the US typical dietary pattern (2701±12 vs. 2862±12.4 and 2701±12 vs. 2976±12.4, respectively; p<0.0001). The isocaloric substitution of protein foods for canned beans in the US typical dietary pattern also resulted in significant improvements in DGA 2020-2025 shortfall nutrient intakes, including magnesium, iron, and folate DFE. Significant reductions in intake of protein, and total fat were also observed.
ISOCALORIC SUBSTITUTION OF PROTEIN FOODS WITH CANNED BEANS IN THE US TYPICAL DIETARY PATTERN AND DIET QUALITY
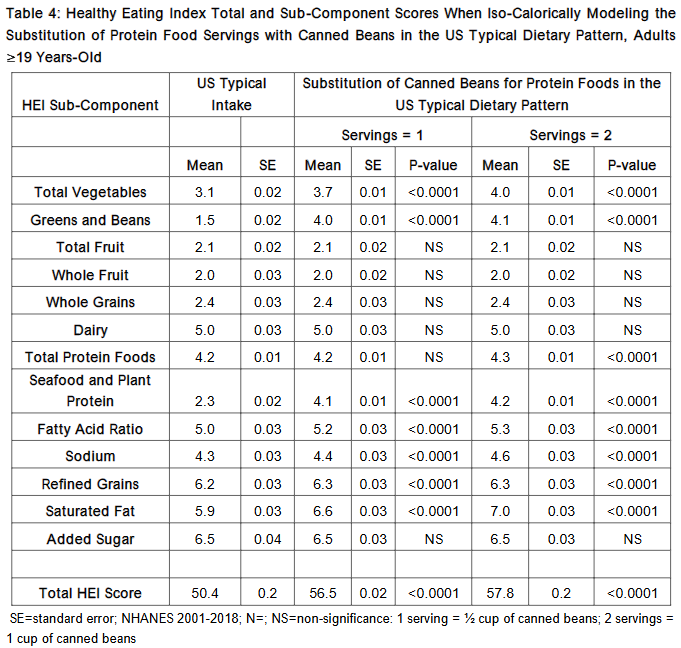
Modeling the substitution of protein foods with 1 and 2 servings of canned beans daily to the US typical dietary pattern significantly increased total diet quality, as assessed by USDA s HEI scale (Tables 4). Modeling the replacement of 1 serving of protein foods within the US typical dietary pattern with 1 serving of canned beans led to 12% higher total HEI score. Similarly, modeling the substitution of protein foods with canned beans resulted in a significant increase in total diet quality (i.e., 15% increase vs. baseline US typical dietary pattern). Overall, higher sub-component scores (i.e., greater consumption) in total vegetables, greens and beans, and seafood and plant proteins contributed to significantly better overall diet quality. Likewise, elevated scores (i.e., lower consumption) in sodium, refined grains and saturated fat further contributed to higher total diet quality scores.
DISCUSSION
The isocaloric replacement of protein foods with 1 and 2 servings of canned beans daily to the US typical dietary pattern significantly improved shortfall nutrient intakes. Intake of dietary fiber increased by 30% (4.9g per day) and 51% (8.4g per day), with replacement of protein foods with 1 and 2 servings of canned beans, respectively, relative to the US typical dietary pattern. As dietary fiber has been identified as a nutrient of public health concern by DGAs, the current modeling demonstrates the dietary fiber value contributed from canned beans as fewer than 1 in 10 US adults meet fiber recommendations to maintain optimal digestive health and prevent chronic diseases, including cardiovascular disease, diabetes, obesity and certain cancers. Our analysis further highlights the relevant influence canned beans portray in helping individuals close the gap on potassium intake shortfalls, especially with less than 5% of Americans meeting adequate intake. Like dietary fiber, potassium has been designated as a nutrient of public health concern. When replacing protein foods with 1 and 2 serving of canned beans in the US typical dietary pattern, potassium levels significantly increased by about 6 and 10%, respectively. The American Heart Association has previously stated foods with potassium can help control blood pressure by blunting the effects of sodium and the more potassium you eat, the more sodium you process out of the body. When considering other shortfall nutrients, intake of iron, magnesium, and folate increased approximately 7% and 13% with replacement of protein foods with 1 and 2 servings of canned beans compared to the US typical dietary pattern. Finally, modeling the isocaloric replacement of protein foods with 1 and 2 servings of canned beans daily to the US typical dietary pattern significantly increased total diet quality, such that, substituting 1 serving of protein foods with 1 and 2 servings of canned beans within the US typical dietary pattern led to 12% and 15%, respectively, higher total HEI score. The avoidance of beans within dietary patterns may lead to nutrient and public health consequences in adults and/or exacerbate current nutrient shortfalls. Dietary strategies involving the promotion of increased canned bean consumption within authoritative recommendations may prove favorable and help Americans improve overall health.
Declarations
ETHICS APPROVAL AND CONSENT TO PARTICIPATE:
Ethics approval/consents have been previously conducted via the Centers for Disease Control and Prevention and the Research Ethics Review Board at the National Center for Health Statistics.
CONSENT FOR PUBLICATION:
Not Applicable
AVAILABILITY OF DATA AND MATERIALS:
Publicly available US datasets were analyzed in the present study and can be found here https://wwwn.cdc.gov/nchs/nhanes. The NHANES datasets analyzed during the current study are available from the corresponding author on request.
COMPETING INTERESTS:
YP as President of Nutritional Strategies Inc. provides food, nutrition and regulatory affairs consulting services for numerous food and beverage companies and non-profit food associations and has collaborated with other researchers on NHANES analyses. JS is a Professor in the Department of Food Science and Nutrition, University of Minnesota and has current grants from Taiyo and Barilla in the area of dietary fiber, and also serves on the Scientific Advisory Boards for Tate and Lyle and Atkins Nutritionals and Sustainable Nutrition. YP and JS are active members of the Scientific Advisory Council for the Quality Carbohydrate Council in the United States. AP is a university student undergraduate intern at Nutritional Strategies Inc. and has no further declaration of interest.
FUNDING:
This research was funded by Cannedbeans.org on behalf of Bush’s Brothers & Company and the Coalition for the Advancement of Pulses.
References:
- US Department of Health and Human Services; U.S. Department of Agriculture. 2015 2020 Dietary Guidelines for Americans, 8th ed.; 2015. Available online: https://health.gov/our-work/food-nutrition/previous-dietary-guidelines/2015 (accessed on 28 May 2025).
- US Department of Agriculture; U.S. Department of Health and Human Services. Dietary Guidelines for Americans, 2020 2025, 9th ed.; 2020. Available online: https://www.dietaryguidelines.gov/sites/default/files/2020-12/Dietary_Guidelines_for_Americans_2020-2025.pdf (accessed on 28 May 2025).
- 2025 Dietary Guidelines Advisory Committee. 2024. Scientific Report of the 2025 Dietary Guidelines Advisory Committee: Advisory Report to the Secretary of Health and Human Services and Secretary of Agriculture. U.S. Department of Health and Human Services. (accessed on 27 May 2025).
- United States Department of Agriculture. Agricultural Research Service. FoodData Central Food Details. Kidney beans, from canned, no added fat – Nutrients – Survey (FNDDS) | USDA FoodData Central https://fdc.nal.usda.gov/food-details/2707383/nutrients (accessed on 21 March 2025).
- Comerford KB, Papanikolaou Y, Jones JM, Rodriguez J, Slavin J, Angadi S, Drewnowski, A. Toward an evidence-based definition of and classification of carbohydrate food quality: An expert panel report. Nutrients 2021;13, 2667 https://doi:10.3390/nu13082667.
- Drewnowski A, Maillot M, Papanikolaou Y, Jones JM, Rodriguez J, Slavin J, Angadi S, Comerford KB. A new carbohydrate food quality scoring system to reflect dietary guidelines: An expert panel report. Nutrients 2022;14, 1485 https://doi:10.3390/nu14071485.
- Comerford KB, Drewnowski A, Papanikolaou Y, Jones JM, Slavin J, Angadi S, Rodriguez J. Application of a new carbohydrate food quality scoring system: An expert panel report. Nutrients 2023;15, 1288 https://doi: 10.3390/nu15051288.
- US Department of Agriculture, Agricultural Research Service. Food Patterns Equivalents Intakes from Food: Mean Amounts Consumed per Individual, by Gender and Age, What We Eat in America, NHANES 2015-2016. 2018.
- Proprietary data calculated by Bush s Best and based in part on data reported by NIQ through its Syndicated database for the Bean category (branded only) for the Latest 52 weeks ending 4/29/23, for Total US xAOC (sales in the Food, Drug, Mass, Club, Dollar, and Military channels), according to the NIQ standard product hierarchy. Copyright © 2023, Nielsen Consumer LLC.
- Papanikolaou Y, Fulgoni VLF. Bean consumption is associated with greater nutrient intake, reduced systolic blood pressure, lower body weight, and a smaller waist circumference in adults: Results from the National Health and Nutrition Examination Survey 1999-2002. J Am Coll Nutr. 2008;27:569-576.
- Papanikolaou Y, Slavin J, Fulgoni VLF 3rd. Adult dietary patterns with increased bean consumption are associated with greater overall shortfall nutrient intakes, lower added sugar, improved weight-related outcomes and better diet quality. Nutr J. 2024;23, 36 https://doi:10.1186/s12937-024-00937-1.
- López-González L, Becerra-Tomás N, Babio N, Martínez-González M, Díaz-López A, Corella D et al. Variety in fruits and vegetables, diet quality and lifestyle in an older adult Mediterranean population. Clin Nutr. 2021;40:1510-1518.
- Zargarzadeh N, Mousavi S, Santos HO, Aune D, Hasani-Ranjbar S, Bagher Larijani B, Esmaillzadeh A. Legume consumption and risk of all-cause and cause-specific mortality: A systematic review and dose-response meta-analysis of prospective studies. Adv Nutr. 2023;14:64-76.
- Marventano S, Izquierdo Pulido M, Sánchez-Gonzalez C, Godos J, Speciani A, Galvano F, Grosso G. Legume consumption and CVD risk: A systematic review and meta-analysis. Public Health Nutr. 2017;20:245-254.
- Agarwal S, Fulgoni VLF III. Effect of adding pulses to replace protein foods and refined grains in healthy dietary patterns. Nutrients 2023;15, 4355 http://doi.org/10.3390/nu15204355
- US Centers for Disease Control and Prevention; National Center for Health Statistics; National Health and Nutrition Examination Survey. NHANES National Health and Nutrition Examination Survey Homepage. Available online: Cdc.gov (Accessed 17 April 2025).
- US Centers for Disease Control and Prevention; National Center for Health Statistics; National Health and Nutrition Examination Survey. NHANES National Health and Nutrition Examination Survey Homepage. Available online: Cdc.gov (Accessed 15 April 2025).
- US Department of Agriculture; Agricultural Research Service; Food Surveys Research Group. Food and Nutrient Database for Dietary Studies. Available online: https://www.ars.usda.gov/northeast-area/beltsville-md-bhnrc/beltsville-human-nutrition-research-center/food-surveys-research-group/docs/fndds-download-databases/ (Accessed 15 April 2025).
- Moshfegh AJ, Rhodes DG, Baer DJ, Murayi T, Clemens JC, Rumpler WV, Paul DR, Sebastian RS, Kuczynski KC, Ingwersen LA et al. The USDA Automated Multiple-Pass Method reduces bias in the collection of energy intakes. Am J Clin Nutr. 2008;88:324-332.
- National Cancer Institute, Division of Cancer Control & Population Sciences. Developing the Healthy Eating Index. Available online: https://epi.grants.cancer.gov/hei/developing.html (Accessed 22 April 2025).
- Krebs-Smith SM, Pannucci TE, Subar AF, Kirkpatrick SI, Lerman, JL Tooze JA, Wilson MM, Reedy J. Update of the Healthy Eating Index: HEI-2015. J Acad Nutr Diet 2018;118:1591-1602.
- Reedy J, Lerman JL, Krebs-Smith SM, Kirkpatrick SI, Pannucci TE, Wilson MM, Subar AF, Kahle LL, Tooze JA. Evaluation of the Healthy Eating Index-2015. J Acad Nutr Diet. 2018;118:1622-1633.
- 2020 Dietary Guidelines Advisory Committee and Food Pattern Modeling Team. Food Pattern Modeling: Ages 2 Years and Older. 2020 Dietary Guidelines Advisory Committee Project. U.S. Department of Agriculture; Washington, DC, USA: 2020. Available online: https://www.dietaryguidelines.gov/sites/default/files/2020-07/FoodPatternModeling_Report_2YearsandOlder.pdf (Accessed on 25 August 2025).
- American Heart Association. How Potassium Can Help Control High Blood Pressure. Available online: https://www.heart.org/en/health-topics/high-blood-pressure/changes-you-can-make-to-manage-high-blood-pressure/how-potassium-can-help-control-high-blood-pressure (Accessed 25 May 2025).
- Bailey RL, Parker EA, Rhodes DG, Goldman JD, Clemens JC, Moshfegh AJ, Thuppal SV, Weaver CM. Estimating sodium and potassium intakes and their ratio in the American diet: data from the 2011-2012 NHANES. J Nutr. 2015;146:745-750.
- Papanikolaou Y, Slavin J, Papanikolaou S, Fulgoni VL III (2024) Adding more beans to the US typical dietary pattern can lead to greater intake of shortfall nutrients and a higher diet quality in younger and older adults. Maturitas 2024;186, https://doi:10.1016/j.maturitas.2024.108012.
- Zargarzadeh N, Mohammad Mousavi S, Santos HO, Aune D, Hasani-Ranjbar S, Bagher Larijani B, Esmaillzadeh A. Legume consumption and risk of all-cause and cause-specific mortality: A systematic review and dose-response meta-analysis of prospective studies. Adv Nutr. 2023;14:64-76.
- Luhovyy BI, Mollard RC, Panahi S, Nunez MF, Cho F, Anderson GH. Canned navy bean consumption reduces metabolic risk factors associated with obesity. Can J Diet Pract Res. 2015;76:33-37.
- Doma KM, Dolinar KF, Ramdath DD, Wolever TMS, Duncan AM. Canned beans decrease serum total and LDL cholesterol in adults with elevated LCL cholesterol in a 4-wk multicenter, randomized, crossover study. J Nutr. 2021;151:3701-3709.
- Trichopoulou A, Costacou T, Bamia C, Trichopoulos D. Adherence to a Mediterranean diet and survival in a Greek population. N Engl J Med. 2003;348:2599-2608.
- Tsuzaki J, Maskarinec G, Mapa V, Shvetson YB, Park, S-Y, Monroe KR, Lim U, Le Marchand L, Boushey CJ. Diet quality and body mass index over 20 years in the multiethnic cohort. J Acad Nutr Diet. 2024;124:194-204.
- Tessier AJ, Wang F, Korat AA, Eliassen AH, Chavarro J, Grodstein F, Li J, Liang L, Willett WC, Sun Q, Stampfer MJ, Hu FB, Guasch-Ferré M. Optimal dietary patterns for healthy aging. Nat. Med. 2025; doi.org/10.1038/s41591-025-03570-5.
- Sundararajan K, Campbell MK, Choi Y-H, Sarma S. The relationship between diet quality and adult obesity: Evidence from Canada. J Am Coll Nutr. 2014;33:1-17.
- Papavagelis C, Avgeraki E, Augoulea A, Stamatelopoulos K, Lambrinoudaki I, Yannakoulia M. Dietary patterns, Mediterranean diet and obesity in postmenopausal women. Maturitas 2018;110:79-85.
- Ahluwalia N, Dwyer J, Terry A, Moshfegh A, Johnson C. Update on NHANES Dietary Data: Focus on Collection, Release, Analytical Considerations, and Uses to Inform Public Policy. Adv Nutr Int J. 2016;7:121-134.
- Grandjean AC. Dietary intake data collection: Challenges and limitations. Nutr. Rev. 2012;70:S101-S104.