


Using SpO2/FiO2 Ratio to Classify ARDS in ICU Patients
Classification of Acute Respiratory Distress Syndrome in Mechanically ventilated patients by using Oxygen saturation reading from pulse oximetry instead of partial pressure of Oxygen finding from Arterial Blood Gas report (used in Berlin definition): A prospective observational study
Umme Kulsum Chy 1, Mohammad Omar Faruq 2*, AKM Ferdous Rahman 3, Subroto Kumar Sarker 4, Mohammad Mohsin 5, MD Mozaffer Hossain 6
OPEN ACCESS
PUBLISHED: 31 December 2024
CITATION: CHY, Umme Kulsum et al. Classification of Acute Respiratory Distress Syndrome in Mechanically ventilated patients by using Oxygen saturation reading from pulse oximetry instead of partial pressure of Oxygen finding from Arterial Blood Gas report (used in Berlin definition): A pr. Medical Research Archives Available at: <https://esmed.org/MRA/mra/article/view/6060>.
COPYRIGHT: © 2025 European Society of Medicine. This is an open-access article distributed under the terms of the Creative Commons Attribution License, which permits unrestricted use, distribution, and reproduction in any medium, provided the original author and source are credited.
DOI: https://doi.org/10.18103/mra.v12i12.6060
ISSN 2375-1924
Abstract
Background & objective: Acute Respiratory Distress Syndrome (ARDS) is one of the leading causes of ICU admission and mortality. This study examined the clinical utility of the SpO2/FiO2 (SF ratio) as a substitution of PaO2/FiO2 (PF ratio) in diagnosis and classification of ARDS.
Design: It was a prospective observational study.
Setting: ICU of academic tertiary care government run hospital of Bangladesh.
Methods: All consecutive patients with ARDS on mechanical ventilator fulfilling the inclusion & exclusion criteria were included in the study. After diagnosis of ARDS as per Berlin definition (which uses PF ratio), PaO2 from arterial blood gas (ABG), SpO2 from pulse oximetry, and FiO2 from ventilator setting were documented at zero hour, at 24 hours and at 48 hours. All study patients were placed on PEEP ≥ 5 cm of H2O. SF ratio was calculated in all study subjects corresponding to PF ratio. The relationship between SF and PF were described by linear regression equation after being plotted in scatter plot diagrams to see their correlation. To find out cut off value of SF ratio against PF ratio, best fit method was used. As we did not have any mild ARDS patient, the study subjects were either moderate or severe ARDS based on Berlin classification.
Results: In this study a total of 50 mechanically ventilated adult ARDS patients were enrolled following eligibility criteria. In this study, cut off value of SF ratio was found to be 123 and 122 at zero hour and at 24 hours respectively against PF ratio of 110 (according to best fit linear relationship). A validity test showed PF 110 (not PF 100) had the best specificity among PF 95, PF 100 and PF 110 at zero hour and 24 hours. So, we accepted SF ≤ 123 (with PEEP ≥ 5 cm H₂O) as indicative of Severe ARDS. At zero hour and 24 hours as there was no SF value against PF 200. So, scatter plot correlation (best fit) was not applicable. However, using scatter plot diagram and linear regression equation the cut off value of SF ratio against PF 200 at 48 hours were calculated and the best fit value for SF was 214.91. With value above PF 200 corresponding SF value was calculated to be 235± 00 and 234.98 ± 10.73 at 24 hours and 48 hours respectively using mean ± SD. So, we accepted SF 235 as the cutoff value for PF 200 and we defined SF > 123 to ≤ 235 (with PEEP ≥ 5 cm H₂O) as indicative of Moderate ARDS.
Conclusion: In spite of having limitations in our study we conclude that like PF ratio as is used in Berlin definition, SF ratio can also be reasonably used to diagnose and classify mechanically ventilated ARDS (severe and moderate) particularly in a resource limited setting where ABG facility is scarce but pulse oximetry facility is abundant.
Keywords:
ARDS; PF ratio; SF ratio; SpO2; FiO2; PaO2
Introduction:
The acute respiratory distress syndrome (ARDS) is an acute diffuse, inflammatory lung injury, leading to hypoxemia and bilateral radiographic opacities, associated with decreased lung compliance. It is a life threatening clinical condition presenting in ICU and it affects both medical & surgical patients. It was first described by Ashbaugh et al in 1967 as adult respiratory distress syndrome to differentiate it from neonatal respiratory distress syndrome. Later “Adult” had been replaced by “Acute” that defined acute onset of symptoms.
Since 1967 several authors attempted to define this syndrome based on clinical presentation, severity, chest radiograph, & subsequently on PaO2/FiO2 (PF) ratio. In 1994 Bernard et al. classified it into acute lung injury (ALI) & ARDS, on the basis of PF ratio. In 2012 ARDS was again reclassified into mild, moderate & severe ARDS.
It affects 190,000 people yearly and is associated with 74,500 deaths in United States. Diagnosis of ARDS depends on analyzing arterial blood gas (ABG) and calculating the ratio between partial pressure of arterial O2 (PaO2) from ABG and the fraction of inspired O2 (FiO2) set on monitor of ventilator and it is called PF ratio. In acute phase of Acute Respiratory Distress Syndrome there are alveolar epithelial injury leading to influx of protein rich edema fluid into the alveolar air spaces. The alveolar space is the site of intense inflammatory and profibrotic reactions in the early phase of ARDS. The alveolar epithelial injury leads to alveolar flooding with exudative fluid, impairment of normal ion transport, impairment of removal of alveolar fluid. When this flooding is severe it often causes alveolar fibrosis. There are four phase in evolution of ARDS. They are exudative, proliferative, fibrotic and subsequently resolution phase.
Causes of ARDS can be direct or indirect. Common causes of direct injury are pneumonia, aspiration of gastric content and less commonly pulmonary contusion, fat emboli, near-drowning, and inhalation injury, reperfusion pulmonary oedema after lung transplantation or pulmonary embolectomy. Among the indirect causes of sepsis, severe trauma with shock are common whereas cardiopulmonary bypass, drug overdose, transfusion of blood products are less common.
To fulfill Berlin criteria diagnosis of ARDS requires acute onset of symptom, bilateral radiological infiltrate associated with hypoxemia & exclusion of other causes of respiratory failure. It requires ABG to calculate PF ratio which is an invasive procedure, may need repeated puncture of artery or placement of an arterial line. PaO2 is the partial pressure of oxygen in arterial blood, measured by ABG analysis. Measurement of PaO2 does not give direct information about the amount of oxygen carried by blood. It acts as a valid index of arterial oxygenation, because measurements are interpreted automatically with indirect assumption about arterial oxygen concentration.
Compared to ABG analysis Oxygen saturation measurement by pulse oximetry is a noninvasive continuously monitoring technique. Pulse oximetry plays a vital role in the monitoring and treatment of respiratory disease, guides the titration of supplemental oxygen, transport of unstable patient to hospitals or for any diagnostic procedure (CT scan, MRI, bronchoscopy, endoscopy etc.), and monitoring of oxygen status in emergency department. Factors that affect pulse oximetry measurement are low perfusion, dyshaemoglobinaemia (e.g. carboxyhaemoglobin, methaemoglobin), skin coloring, digital clubbing, nail polish, ill fitted probe, movement of patient, sensitivity to ambient light, sensor position, use of inotropes etc.
Main use of pulse oximetry in ICU involves detection of hypoxemia, prevention of hyperoxia, assisting in weaning from mechanical ventilation, and titration of FiO2.
In a healthy subject, changes in PaO2 correlate well with changes in SpO2 for oxygen saturation in the range of 80-100 %. We hypothesize that for early diagnosis of ARDS, SpO2 measurement may be an easy noninvasive substitute of PaO2, if FiO2 is known from ventilator set up or from amount of oxygen delivered by cannula, simple mask, rebreather mask, high flow nasal oxygen (HFNO) etc.
So SpO2 measurement by pulse oximetry may substitute the need for repeated ABG sampling, which is invasive and operator dependent procedure. So, pulse oximetry may reduce additional economic burden for patient in an ICU in resource poor setting where ABG analysis facility is limited or not feasible but pulse oximetry is widely available.
The relationship between SF and PF were assessed by Bilan, et al. in 2014, in a pediatric ICU admitted ARDS patients. This study showed SF 181 and 235 when simultaneous PF were 200 and 300 respectively. This study showed almost inverse relationship in comparison to the study done by Rice, et al. 2007. Thus, if SF correlated well with PF, it could be used in place of PF, was the conclusion of the study.
Several studies have demonstrated the use of pulse oximetry both in adult and pediatric ICU to observe the rationale of using SpO2, to predict or diagnose ARDS, compare the mortality of patient diagnosed by SF versus PF. Studies were also done to see the reliability of detecting hypoxia by pulse oximetry in pneumonia, ARDS, and trauma patients. Most of the studies showed positive correlation between SF and PF in mild and moderate ARDS but studies observing similar relationship between the two ratios in severe ARDS are rare.
Dhaka Medical College hospital (DMCH) in Bangladesh is a government run 1000 bed general hospital facility, where our study was done in its 20 bed ICU. We observed that all patients with diagnosis of ARDS admitted in DMCH ICU were of moderate or severe category as per Berlin definition. Our study was conducted to examine the correlation between SF based on pulse oximetry and PF based on ABG for diagnosis and classification of ARDS, and assess the feasibility of using SF to classify ARDS similar to PF being used for classifying in Berlin definition.
Materials and Method:
This was a prospective observational study done over a period of 12 months starting from 1st January 2016 to 31st December 2016. Prior to the study, written permissions were obtained from ethical review committee (ERC). Informed written and verbal consent were taken from first degree relative or legal guardian of study subjects in compliance with ERC.
A total of 61 consecutive patients were diagnosed as ARDS during study period. Of them 11 patients expired within 48hrs of admission. So, the final sample size was 50 patients and it was obviously much smaller compared to statistically calculated and required sample size of 384.
All adult mechanically ventilated patients (>18 years) admitted into study ICU who fulfilled the diagnosis of severe and moderate ARDS as per Berlin definition were examined at zero, 24 and 48 hours for study documentation and only those who survived beyond 48 hours were included in this study.
Patients with myocardial infarction, left ventricular failure, hemorrhagic shock, pregnancy, malignancy, hypotension from any cause with SBP < 80 mm of Hg were excluded from the study. Patients on mechanical ventilator with SpO2 > 95 and PEEP < 5 cm of water were also excluded from the study.
Instruments required to perform the study were data sheet addressing the demographic data, Pulse oximeter (CREATIVE hand held rechargeable model) for measuring SpO2, ABG analysis machine (Biotech International Model EDAN i15) for measuring PaO2, Mechanical ventilators of identical model with setting indicating FiO2 & PEEP.
Time of diagnosis of ARDS on admission or first diagnosis of ARDS after admission was labeled as zero hour of the study. PaO2 was documented from ABG analysis done at zero hour and at same time SpO2 was documented from pulse oximetry within five minutes of drawing arterial blood for ABG. For ABG analysis, arterial blood sample was drawn in heparinized tube by on duty physician using standard technique and aseptic precaution. At 24 hours and at 48 hours ABG sample was drawn for PaO2 determination and corresponding SpO2 was documented from pulse oximetry as was done at zero hour.
Collected data were processed and analyzed by using Statistical Package for Social Sciences (SPSS) software version 22. For the purpose of this study, PF and SF were calculated in all patients enrolled in the study. Descriptive statistics were used to summarize patient characteristics. Here categorical data were presented as frequency and percentage and numerical data were presented as mean and standard deviation. P-value less than 0.05 were considered statistically significant.
The categorical parameters were compared by X2 tests and continuous variables were compared by independent t test. The relationship between SF and PF were described by linear regression equation. Values of PF and SF were plotted in a scatter plot diagram to see their correlation. To find out cut off value of SF against PF, best fit method was used whenever needed. Sensitivity and specificity were calculated to see validity of SF for diagnosis of ARDS.
Results:
Among the fifty study patients the age ranged from 19 years to 70 years (Mean age ± SD = 42.42 ± 16.03). Male patients outnumbered females (31 vs 19). There were 33 medically ill patients. The rest were surgical and mostly trauma due to road traffic accident with injury to abdomen or head. Stroke was the leading morbidity of medical patients (n=5). Rest of medical patients were Guillain Barre Syndrome, acute pancreatitis, urosepsis, CNS infection, Diabetic Keto Acidosis, street poisoning etc. Distribution of significant co morbidities is shown in Figure 1.

Table 1 shows PaO2, SpO2, Positive end expiratory pressure (PEEP), SF, PF of study patients (n=50) at zero hour, 24 hours and 48 hours. It was observed that SF values increased with corresponding rise of PF values.
| At zero hour | At 24 hours | At 48 hours | |
|---|---|---|---|
| PaO2 from ABG | 73.67 ± 6.58 (55-86) | 80.60 ± 5.57 (65-90) | 85.61 ± 4.11 (78-92) |
| SpO2 from Pulse oximetry | 83.94 ± 5.63 (60-91) | 89.30 ± 4.07 (72-95) | 92.60 ± 2.28 (84-95) |
| FiO2 from Ventilator | 0.83 ± 0.67 (0.5-1.0) | 0.67 ± 0.15 (0.4-1.0) | 0.51 ± 0.13 (0.35-0.9) |
| PEEP from Ventilator | 8.83 ± 7.11 (6-14) | 7.11 ± 1.77 (5-12) | 6.40 ± 1.48 (5-14) |
| SpO2/ FiO2(SF) | 106.09 ± 28.75 (60-180) | 140.79 ± 36.76 (72-235) | 190.74 ± 42.84 (93.3-268.5) |
| PaO2/ FiO2(PF) | 93.44 ± 27.45 (55-172) | 127.20 ± 34.29 (65-217) | 176.68 ± 41.61 (86.6-254.3) |
Analyzing all the PF and SF data we found that most of the PF values at zero hour was around 100. Only two PF values were around 100 at 24 hours and there was no data on PF 100 at 48 hours. PF value around 200 was absent at zero hour and only one value was noted above 200 at 24 hour, rest of the values were noted at 48 hours. Table 2 shows Validity test of PF at different cut off value at zero hour and at 24 hours (n=50). Significant finding on this table is that specificity of PF 110 was 94.7 at zero hour and was significantly higher than specificity of PF 100 at zero hour which was 81.1. This finding supported the finding of SF 123.08 with corresponding PF110 at zero hour in Table 3.
| Cutoff value of PF | At zero hour | At 24 hours |
|---|---|---|
| 95 | 100.0 | 100.0 |
| 100 | 100.0 | 100.0 |
| 110 | 100.0 | 100.0 |
Figure 2 shows positive linear correlation between SF and PF 100 in a scatter plot diagram at zero hour. Most of the SF values were around PF 100. Dark circles indicate overlapping values. The equation derived from regression analysis was used to determine the cut off value of SF ratio for PF ratio of 100 at 0 hour. There was cluster of SF values around PF ratio of 100 at 0 hour, but no direct value against 100, so best fit method was applied to calculate the appropriate value of SF against PF 100, which showed value of 113.08 for SF.

Best fit method was also applied to calculate the appropriate value of SF against PF 110 as was done for SF against PF 100. SF value against corresponding PF110 at zero hour was found to be 123.38. Important finding in Figure 2 is that there was no PF value around 200 at zero hour. Table 3 shows calculated best fit SF value against PF value of 100 and 110 at zero hour and at 24 hours.
| PF | SF |
|---|---|
| 100 At 0 hour | 113.08 |
| 110 At 0 hour | 123.38 |
Table 4 shows number of moderate and severe ARDS cases (N=50) at zero hour using PF 100 in Berlin definition (with SF113.08) and using SF 123.38 in our study (with PF 110).
| Severe ARDS | Moderate ARDS | P value | |
|---|---|---|---|
| Using PF 100 & SF 113.08 at zero hour. | 37 | 13 | <0.001 |
| Using PF 110 & SF 123.38 at zero hour. | 38 | 12 | <0.001 |
Figure 3 shows positive linear correlation between SF with PF ratio of 100 in a scatter plot diagram at 24 hours. Dark circles indicate overlapping values. The equation derived from regression analysis calculated the cut off value of SF for PF 100 at 24 hours. For PF 100 at 24 hours, SF value was 112.19 and it was derived from SF calculation using the best fit linear relationship.

Table 5 shows validity test of SF at zero hour and at 24 hours (based on cut off value PF100 and PF110). It shows fairly equal sensitivity, specificity, positive predictive value (PPV) and negative predictive value (NPV) for both PF 100 and PF 110 (both at zero hour and 24 hours).
| SF for | Sensitivity | Specificity | PPV | NPV |
|---|---|---|---|---|
| PF 100 At 0 hour | 100.0 (93.3-100.0) | 100.0 (78.8-100.0) | 100.0 (93.3-100.0) | 100.0 (78.8-100.0) |
| PF 110 At 0 hour | 100.0 (93.3-100.0) | 100.0 (78.8-100.0) | 100.0 (93.3-100.0) | 100.0 (78.8-100.0) |
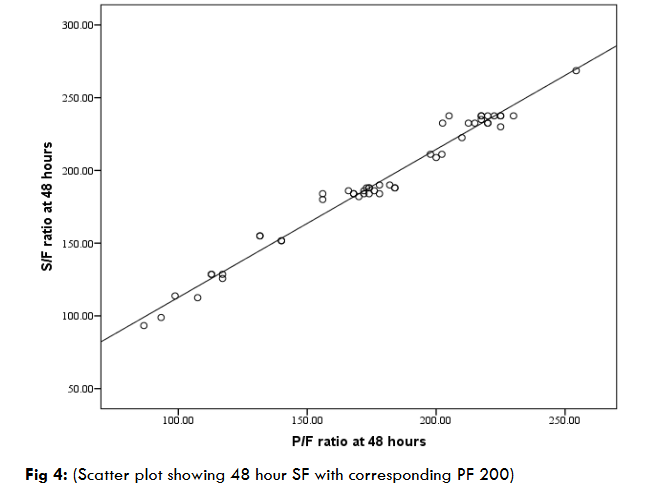
At zero hour and 24 hour as there was no SF value against PF 200 in our study. So scatter plot correlation (best fit) was not applicable. So, mean ± SD was used to calculate best values. With value above PF > 200, corresponding SF value was calculated to be 235 at 24 hours, and at 48 hour it was 234.98 ± 10.73. Figure 4 shows positive linear relationship between SF and PF 200 in a scatter plot diagram at 48 hours. Most of the SF data were scattered around PF 200. The equation derived from regression analysis calculated the cut off value of SF against PF 200 at 48 hours and the best fit value for corresponding SF was 214.91.
We did not have any subject of mild ARDS (as per Berlin definition). As there was no cut off value of SF against PF ratio of 300 we hypothesized SF > 235 as indicative of mild ARDS of Berlin definition.
| PF | Zero hour SF | 24 hours SF | 48 hours SF |
|---|---|---|---|
| 100* | 113.08 (Best fit) | 112.19 (Best fit) | × |
| 110* | 123.38 (Best fit) | 122.79 (Best fit) | × |
| ≤ 200 | × | 138.84 ± 34.50 | 165.85 ± 32.57 |
| ≥ 200 | × | 235.00 ± 0.00 | 234.98 ± 10.73 |
| 200* | × | × | 214.91 (Best fit) |
| 300 | × | × | >235 (Hypothesized) |
Table 8 shows comparison of Berlin classification of ARDS using PF with our study classification using SF.
| Classification of ARDS | BERLIN definition using PF ratio | Our Study using SF ratio |
|---|---|---|
| Severe | ≤ 100 mmHg with PEEP ≥ 5 cm H2O | ≤ 123 with PEEP ≥ 5 cm H2O |
| Moderate | >100 to ≤ 200 mmHg with PEEP ≥ 5 cm H2O | > 123 to ≤ 235 with PEEP ≥ 5 cm H2O |
| Mild | >200 to ≤ 300 mmHg with PEEP or CPAP ≥ 5 cm H2O | > 235 (Hypothesized) |
Discussion
Fifty moderate to severely ill ARDS mechanically ventilated adult patients were admitted into our study ICU. They were all diagnosed by using Berlin definition classification and were included as our study patients. In Figure 2, cluster of values of SF were observed mostly around PF 100 at zero hour. But there was no direct value of SF against PF 100. According to best fit linear relationship SF value against PF value of 110 at 0 and 24 hour were 123.38 and 122.79 respectively and SF value against PF value of 100 at zero hour and at 24 hours were 113.08 and 112.19 respectively. SF ratio of corresponding PF 100 and 110 showed essentially similar sensitivity, specificity, PPV & NPV at zero hour and 24 hours. But the specificity of PF 110 was found 94.7 at zero hour as opposed to specificity for PF 100 which was 81.1 at zero hour. This was why PF 110 was taken instead of a PF 100 to measure cut-off value of SF at zero hour to calculate severe ARDS in our study.
However, we also observed that using PF 100 and 110 at zero hour, we diagnosed 37 severe ARDS cases (consistent with Berlin definition) and 38 severe ARDS cases consistent with our study. We observed that there were cluster of values of SF at 48 hours for PF 200 but no SF value against PF 200 at zero and 24 hours. So only the best fit value of SF against PF 200 at 48 hours was calculated to be 214.91. At the same time, mean ± SD were calculated for the values above PF 200 and corresponding SF calculated at 24 hour was found to be 235 ± 0.00, and at 48 hours it was 234.98 ± 10.73. So SF 235 was taken as upper cut off value for moderate ARDS in our study corresponding to cutoff value of PF 200 which was used in Berlin definition.
Several studies have demonstrated the use of pulse oximetry both in adult and pediatric ICU to observe the rationale of using SpO2, to predict or diagnose ARDS, compare the mortality of patient diagnosed by SF ratio versus PF ratio. Studies were also done to see the reliability of detecting hypoxia by pulse oximetry in pneumonia, ARDS, and trauma patients. Bilan, et al. in 2015 enrolled 105 children in their study with 56 female patients (53.3%) and 49 male patients (46.7%) with a mean age of 33± 6 months. In this study on ALI cases SF cut off of 235 had 57% sensitivity and 100% specificity and on ARDS cases SF cut off of 181 had 71% sensitivity 82% specificity. This study showed SF 181 and 235 when simultaneous PF were 200 and 300 respectively. Thus this study concluded that if SF ratio correlates well with PF ratio, it could be used in place of PF ratio.
In adult patients, Rice et al. in 2007 reported that cut-off value 235 for SF could predict ARDS with 85% sensitivity and 85% specificity while a cut-off of 315 for SF could predict ALI with 91% sensitivity and 56% specificity. They measured PaO2 and SpO2 in maximum 5 minutes apart. The SF ratio thresholds determined in this study were based on the PF ratio which was proposed by American European Consensus Conference.
Pandharipande et al. in 2009 evaluated the contribution of positive end expiratory pressure (PEEP) on the relation between SF and PF. According to the authors PEEP did not affect SpO2 and PaO2 and PEEP may impact PF ratio by improving ventilation perfusion matching. Their model didn’t incorporate covariates such as hemoglobin, age, comorbid illnesses, smoking history, body mass index and positioning of patient. They related the respiratory and SOFA scores obtained with imputed SF values with that of the respiratory and SOFA scores using PF ratios. They showed a linear regression describing association between SF and PF. But no cut off value of SF was calculated for a PF value.
A study was conducted by Khemani et al in 2014, on pediatric population. The study observed that a cut-off of SF 201 could predict PF for ARDS with 84% sensitivity and 78% specificity while a cut-off of SF 263 could predict ALI with 84% sensitivity and 78% specificity. The authors did not find cut off value for SF at PF 100.
A prospective cohort study done under the auspices of the US Critical Illness and Injury Trials Group (USCIITG) evaluated ability of SpO2/ FiO2 values for early reliable independent predictor of ARDS development, recorded within 6 hours of the ICU admission. The group used SF cutoff same way as PF (<100, <200, <300). Their study observed that those presenting with the lower SF values seemed to have earlier onset of ARDS in the hospital and trend toward earlier death, compared to those with higher SF values on admission.
In 2016 Riviello et al reported the concept of Kigali modification of Berlin definition while diagnosing 42 patients with ARDS using PF ratio ≤ 315 and requirement of SPO2 ≤ 97% using pulse Oximetry. It was a prospective observational study (done in March 2014) at a referral hospital of Kigali, Rwanda, Africa. All study patients had bilateral chest opacity by chest X ray or by ultrasound Out of the study patients 21 of them received mechanical ventilation and using PEEP was not mandatory to diagnose ARDS.
At the time of our study (done in 2016) we were not aware of Kigali modification of Berlin definition which was intended for resource constrained settings. Kigali modification was a single centered study and has still not received full validity.
In 2022 Wick et al recommended adoption of SF ratio as a formal diagnostic alternative to PF ratio for the hypoxemic criterion in adult ARDS. According to this study, when SF ratio was near a threshold severity value or the accuracy of pulse oximeter was in doubt, or SF ratio or clinical picture seemed discordant, a confirmatory ABG analysis might be needed. This study also stressed that for accurate diagnosis and risk stratification, SF ratio should be calculated when SPO2 was 97% or less.
According to a New Global Definition which was proposed in 2023, there are three categories of criteria applied to specific ARDS cases: a) Non- intubated ARDS (for patients on High Flow Nasal Oxygen (HFNO) or NIV/CPAP). b) Intubated ARDS and c) Modified definition ARDS for resource limited settings (partly using Kigali modification). For intubated ARDS patients if PF ratio is not used as in Berlin definition and if pulse oximetry is used instead, NGD proposed the criteria showing comparison with similar criteria in our study. It is worth noticing that NGD while describing intubated patients does not specifically mention use of mechanical ventilation. NGD also requires PEEP ≥ 5 cm H2O only for severe ARDS patients and like our study cases (SpO2 ≤ 95) it imposes restriction of SpO2 ≤ 97% on all groups of ARDS patients. One interesting similarity which is not explainable is the upper cut off value of SF 235 which is found in moderate ARDS group both in our study and NGD.
Conclusion
Our study concludes that in resource limited setting like Bangladesh or countries of low economic status where pulse oximetry is easily available but ABG analysis facility is limited particularly in low cost ICUs, SF ratio (based on pulse oximetry) can reasonably be used instead of PF ratio (ABG based as in Berlin definition) to diagnose and classify ARDS patients on mechanical ventilation as either moderate or severe.
Limitation and Recommendation:
This single center study sample of 50 patients on mechanical ventilator was too small to represent large reference population in a south Asian country like Bangladesh. A multicenter study involving much larger subjects could make such study more credible. This statement also equally applies to New Global Definition of 2023 discussed above. Our study would get more credibility if we could observe correlation between SF and PF using variables like age, sex, race, tidal volume and PEEP etc. Future multi-center study involving several countries with large heterogeneous population using different covariates is highly recommended.
Conflict of Interest:
None
Funding:
Self- funded.
Author Contribution:
Study Design: UKC, MMH, MOF
Data Collection: UKC, SKS, MM
Manuscript writing and statistical analysis: UKC, MOF
Manuscript editing: MOF
References
- Ashbaugh D, Bigelow DB, Petty T, Levine B. Acute respiratory distress in adults. The Lancet. 1967 Aug 12;290(7511):319-23.
- Ware LB, Matthay MA. The acute respiratory distress syndrome. New England Journal of Medicine. 2000 May 4;342(18):1334-49.
- Bernard GR, Artigas A, Brigham KL, Carlet J, Falke K, Hudson L, Lamy M, Legall JR, Morris A, Spragg R. The American-European Consensus Conference on ARDS. Definitions, mechanisms, relevant outcomes, and clinical trial coordination. Am J Respir Crit Care Med. 1994 Mar;149(3 Pt 1):818-24.
- Ferguson, ND, Fan, E, Camporota, L, et al. The Berlin definition of ARDS: an expanded rationale, justification, and supplementary material. Intensive Care Med 2012;38:1573-1582
- Force AD, Ranieri VM, Rubenfeld GD, Thompson B, Ferguson N, Caldwell E, Fan E, Camporota L, Slutsky AS. Acute respiratory distress syndrome. Jama. 2012 Jun 20;307(23):2526-33.
- Pugin J, Verghese G, Widmer MC, Matthay MA. The alveolar space is the site of intense inflammatory and profibrotic reactions in the early phase of acute respiratory distress syndrome. Critical care medicine. 1999 Feb; 27(2):304-12.
- Thompson BT, Chambers RC, Liu KD. Acute respiratory distress syndrome. New England Journal of Medicine. 2017 Aug 10; 377(6):562-72.
- Sanz F, Dean N, Dickerson J, Jones B, Knox D, Fernández‐Fabrellas E, Chiner E, Briones ML, Cervera Á, Aguar MC, Blanquer J. Accuracy of PaO2/FiO2 calculated from SpO2 for severity assessment in ED patients with pneumonia. Respirology. 2015 Jul; 20(5):813-8.
- Bilan N, Dastranji A, Behbahani AG. Comparison of the SpO2/FiO2 ratio and the PaO2/FiO2 ratio in patients with acute lung injury or acute respiratory distress syndrome. Journal of cardiovascular and thoracic research. 2015; 7(1):28.
- Rice TW, Wheeler AP, Bernard GR, Hayden DL, Schoenfeld DA, Ware LB, Network AR, National Institutes of Health. Comparison of the SpO2/FiO2 ratio and the PaO2/FiO2 ratio in patients with acute lung injury or ARDS. Chest. 2007 Aug 1; 132(2):410-7.
- Khemani RG, Patel NR, Bart III RD, Newth CJ. Comparison of the pulse oximetric saturation/fraction of inspired oxygen ratio and the PaO2/fraction of inspired oxygen ratio in children. Chest. 2009 Mar 1;135(3):662-8
- Khemani RG, Thomas NJ, Venkatachalam V, Scimeme JP, Berutti T, Schneider JB, Ross PA, Willson DF, Hall MW, Newth CJ. Pediatric Acute Lung Injury and Sepsis Network Investigators (PALISI). Comparison of SpO2 to PaO2 based markers of lung disease severity for children with acute lung injury. Crit Care Med. 2012 Apr; 40(4):1309-16.
- Wilson BJ, Cowan HJ, Lord JA, Zuege DJ, Zygun DA. The accuracy of pulse oximetry in emergency department patients with severe sepsis and septic shock: a retrospective cohort study. BMC emergency medicine. 2010 Dec; 10(1):1-6.
- Spada C, Gandhi R, Patel SR, Nuccio P, Weinhouse GL, Lee PS. Oxygen saturation/FIO2 ratio is a simple predictor of noninvasive positive pressure ventilation failure in critically ill patients. Journal of critical care. 2011 Oct; 26(5):510.
- Pandharipande PP, Shintani AK, Hagerman HE, St Jacques PJ, Rice TW, Sanders NW, Ware LB, Bernard GR, Ely EW. Derivation and validation of SpO2/FiO2 ratio to impute for PaO2/FiO2 ratio in the respiratory component of the Sequential Organ Failure Assessment (SOFA) Score. Critical care medicine. 2009 Apr; 37(4):1317.
- Khemani RG, Rubin S, Belani S, Leung D, Erickson S, Smith LS, Zimmerman JJ, Newth CJ. Pulse oximetry vs. PaO2 metrics in mechanically ventilated children: Berlin definition of ARDS and mortality risk. Intensive care medicine. Jan 2015; 41(1):94-102.
- Festic, E., Bansal, V., Kor, D. J., & Gajic, O. SpO2/FiO2 Ratio on Hospital Admission Is an Indicator of Early Acute Respiratory Distress Syndrome Development Among Patients at Risk. Journal of Intensive Care Medicine, 2013; 30(4), 209–216.
- Riviello ED, Kiviri W, Twagirumugabe T, Mueller A, Banner-Goodspeed VM, Officer L, Novack V, Mutumwinka M, Talmor D, Fowler R. Hospital incidence, and outcomes of the acute respiratory syndrome using the Kigali Modification of the Berlin definition. Am J Resp Crit Care Med. Jan 1926; 193(1); 52-59.
- Lazeri C, Peris A. The Kigali modification of the Berlin definition: a new epidemiological tool for ARDS? J Thorac dis 2016: 8(6): E 443-E 445.
- Wick KD, Matthay MA, Ware LB. Pulse Oximetry for the diagnosis and management of acute respiratory distress syndrome. Lancet resp. Medicine. Nov 2022; 10 (11):1086-1098.
- Mathay MA, Arabi Y, Arroliga AC, Bernard G, Bernstein AD, Brochard LJ, Calfee CS et al. A new global definition of Acute Respiratory Distress Syndrome. Am J of Resp Crit Care Med. Jan 2024: 209 (1): 37-47.