


Inertia-Driven Mitral and Aortic Valves: The Isovolumic Myth
Inertia-Driven Mitral and Aortic Valves: The Isovolumic Myth
ABSTRACT
Background: For the past century, the Wiggers Diagram has been universally taught as defining the phases of the cardiac cycle. However, the concepts underlying this diagram have never been critically tested and remain largely unexamined.
Methods: In this study, the authors examined how the left ventricular and aortic valves interact during the cardiac cycle using high-frequency sampling of left ventricular and aortic pressures in a series of 30 instrumented porcine hearts.
Results: The data indicate that the left ventricular pressure rises and falls in a manner that is not consistent with the traditional Wiggers Diagram. The first elevation of intraventricular pressure is not followed by valve closure as previously thought.
Conclusion: This study challenges the traditional understanding of the mitral valve closure. The findings suggest that the mechanics of the heart are more complex than previously understood.
Keywords
Wiggers Diagram, mitral valve, aortic valve, cardiac cycle, left ventricular pressure
Introduction
In his landmark paper, published a century ago, Dr. Carl Wiggers proposed what has become the classic phases of the cardiac cycle, depicted in the now ubiquitous “textbook” Wiggers Diagram.
During the first phase of ventricular systole, the a-v valves have been partly floated into apposition, probably in consequence of the sudden cessation of a jet when the peak of the intra-auricular pressure curve is reached about the middle of auricular systole. The first elevation of intraventricular pressure finally closes these valves. Dr. Wiggers himself proposed that “As soon as intraventricular pressure begins to rise, the auriculo-ventricular valves close.”
Methods
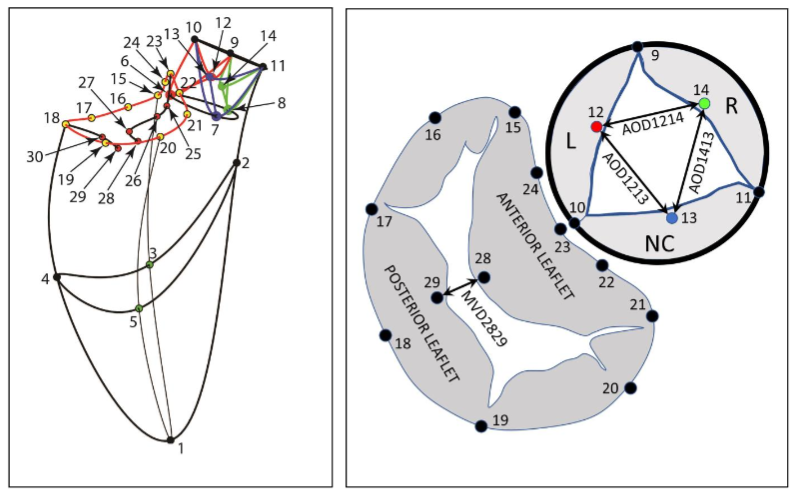
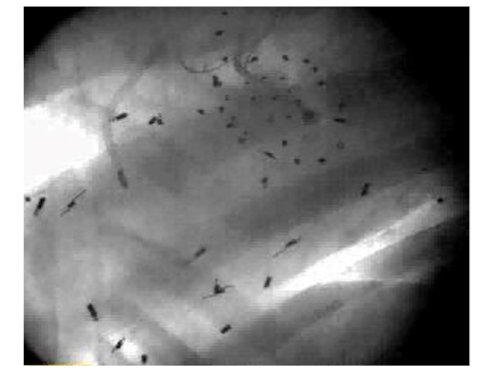
One week later, the animals were taken to the cardiac characterization laboratory where simultaneous biplane videofluoroscopic data from a sheep heart were acquired at end-expiration with the hearts in normal diastole. Figure 2 shows an example of biplane videofluoroscopic data from a sheep heart.
Data Analysis
The 4-D coordinates of all markers were reconstructed using biplane videofluoroscopy. The mean distance between the markers was computed from the 3D vector constructed from this experiment.
Results
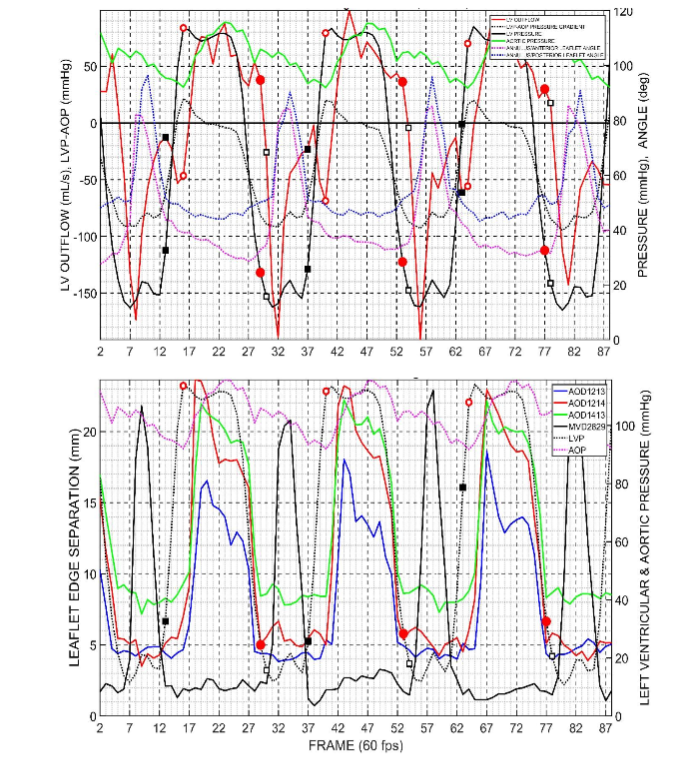
In Figure 3, the left ventricular pressure (LVP) is shown. Left ventricular flow (positive, outflow), left ventricular pressure difference (LVP-AoP), dotted black line. Anulus/Anterior mitral leaflet angle (23-18-29), dotted magenta line.
Discussion
The Group mean maximum left ventricular pressure observed throughout these periods. In this paper we will continue to test these volume changes.
Wiggers’ postulate that the first elevation of intraventricular pressure finally closes the a-v valves is not supported by the present results.
Conclusion
In conclusion, if, as taught in current courses and textbooks based on the Wiggers Diagram, pressure difference reversals controlled the valves, then valve closing should be quite abrupt. But these data show we did not observe this.
Conflicts of Interest Statement
Dr. Jensen and Dr. Ingels reported no conflicts of interest to declare.
References
- Wiggers CJ. Studies on the converse phases of the aortic root: modes and physiological determinants. Am J Physiol. 1921; 64:415-438.
- Dagum P, Green GR, Nistal FJ, et al. Deformational dynamics of the aortic root: modes and physiological determinants. Circulation. Nov 9 1999;100(suppl II):I-1642.
- Cheng A, Dagum P, Swanson J, et al. Aortic root dynamics and surgery: from cancer to science. Phil Trans R Soc B. 2007;362:1407-1419.
- Barbosa V, Kvitling JP, Swanson J, et al. Effects of diastolic dysfunction on left ventricular dynamics. J Thorac Cardiovasc Surg. May 2010; 139: 118-124.
- Jensen MO, Lemmon JD, Gessaghi VC, Conrad CP, Levine RA, Yoganathan AP. Harvested porcine mitral xenograft fixation: impact on diastolic dynamic performance. J Heart Valve Dis. Jan 2001;10(1): 111-124.
- Jensen H, Jensen MO, Smereuk MH, et al. Impact of papillary muscle relocation as adjunct procedure to mitral ring annuloplasty in functional ischemic mitral regurgitation. Circulation. 2010;121(1): 818-833.