


Examining Social Outcome Probability Bias in Anxiety
Examining Types of Social Outcome Probability Bias: Confirmatory Factor Analysis of the Outcome Probability Task
Madeline Rech1, Amanda A. Draheim2, Page L. Anderson1
- Goucher College Psychology Department, Baltimore, MD, USA
OPEN ACCESS
PUBLISHED: 31 October 2025
CITATION: RECH, Madeline; DRAHEIM, Amanda A.; ANDERSON, Page L.. Examining Types of Social Outcome Probability Bias: Confirmatory Factor Analysis of the Outcome Probability Task. Medical Research Archives, [S.l.], v. 13, n. 10, oct. 2025. Available at: <https://esmed.org/MRA/mra/article/view/6948>. Date accessed: 09 nov. 2025. doi: https://doi.org/10.18103/mra.v13i10.6948.
DOI: https://doi.org/10.18103/mra.v13i10.6948
ISSN 2375-1924
Abstract
Background: Outcome probability bias in the context of social anxiety is the tendency to overestimate the likelihood of negative evaluation and contributes to the etiology and maintenance of symptoms. Research shows that reductions in outcome probability bias may be key for therapeutic improvement, yet it has historically only been measured as a unitary construct. Assessments have nearly exclusively involved self-report questionnaires consisting of verbal descriptions of social situations. The recently developed Outcome Probability Task uses pictures of social situations to assess outcome probability bias. An exploratory factor analysis previously suggested three factors: Performance situations, social gatherings, and probable judgment based on facial expressions. These factors may reflect the dimensionality of outcome probability bias, with potential to enhance assessment and treatment practices. The goal of this research was to evaluate the stability of a three-factor structure and compare it to alternative models within a new sample.
Methods: Participants (N = 283; Mage= 21.06, SD = 6.08) were predominantly students, who reported diverse sociodemographic identities and psychological characteristics. They completed the ePrime-administered Outcome Probability Task, which prompts respondents to imagine they are about to encounter the social situation shown, and rate the likelihood of being negatively judged.
Results: Fit indices and factor loadings from confirmatory factor analyses indicated that the hypothesized three-factor model is superior to the alternative models tested. Fit metrics were as follows: χ2/df = 2.34, (p < .001); Comparative Fit Index = 0.92; Tucker-Lewis Index = 0.91; Root Mean Square Error of Approximation = 0.07 (p < .001); Standardized Root Mean Squared Residual = 0.06. Factor loading estimates were acceptable (≥ 0.7) and ranged from 0.59 to 0.89 (p < .001). Covariance estimates between factors ranged from 0.55 to 0.73 (p < .001).
Conclusions: The Outcome Probability Task can examine subtypes of probability bias that may reflect differential anticipatory social fears. Findings provide additional support that the Outcome Probability Task is a tool that can be used to engage in the multi-method assessment of social outcome probability bias subtypes which could facilitate tailored treatment approaches.
Keywords
outcome probability bias, social anxiety, confirmatory factor analysis, Outcome Probability Task
Introduction
Probability bias, defined as the tendency to overestimate the likelihood of negative events, has long been recognized as a core cognitive feature of anxiety disorders. In social anxiety disorder, this manifests as social outcome probability bias—overestimating the likelihood of being negatively evaluated in social situations. This bias is theorized to stem from a core fear of negative judgment and plays a critical role in maintaining social anxiety by fueling anticipatory anxiety and behavioral avoidance.
Importantly, reductions in outcome probability bias have been identified as a key mechanism of symptom improvement in cognitive-behavioral therapy for social anxiety disorder, underscoring the need for valid and sensitive methods of assessing this construct.
Historically, assessments of outcome probability bias have relied on self-report questionnaires that require participants to estimate the likelihood of various feared outcomes. While useful, these instruments are subject to limitations, including susceptibility to social desirability effects, retrospective recall biases, and variability in reading comprehension. As an alternative to self-report formats, Draheim and Anderson introduced the Outcome Probability Task (OPT), an imagery-based assessment that presents individuals with pictures of social situations and asks them to estimate the likelihood of negative evaluation if they were about to encounter the situation. The task was initially developed to facilitate multi-method assessment of outcome probability bias and improve ecological validity by leveraging mental imagery. This approach is consistent with the goals of the Research Domain Criteria (RDoC) initiative, which encourages dimensional, transdiagnostic, and multi-method approaches to understanding mental health.
The OPT includes images viewed from first-person (i.e., actor) and third-person (i.e., observer) perspectives, which capitalizes on the role of mental imagery in evoking emotional and physiological responses. This approach is particularly relevant for assessing mechanisms of social anxiety because research indicates that people with the disorder imagine social situations from an observer perspective, which is shaped by negative self-images and expectations of social threat. Seeing oneself from an observer perspective has been shown to increase anxiety before social events and to contribute to expectations of negative evaluation and avoidant behavior.
Initial validation of the OPT in a diverse undergraduate sample (N = 148; Mage = 20.61) demonstrated excellent internal consistency (α = 0.95-0.96) and strong convergent validity with a standard self-report measure of social outcome probability bias. Moreover, participants with elevated levels of social anxiety (n = 62) based on the Liebowitz Social Anxiety Self-Report Scale reported higher levels of outcome probability bias on the OPT than those who endorsed lower levels of social anxiety (n = 86). These findings support the OPT’s promise as an ecologically valid and theoretically grounded measure of social outcome probability bias.
A surprising finding from initial research validating the OPT was an exploratory factor analysis that revealed a potential three-factor structure consisting of the following factors: (1) Performance Situations, (2) Social Gatherings, and (3) Probable Judgment based on facial expressions. In contrast, factor analysis of the widely used Outcome Probability Questionnaire revealed a single-factor structure, and outcome probability bias has historically been conceptualized as a unitary construct. These contradictory findings could simply be the result of methodological differences between the two measures. Alternatively, the increased diversity of stimuli in the OPT could have revealed that distinct types of social contexts may differentially elicit outcome probability bias, which is consistent with research showing that the severity of specific social fears ranges based on the severity of social anxiety disorder and individual variation. Therefore, it may also be important to consider specific levels of outcome probability bias in anticipation of a range of feared social situations. Such specificity is relevant for cognitive-behavioral case conceptualization and treatment planning. To confirm the latent structure of the OPT and evaluate its dimensionality in a theory-informed manner, a confirmatory factor analysis (CFA) is warranted.
The hypothesized model examined a three-factor model identified by an exploratory factor analysis. Specifically, it was expected that probability estimates for the 36 trials would uniquely load onto three latent factors (i.e., Performance Situation, Social Gathering, Probable Judgment).
One alternative two-factor model examined factors based on the perspective of the images (i.e., first-person or third-person perspective). This model was tested because of theories proposing that symptoms of social anxiety are exacerbated by the tendency to view social situations from an observer perspective, which is supported by empirical studies.
A second alternative bifactor model examined the three factors from the hypothesized model (i.e., Performance Situation, Social Gathering, Probable Judgment) and an orthogonal (i.e., unrelated), overall factor of outcome probability bias. If the bifactor model shows the best fit, that would indicate that the three latent factors or levels of bias in anticipation of specific social situations would be statistically unrelated to general levels of bias.
Additionally, regression analyses comparing factors identified in CFA analyses and scores from the unitary OPQ may be used to clarify the predictive value of a subtype approach to measurement of probability bias.
Methods
Procedure
This project took place in-person at a metropolitan university in the southern U.S. on the unceded, ancestral lands of the Mvskoke (Creek) Nation, the traditional stewards of what is now called Atlanta. The project was approved by the Georgia State University Institutional Review Board. Data collection took place from August 2021 to April 2024. Flyers were posted around the university and on social media, and the study was listed on SONA, a research platform for students enrolled in psychology courses. Prospective participants were informed that the study was about cognitive processes in social situations. Inclusion criteria required participants to be over 18 years-old and fluent in English. Individuals who participated for cash (n = 20) compensation received $20 or $40, depending on the level of funding at the time of the study session. Participants first completed the informed consent process. Researchers then guided participants through instructions for the OPT and watched them practice before the participants began the task. After the OPT, participants completed self-report measures of psychological symptoms followed by a demographics questionnaire on a computer. Breaks were offered between tasks. Upon the study’s completion, credit or compensation was granted, and participants were offered a list of mental health resources in the area.
Participants
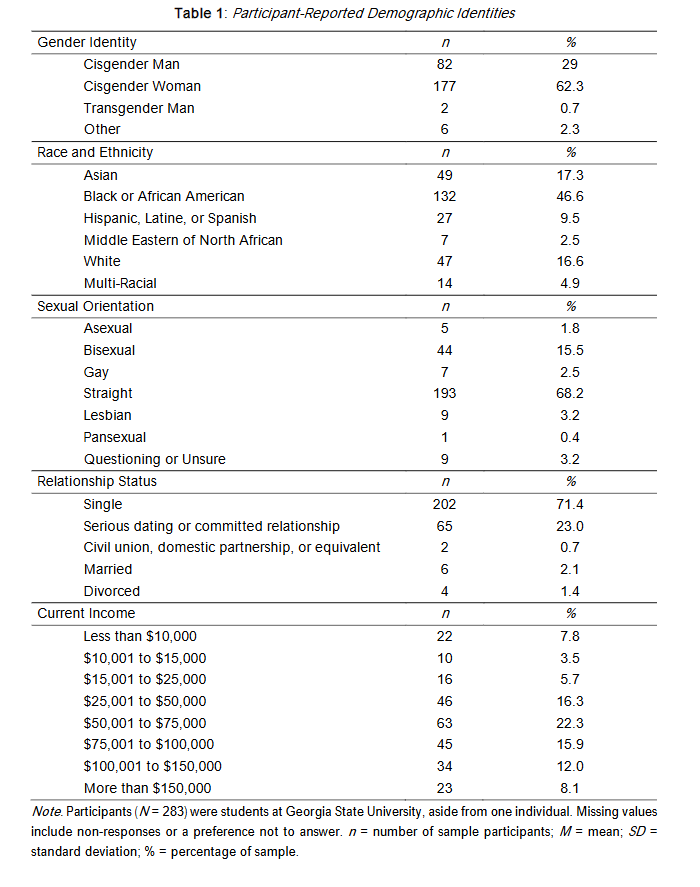
Participants (N = 283) were (with one exception) students recruited from Georgia State University who participated for cash or to earn course credit. A portion of participants (n = 257) reported an average age of 21.06 (SD = 6.08), ranging from 18 to 73. Age for the remainder of the participants could not be determined because the original demographics questionnaire asked for date of birth rather than age and many individuals listed the date of participation. Participants mostly self-identified as Cisgender Woman (62.3%) and Black or African American (46.6%). Based on questions about sexual orientation and gender, 28.0% and 3.0% of the sample reported LGBTQIA2s+ identities, respectively. More information about participant-reported demographic identities can be found in Table 1.
Measures
Outcome Probability Task
The OPT is a computerized assessment of outcome probability bias during which respondents view a series of social and non-social (i.e., control) images. Control images depict unemotional, everyday items (e.g., buildings and objects), and social images portray situations commonly feared and avoided by individuals with social anxiety disorder (e.g., public speaking, interviews, parties).
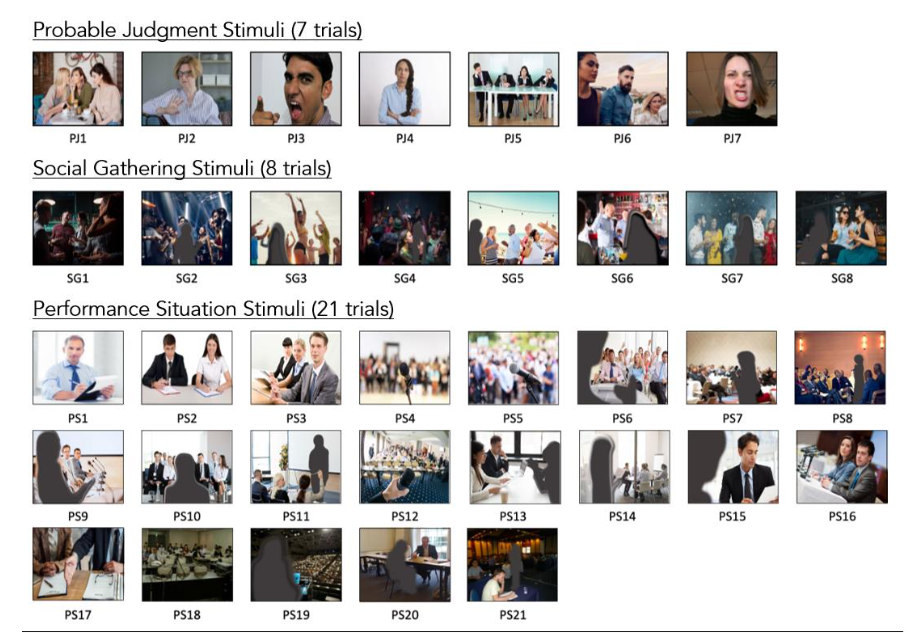
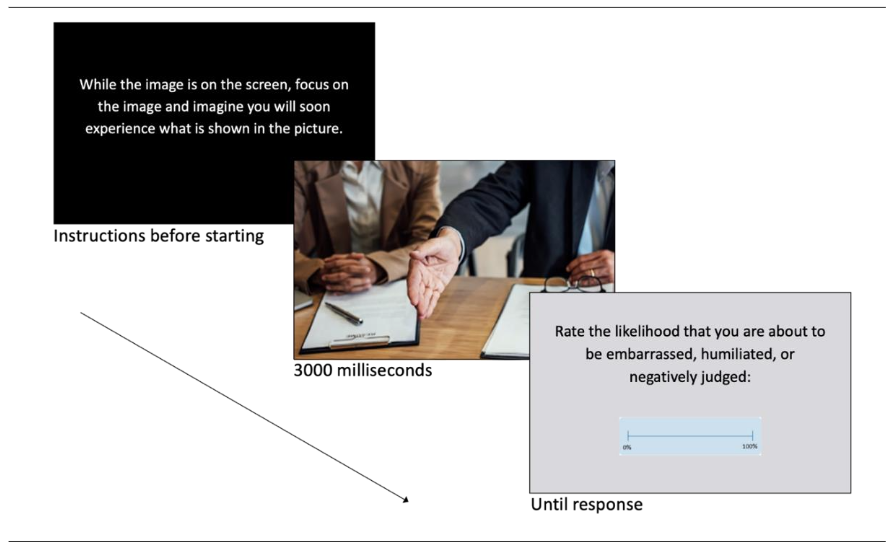
Social images are viewed from either a first-person or third-person perspective. Third-person perspective trials include a figure that is blurred out to conceal sociodemographic information (e.g., race, gender, age, etc.), and participants are instructed to mentally replace the blurry figure with an image of themselves. For each trial, respondents imagine they are about to encounter the situation depicted and then rate the likelihood (0-100%) that they would be embarrassed, humiliated, and/or negatively judged. Greater ratings reflect a greater likelihood of a negative outcome. The original paper reported strong internal consistency for first-person perspective, third-person perspective, and control images (α = 0.94, 0.96 and 0.91, respectively).

Based on suggestions in the task development papers, some changes to the task were made. Because results from a Spearman-Brown prophecy formula revealed that trials could be cut while retaining good internal consistency, images with relatively lower factor loadings compared to other images in the original study were removed. This reduced the number of social trials from 70 to 36, and control trials from 25 to 23. Additionally, the previous version allowed respondents to view trial images at their own pace; the OPT used in this study showed images for three seconds to ensure consistency in engagement with task stimuli across participants. In the original version, a block of trials in which images were shown very quickly in order to evaluate the potential role of the availability heuristic were not included in the current study, as it was not relevant to the research question. The OPT used in the present study consisted of six practice trials (two control images, two first-person perspective images, two third-person perspective images), 36 social trials (17 first-person perspective images; 19 third-person perspective images), and 23 non-social control trials. Participants viewed images for 3000 milliseconds and used a slide bar to indicate the likelihood of negative evaluation. The default position of the slide bar was 50%. As in the original study, internal consistency was good to excellent for first-person perspective, third-person perspective, and control trials as measured by Cronbach’s alpha (α = 0.95, 0.96 and 0.89 respectively) and by McDonald’s omega (ω = 0.95, 0.96 and 0.90, respectively), a recommended alternative. Internal consistency for factors in the hypothesized model ranged from good to excellent: performance situation trials (α = 0.98; ω = 0.98), social gathering trials (α = 0.93; ω = 0.93), and probable judgment trials (α = 0.88; ω = 0.89).
Psychological Self-Report Questionnaires
Self-report questionnaires were used to assess relations between the OPT and self-reported outcome probability bias and social anxiety symptoms and to characterize participants’ levels of depression, anxiety, and stress.
The Outcome Probability Questionnaire (OPQ) is a 12-item self-report scale used to measure outcome probability bias. It instructs respondents to rate how likely it is that negative, socially threatening events will occur during a public speaking situation in the following year. Scores range from 0-96 with greater scores indicating a greater probability of negative outcomes. Excellent internal consistency was observed for the OPQ in the current sample (α = 0.91; ω = 0.90).
The Liebowitz Social Anxiety Scale-Self Report (LSAS) is a 48-item self-report scale used to measure fear and avoidance regarding social situations. It is informed by the clinician-administered version which consists of items describing social (e.g., meeting strangers) and performance situations (e.g., giving a speech). Scores range from 0-144, with higher scores indicating higher levels of fear and avoidance. In the present sample, the LSAS yielded excellent internal consistency (α = 0.94; ω = 0.94).
The Depression, Anxiety, and Stress Scale (DASS) is a 42-item dimensional self-report instrument used to assess symptoms of depression, anxiety, and stress experienced in the week prior. The 21-item version of the DASS (DASS-21) was included in the present study, as research has supported the use of the shorter version as a valid and reliable measure of the constructs in non-clinical samples. Scores range from 0-42, with greater scores indicating greater depression, anxiety, and stress. In the present sample, internal consistency on the DASS-21 was excellent for all items (α = 0.93; ω = 0.93) and for the depression scale (α = 0.91; ω = 0.91), and good for anxiety (α = 0.79; ω = 0.80) and stress scales (α = 0.82; ω = 0.82).
Because this sample is largely comprised of individuals who identify as Black, LGBTQIA2S+, and/or who report varying degrees of financial stability, the norms for these measures may not be representative for participants in the current study.
Data Analysis
Multiple analyses were conducted to describe the sample, evaluate the structure of the OPT, and compare metrics with those identified by Draheim. OPT data were collected on ePrime and cleaned using a Microsoft Excel template that transformed data from multiple lines to a single line. Confirmatory factor analyses were conducted in Mplus. REDCap was used to collect self-reported data, for which descriptive statistics were conducted using IBM SPSS Statistics. The sample size needed to be adequately powered for a CFA is dependent upon a variety of factors (e.g., study design, type of data, number of factors and indicators). The current sample size (N = 283) exceeded rules of thumb found in the literature (e.g., N > 200) which can be too generalizable but are still often relied upon.
The maximum likelihood estimation method was chosen to estimate the model parameters in a way that increases the probability that data will be drawn from the population. Model fit was evaluated using several indices, each with proposed values for interpreting model fit as adequate: 1) root mean square error of approximation (RMSEA) < .08 and non-significant; 2) standardized root mean square residual (SRMR) < .08; 3) comparative fit index (CFI) > 0.90, but 0.95 is ideal; 4) Tucker-Lewis index (TLI) > 0.90, but 0.95 is ideal; and 5) Chi-Square statistic with a degrees of freedom ratio < 2 or at least 3 and non-significant.
The factor structure of the OPT was examined by comparing three competing models: (1) a three-factor model reflecting the EFA-derived structure based on content categories of social threat; (2) a two-factor model based on the visual perspective of imagery (first-person vs. third-person), grounded in theory and research on observer perspective in SAD; and (3) a bifactor model, in which a general outcome probability bias factor is modeled alongside the three content-specific factors, allowing examination of both general and domain-specific variance. Regression analyses were also conducted to identify semi-partial correlations among the OPT factors and OPQ.
Results
Psychological Characteristics of the Sample
Self-reported psychological characteristics of participants can be viewed in Table 2. Self-reported levels of outcome probability bias were somewhat elevated on the OPQ (M = 41.12; SD = 22.72) and the average score on the LSAS-SR was in the clinically relevant range (M = 64.36; SD = 25.7). Scores on the DASS-21 results suggested mild levels (i.e., 10-13) of depression (M = 12.31; SD = 11.17), moderate levels (i.e., 10-14) of anxiety (M = 12.02; SD = 9.45), and mild levels (i.e., 15-18) of stress (M = 15.77; SD = 9.94).
Bivariate correlations were all significant (p < .001), and in the expected, positive direction indicating relations between the severity of maladaptive psychological traits.
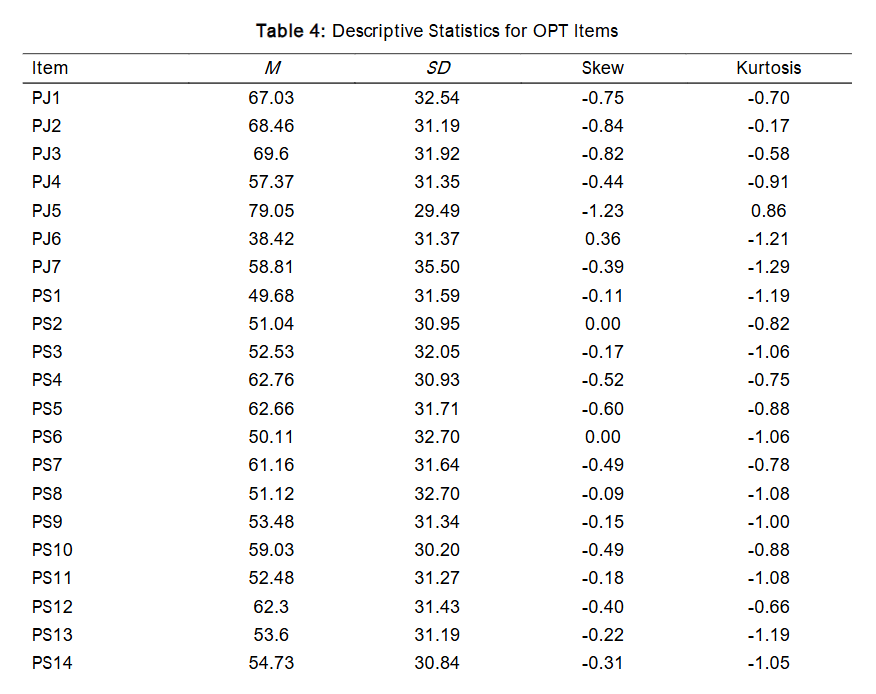
Descriptive Statistics for Trials on the OPT
Item responses ranged from 0-100. The mean of social trials was 51.07 (SD = 23.15) and the mean of non-social trials was 9.27 (SD = 10.13). Mean scores on the factors from the hypothesized 3-factor model were: Probable Judgment = 62.68 (SD = 24.53); Performance Situation = 54.67 (SD = 26.36); Social Gathering = 31.47 (SD = 25.62). As shown in Table 4, there was considerable variability across trials, and several trials demonstrated non-normality.
Construct Validity: Confirmatory Factor Analysis Results
Comparisons of fit indices for the hypothesized 3-factor model, alternative bifactor model, and alternative 2-factor perspective model can be seen in Table 5.
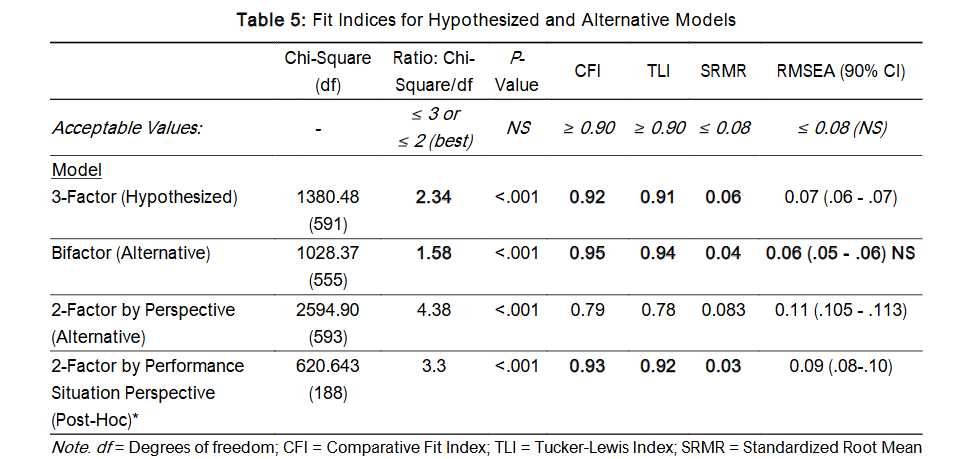
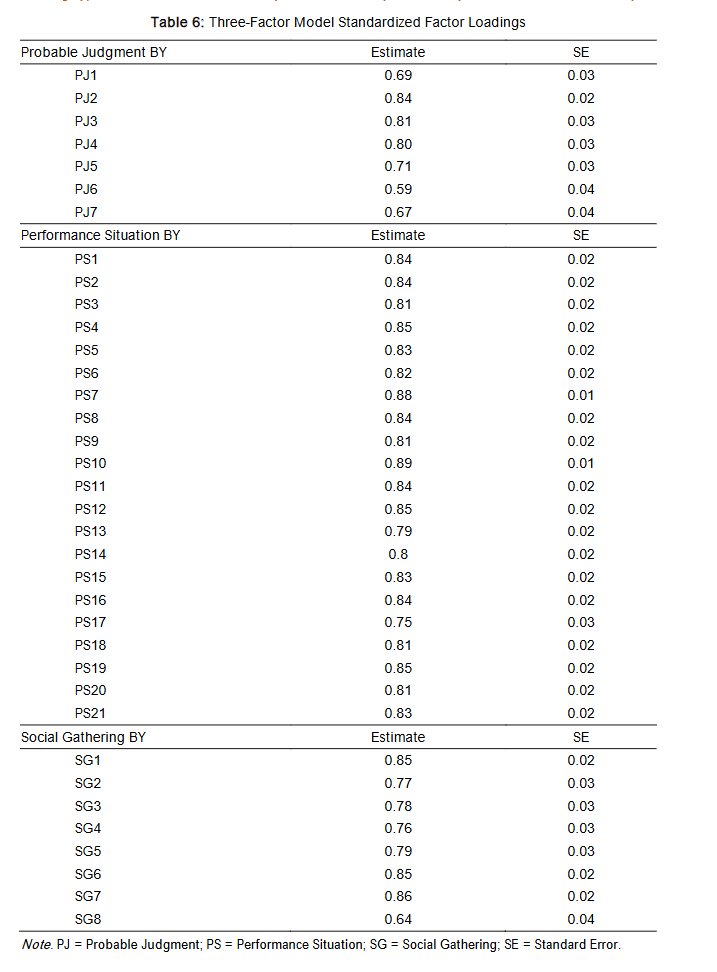
The hypothesized 3-factor model yielded acceptable values for all fit indices, with the exceptions of showing significance on the chi-square test and the RMSEA estimate. Standardized factor loading estimates were all significant (p < .001) and were predominantly greater than 0.7, which is generally considered an acceptable value. Notably, 3 trials within the Probable Judgment factor and 1 trial within the Social Gathering factor did not meet this recommended factor loading threshold. This suggests that the trials may not accurately measure the factors specified. Condensed results of the hypothesized model are depicted to highlight the latent structure of the OPT.
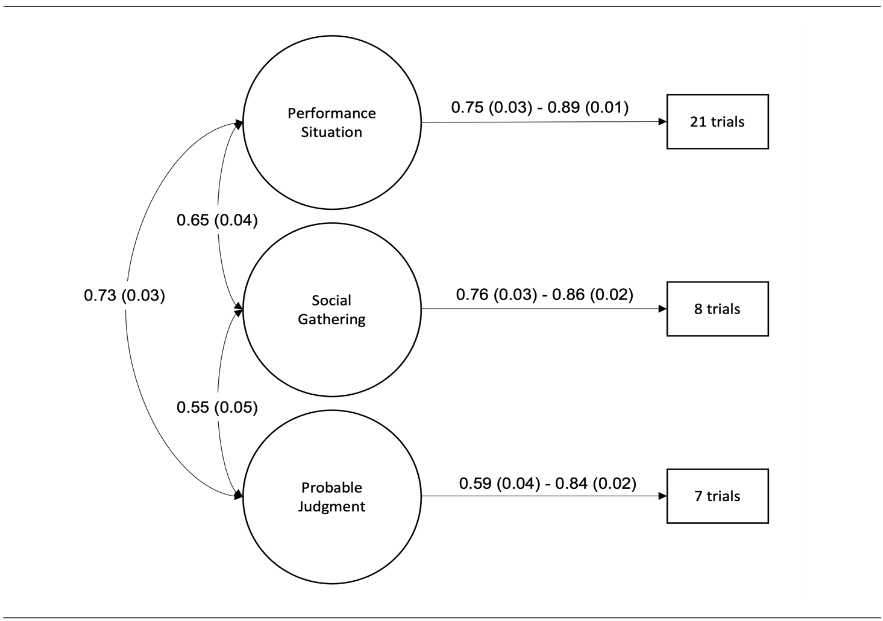
For optimal viewing of the hypothesized model results, standardized factor loadings are listed in Table 6.
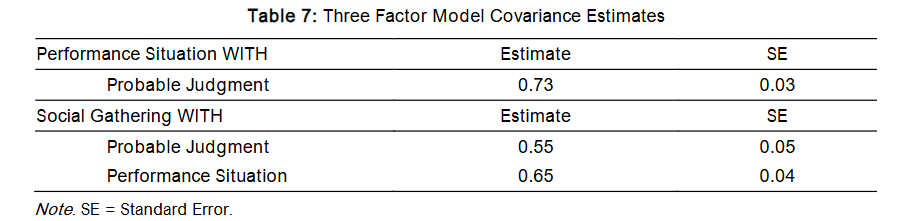
Covariance estimates between factors were also significant (p < .05) for the three-factor model and ranged from 0.55 to 0.73.
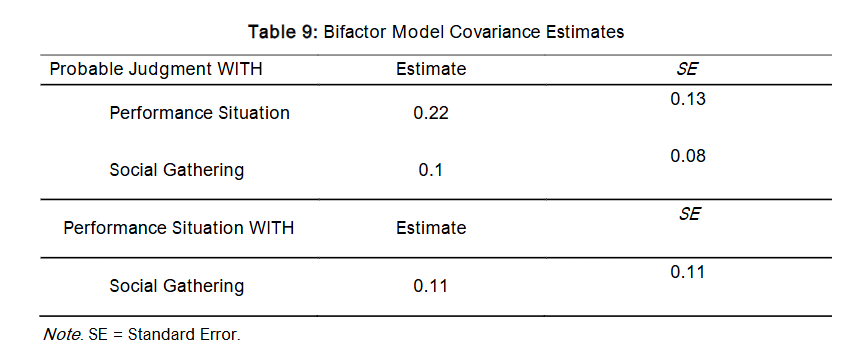
The alternative bifactor model yielded acceptable values for all fit indices, with the exception of showing significance on the chi-square test. Based on fit indices alone, this alternative bifactor model appears to better fit the data than the hypothesized model. However, as shown in Table 8, none of the factor loading estimates were equal to or above the recommended threshold of 0.7 for the hypothesized factors when an orthogonal Outcome Probability Bias factor was specified in the model.
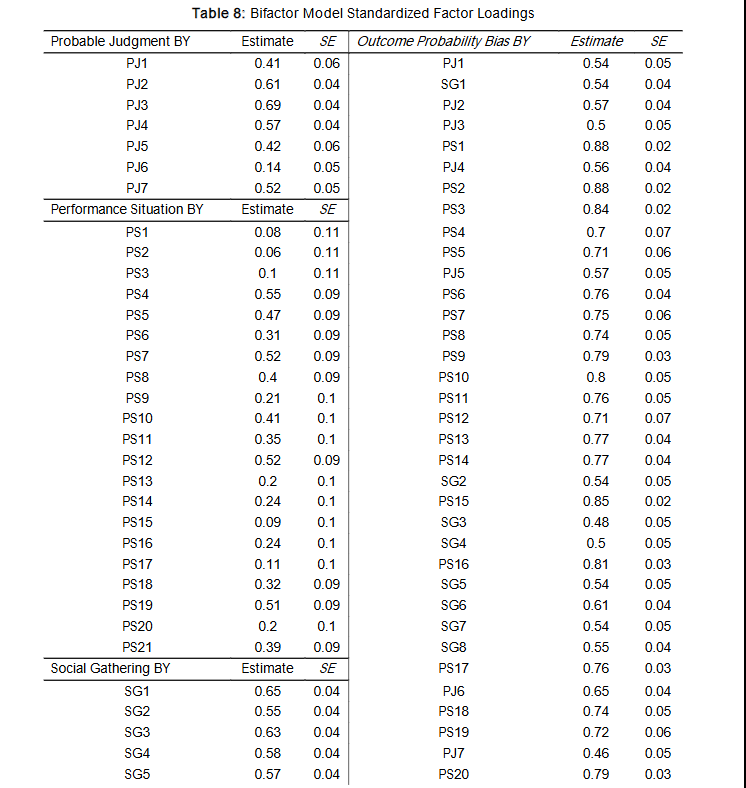
Furthermore, covariance estimates between factors were non-significant and quite low for the bifactor model, ranging from 0.10 to 0.22.
The alternative 2-factor model based on trial perspective (i.e., 1st or 3rd person view) did not show a good fit for any index, despite theoretical support. However, there is an important limitation of this analysis because the Social Gathering images were all from a 3rd person perspective and the Probable Judgment images were all presented from a 1st person perspective. Only Performance Situation images included a mix of 1st person and 3rd person perspectives. Accordingly, a post-hoc analysis using only Performance Situation trials was conducted to evaluate a potential 2-factor structure based on trial perspective. The post-hoc model showed good CFI, TLI, and SRMR values, but other indices were inadequate. Standardized factor loading estimates were all significant (p < .001) and consistently strong for 1st person perspective trials that ranged from 0.75 to 0.85, and 3rd person perspective trials that ranged from 0.79 to 0.85. Covariance between factors was significant (p < .001) and higher than what is considered adequate at 0.99, demonstrating a strong similarity between factors. Importantly, comparisons cannot be made between the post-hoc model and other models due to discrepancies in the trials included in factor analyses.
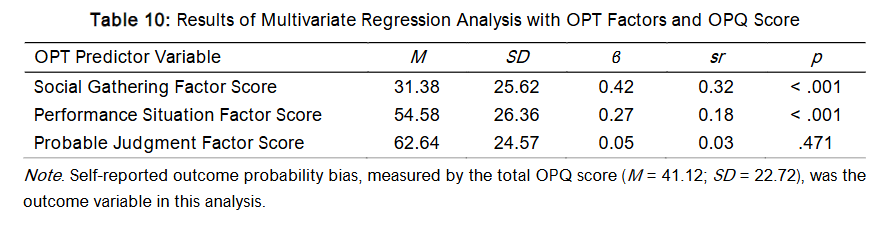
To further evaluate the validity of the 3-factor structure, multivariate regression analyses were performed among the hypothesized OPT factors (i.e., predictor variables) and self-reported levels of outcome probability bias based on OPQ scores (i.e., outcome variable). The OPT Social Gathering factor accounted for the most variability in OPQ scores (β = 0.42; p < .001), though this is only a medium effect with the strongest semi-partial correlation (sr = 0.32). The OPT Performance Situation factor accounted for a small portion of the variability in OPQ scores (β = 0.27; p < .001) with a weak semi-partial correlation (sr = 0.18). The OPT Probable Judgment factor did not significantly account for variability in OPQ scores (β = 0.05; p > .05) and showed a weak semi-partial correlation (sr = 0.03).
Discussion
Overview
Accurate assessment of outcome probability bias is critical, given its role in the onset, maintenance, and treatment of social anxiety symptoms. Outcome probability bias has been historically measured as a unitary construct via questionnaire-based assessments. A new measure of the construct, the OPT, implements anticipatory social imagery to evaluate levels of expected negative evaluation. Previous exploratory factor analytic results and the present confirmatory factor analytic results identified that the OPT measures three types of outcome probability bias based on types of social situations presented. This suggests that social situations that involve evaluative performances, social gatherings, and probable negative judgment elicit different types of outcome probability bias. These findings may support the conceptualization of social outcome probability bias as a multifaceted construct but may also be attributed to the design of the assessment tool. Because this is the first known task-based assessment of outcome probability bias, further research should be conducted using self-report tools of the construct to better understand its multi-dimensionality.
Compared to the three-factor model identified by Draheim, factor loading estimates in the present sample were generally superior, which is likely due to the reduction in trials. Similarly, adequate fit metrics were also observed, further supporting that the OPT should be used to evaluate levels of different types of outcome probability bias, opposed to generalized outcome probability bias.
Draheim did not find that the perspective by which trials of the OPT are shown (i.e., observer and actor perspectives) measure distinct types of outcome probability bias. However, picturing oneself from an observer’s (i.e., third person) perspective contributes to distress and other maladaptive cognitive biases among socially anxious individuals. In the present sample, a two-factor model of trials was tested for all trials and for performance-related trials. For the model including only performance situation trials, some fit indices were identified as adequate, but covariance between the perspective factors was extremely high. This may be because the method for inducing the third-person perspective could have been ineffective, but the study lacked manipulation checks to evaluate this further. Notably, this model cannot be compared with other models tested because different trials were included. However, these results identify that the perspective by which performance situation trials are shown could still be important to measure separately. This is based on excellent factor loadings and some adequate fit indices, but caution is warranted, as the high level of covariance between factors suggests they largely measure the same construct.
Regression analyses revealed significant variability in the OPT subfactors’ ability to detect self-reported levels of outcome probability bias and may also speak to the need for advancements in such tools. Of the three factors, images that depicted social gatherings had the best convergent validity with self-reported levels of outcome probability bias. Images that depicted performance situations elicited similar bias ratings as the OPT as a whole, but still showed a small level of convergent validity. The factor corresponding to pictures of negative judgment showed particularly poor convergent validity, suggesting this may not be a valid approach for measuring outcome probability bias. This aligns with other results that showed several trials depicting negatively valanced facial expressions to have poor factor loading estimates and that such trials demonstrated relatively lower internal consistency compared to trials of other factors. It appears that the OPT is particularly poised to measure outcome probability bias subtypes that pertain to social gatherings and performance situations.
Overall, these results provide further support that the OPT can be used to measure some subtypes of outcome probability bias across a range of commonly feared social situations despite the historical approach of measuring social outcome probability bias as a unitary construct. The assessment of outcome probability bias subtypes in clinical settings would allow for more personalized, and potentially more effective, treatment plans particularly for exposure-based therapy. Knowing the types of social situations that elicit outcome probability bias amongst individuals may elucidate appropriate social exposures. For example, research shows that the effectiveness of exposure therapy is maximized when expectations are violated. This may be assessed more effectively using multi-method approaches that evaluate specific subtypes of outcome probability bias such as the OPT.
Limitations
Several limitations regarding sampling warrant consideration. The sample comprised college students receiving course credit or cash, limiting generalizability due to their age, educational access, and motivation for participation. Although participants represented diverse sociodemographic backgrounds, subgroup analyses were not feasible due to limited power. This is notable given that both social anxiety and outcome probability bias may be more prevalent or expressed differently among marginalized groups. Factor analyses within subgroups may have shed light on how structural inequalities, and corresponding health disparities, influence an aspect of social cognitive processing. Additionally, mental imagery is a cognitive process that is not universally experienced and we did not systematically evaluate participants’ ability to engage in mental imagery.
Task design flaws are also important to acknowledge. Firstly, the approach of having participants imagine themselves as the blurry figure may not have been an adequate way of eliciting the third-person perspective. The representativeness of the stimuli may have also influenced results. Although the OPT includes images of individuals with varying visible identities, participants may not have perceived these individuals as relatable, potentially affecting their ratings. Additionally, the OPT does not capture the full spectrum of potentially socially evaluative situations such as dating, being in non-performative/non-party-based settings (e.g., public transit, school/work, grocery stores), or navigating social situations that highlight differences (e.g., being the only woman in a board room meeting). Advancements in technology have also transformed what is considered social (e.g., texting, social media, gaming), and none of these forms of social situations are represented in the current version of the OPT. These limitations suggest the need for future research to refine and expand the OPT’s scope to better capture real-world social anxieties and improve generalizability.
Additionally, it is possible that the factor structure revealed by the OPT is driven primarily by the nature of the measure rather than true variability in outcome probability bias and the current methods were not sufficient to rule out this possibility.
Future Directions
Further refinement of the OPT is needed. The goal of the task is to facilitate anticipation of imagined, ambiguous social events to collect ratings of expected negative evaluation which are expected to be higher for people with social anxiety even if social information is neutral. People with social anxiety disorder fear negative evaluation and tend to focus on facial expressions which may confirm their fears such as disgust or disapproval. A review of the images shows that some of these trials included facial expressions conveying overt anger, disgust, and disinterest. These trials may not effectively measure biased expectations but instead evoke responses to unambiguously negative social stimuli. Four of the seven trials within the Probable Judgment factor showed factor loadings just at or below the recommended level (i.e., 0.70). Similarly, certain Social Gathering items may be confounded by cultural or personal factors (e.g., alcohol use), which could inflate ratings unrelated to social anxiety. For example, if an individual abstains from alcohol, they may rate that they will absolutely be negatively judged in response to a bar setting not because they are experiencing a cognitive bias related to social anxiety, but because they do not participate in group norms typical in those environments. Future modifications of the OPT should be informed by this work to develop a shorter, more efficient instrument that considers limitations of images included in the present version of this task. Integrating neuroimaging techniques could elucidate the neural correlates of outcome probability bias. The lateral orbitofrontal cortex has been linked with the anticipation of negative outcomes anticipatory fear responses and social anxiety disorder has been associated with decreased resting-state functional connections between the medial orbitofrontal cortex and amygdala. Task-based formats like the OPT are well-suited to investigate potential white matter connections by measuring activity in cortical regions using tools with good temporal resolution, such as fMRI or EEG. Work such as this which is also aligned with the goals of RDoC could potentially expand understanding about the pathology and etiology of social outcome probability bias to advance precision medicine efforts.
Technological advances could further expand the OPT’s applicability. The OPT could be administered with virtual reality which may create a more immersive experience of social scenarios relative to viewing static images. Delivering the OPT on a personal mobile device, such as a smartphone, would allow for ecological momentary assessment using physiological, geographical, and/or randomized cues prompting individuals to assess anticipated judgment in real-time. Directly relating to the OPT, an individual may record a log of upcoming events that they believe will result in negative social evaluation. The app could then prompt them to complete the OPT prior to the event(s) to better evaluate in-the-moment levels of outcome probability bias. This would provide more ecologically valid data and support precision assessments of outcome probability bias in daily life.
The OPT could be used to expand multi-method treatment interventions for social anxiety. Cognitive restructuring is an integral aspect of cognitive-behavioral therapy and requires individuals to identify alternative, more adaptive thoughts related to presenting concerns. Cognitive bias modification paradigms draw from this approach by providing corrective feedback after negatively biased responses are detected. There are existing cognitive-bias modification treatments for attention biases and interpretation biases, but none that specifically target outcome probability bias. The task’s computerized format makes it well-suited for delivering corrective feedback to shift negatively biased probability estimates. Additionally, the OPT could be used to experimentally manipulate outcome probability biases involved in social anxiety disorder, which would facilitate rigorous testing. Prior research shows that outcome probability bias measured via questionnaire-based assessments is a mechanism by which cognitive behavior therapy reduces symptoms of social anxiety disorder. Future research should evaluate whether targeting specific subtypes of outcome probability bias has differential influences on symptom reduction, or whether these subtypes are differentially reduced after treatment for social anxiety disorder.
Outcome probability bias is not exclusive to social anxiety disorder, underscoring the importance of transdiagnostic assessment tools. Future work should explore how the OPT may be modified to include fear-relevant stimuli across disorders to advance integrative models of social cognition and emotional dysfunction.
Conclusion
The OPT is a promising tool for the multidimensional assessment of outcome probability bias, a key cognitive factor in social anxiety disorder. This study supports a three-factor model encompassing performance fears, social interactions in group settings, and perceived judgment, offering a more nuanced understanding than traditional unidimensional approaches. Future research should refine the instrument, expand its scope, and explore its potential in both assessment and intervention contexts. Enhancing our understanding and measurement of outcome probability bias is a crucial action toward improving treatment outcomes for individuals with social anxiety and related disorders.
Conflicts of Interest Statement:
The authors have no conflicts of interest to report.
Funding Statement:
This work was supported by two Health Resources & Services Administrations (HRSA): Graduate Psychology Education (GPE) Program training grant [2 D40HP33346-04-00] and Behavioral Health Workforce Education and Training (BHWET) Programs [1 M01HP41970-01-00].
References:
- Butler G, Mathews A. Cognitive processes in anxiety. Adv Behav Res Ther. 1983;5(1):51-62. doi:10.1016/0146-6402(83)90015-2.
- Foa EB, Kozak MJ. Emotional processing of fear. Exposure to corrective information. Psychol Bull. 1986;99(1):20-35. doi:10.1037/0033-2909.99.1.20.
- Clark DM, Wells A. A cognitive model of social phobia. In: Heimberg G, Liebowitz MR, Hope D, Scheier F, eds. Social phobia: Diagnosis, assessment, and treatment. The Guilford Press; 1995:69-93.
- Rapee RM, Heimberg RG. A cognitive-behavioral model of anxiety in social phobia. Behav Res Ther. 1997;35(8):741-756. doi:10.1016/S0005-7967(97)00022-3.
- Clark DM. A cognitive perspective on social phobia. In: Crozier WR, Alden LE, eds. International handbook of social anxiety: Concepts, research and intervention relating to the self and shyness. John Wiley & Sons, Ltd; 2001:405-430.
- Hofmann SG. Cognitive factors that maintain social anxiety disorder: A comprehensive model and its treatment implications. Cogn Behav Ther. 2007;36(4):193-209. doi:10.1080/16506070701421313.
- Heimberg RG, Brozovich FA, Rapee RM. A cognitive behavioral model of social anxiety disorder: Update and extension. In: Hofmann SG, DiBartolo PM, eds. Social Anxiety. 2nd ed. Elsevier Academic Press; 2010:395-422. doi:10.1016/b978-0-12-375096-9.00015-8.
- Heimberg RG, Brozovich FA, Rapee RM. A cognitive-behavioral model of social anxiety disorder. In: Hofmann SG, DiBartolo PM, eds. Social anxiety: Clinical, developmental, and social perspectives. 3rd ed. Elsevier Academic Press; 2014:704-728. doi:10.1016/b978-0-12-394427-6.00024-8.
- Gordon D, Wong J, Heimberg RG. Cognitive‐behavioral therapy for social anxiety disorder: The state of the science. In: Weeks JW, ed. The Wiley Blackwell handbook of social anxiety disorder. Wiley Blackwell; 2014:477-497. doi:10.1002/9781118653920.ch22.
- Smits JAJ, Rosenfield D, Mcdonald R, Telch MJ. Cognitive mechanisms of social anxiety reduction: An examination of specificity and temporality. J Consult Clin Psychol. 2006;74(6):1203-1212. doi:10.1037/0022-006X.74.6.1203.
- Calamaras MR, Tully EC, Tone EB, Price M, Anderson PL. Evaluating changes in judgmental biases as mechanisms of cognitive-behavioral therapy for social anxiety disorder. Behav Res Ther. 2015;71:139-149. doi:10.1016/j.brat.2015.06.006.
- Foa EB, Franklin ME, Perry KJ, Herbert JD. Cognitive biases in generalized social phobia. J Abnorm Psychol. 1996;105(3):433-439. doi:10.1037/0021-843x.105.3.433.
- Rapee RM, Abbott MJ. Modelling relationships between cognitive variables during and following public speaking in participants with social phobia. Behav Res Ther. 2007;45(12):2977-2989.
- Coughlin SS. Recall bias in epidemiologic studies. J Clin Epidemiol. 1990;43(1):87-91. doi:10.1016/0895-4356(90)90060-3.
- Paulhus DL. Socially desirable responding on self-reports. In: Zeigler-Hill V, Shackelford T, eds. Encyclopedia of personality and individual differences. Springer; 2017:1-5. doi:10.1007/978-3-319-28099-8_1349-1.
- McHugh RK, Rasmussen JL, Otto MW. Comprehension of self-report evidence-based measures of anxiety. Depress Anxiety. 2011;28(7):607-614. doi:10.1002/da.20827.
- Draheim AA, Anderson PL. A novel computer task to assess outcome probability bias. J Anxiety Disord. 2022;87:102538. doi:10.1016/j.janxdis.2022.102538.
- Cuthbert BN, Insel TR. Toward the future of psychiatric diagnosis: the seven pillars of RDoC. BMC Med. 2013;11(126):1-8. doi:10.1186/1741-7015-11-126.
- Morris SE, Sanislow CA, Pacheco J, et al. Revisiting the seven pillars of RDoC. BMC Med. 2022;20(1):220. doi:10.1186/s12916-022-02414-0.
- Holmes EA, Mathews A, Mackintosh B, Dalgleish T. The causal effect of mental imagery on emotion assessed using picture-word cues. Emotion. 2008;8(3):395-409. doi:10.1037/1528-3542.8.3.395.
- Lang PJ. A bio-informational theory of emotional imagery. Psychophysiology. 1979;16(6):495-512. doi:10.1111/j.1469-8986.1979.tb01511.x.
- Hackmann A, Surawy C, Clark DM. Seeing yourself through others’ eyes: A study of spontaneously occurring images in social phobia. Behav Cogn Psychother. 1998;26:3-12. doi:10.1017/S1352465898000022.
- Hirsch CR, Clark DM, Mathews A. Imagery and interpretations in social phobia: Support for the combined cognitive biases hypothesis. Behav Ther. 2006;37(3):223-236. doi:10.1016/j.beth.2006.02.001.
- Spurr JM, Stopa L. The observer perspective: Effects on social anxiety and performance. Behav Res Ther. 2003;41(9):1009-1028. doi:10.1016/S0005-7967(02)00177-8.
- Liebowitz MR. Social phobia. Mod Probl Pharmacopsychiatry. 1987;22:141-173. doi:10.1159/000414022.
- Draheim AA. A novel task to assess outcome probability bias for social anxiety. Dissertation. Georgia State University; 2021. doi:10.57709/17744394.
- Uren TH, Szabó M, Lovibond PF. Probability and cost estimates for social and physical outcomes in social phobia and panic disorder. J Anxiety Disord. 2004;18(4):481-498. doi:10.1016/S0887-6185(03)00028-8.
- Crome E, Baillie A. Mild to severe social fears: Ranking types of feared social situations using item response theory. J Anxiety Disord. 2014;28(5):471-479. doi:10.1016/j.janxdis.2014.05.002.
- American Psychiatric Association. Diagnostic and statistical manual of mental disorders. 5th ed., text rev. American Psychiatric Association; 2022. doi:10.1176/appi.books.9780890425787.
- Beck JS. Cognitive behavior therapy: Basics and beyond. 3rd ed. Guilford Publications; 2020. doi:10.1037/psycnet-apa-record-2020-66930-000.
- Hayes AF, Coutts JJ. Use omega rather than alpha for estimating reliability. But…. Communi Meth Measures. 2020;14(1):1-24. doi:10.1080/19312458.2020.1718629.
- Baker SL, Heinrichs N, Kim HJ, Hofmann SG. The Liebowitz social anxiety scale as a self-report instrument: A preliminary psychometric analysis. Behav Res Ther. 2002;40(6):701-715. doi:10.1016/S0005-7967(01)00060-2.
- Lovibond PF, Lovibond SH. The structure of negative emotional states: Comparison of the Depression Anxiety Stress Scales (DASS) with the Beck Depression and Anxiety Inventories. Behav Res Ther. 1995;33(3):335-343. doi:10.1016/0005-7967(94)00075-u.
- Henry JD, Crawford JR. The short-form version of the Depression Anxiety Stress Scales (DASS-21): Construct validity and normative data in a large non-clinical sample. Br J Clin Psychol. 2005;44(2):227-239. doi:10.1348/014466505×29657.
- Sinclair SJ, Siefert CJ, Slavin-Mulford JM, et al. Psychometric evaluation and normative data for the Depression, Anxiety, and Stress Scales-21 (DASS-21) in a nonclinical sample of U.S. adults. Eval Health Prof. 2012;35(3):259-279. doi:10.1177/0163278711424282.
- Brown TA. Confirmatory factor analysis for applied research. 2nd ed. The Guilford Press; 2015. doi:10.1037/psycnet-apa-record-2015-10560-000.
- Kline RB. Principles and practice of structural equation modeling. 4th ed. Guilford Press; 2016. doi:10.1037/psycnet-apa-record-2015-56948-000.
- Marsh HW, Hau K-T, Grayson D. Goodness of fit in structural equation models. In: Maydeu-Olivares A, McArdle JJ, eds. Contemporary psychometrics: A festschrift for Roderick P. McDonald. Lawrence Erlbaum Associates Publishers; 2005:275-340. doi:10.1037/psycnet-apa-record-2005-04585-010.
- Jackson DL, Gillaspy Jr JA, Purc-Stephenson R. Reporting practices in confirmatory factor analysis: An overview and some recommendations. Psychol Methods. 2009;14(1):6-23. doi:10.1037/a0014694.
- Craske MG, Treanor M, Conway CC, Zbozinek T, Vervliet B. Maximizing exposure therapy: An inhibitory learning approach. Behav Res Ther. 2014;58:10-23. doi:10.1016/j.brat.2014.04.006.
- Puckett JA, Maroney MR, Levitt HM, Horne SG. Relations between gender expression, minority stress, and mental health in cisgender sexual minority women and men. Psychol Sex Orientat Gender Divers. 2016;3(4):489-498. doi:10.1037/sgd0000201.
- Asher M, Asnaani A, Aderka IM. Gender differences in social anxiety disorder: A review. Clin Psychol Rev. 2017;56:1-12. doi:10.1016/j.cpr.2017.05.004.
- Mahon CP, Pachankis JE, Kiernan G, Gallagher P. Risk and protective factors for social anxiety among sexual minority individuals. Arch Sex Behav. 2021;50(3):1015-1032. doi:10.1007/s10508-020-01845-1.
- Muraki EJ, Speed LJ, Pexman PM. Insights into embodied cognition and mental imagery from aphantasia. Nat Rev Psychol. 2023;2(10):591-605. doi:10.1038/s44159-023-00221-9.
- Antonucci TC, Ajrouch KJ, Manalel JA. Social relations and technology: Continuity, context, and change. Innov Aging. 2017;1(3):igx029. doi:10.1093/geroni/igx029.
- Buckner JD, Maner JK, Schmidt NB. Difficulty disengaging attention from social threat in social anxiety. Cogn Ther Res. 2010;34:99-105. doi:10.1007/s10608-008-9205-y.
- Ursu S, Clark KA, Stenger VA, Carter CS. Distinguishing expected negative outcomes from preparatory control in the human orbitofrontal cortex. Brain Res. 2008;1227:110-119. doi:10.1016/j.brainres.2008.06.033.
- Hahn A, Stein P, Windischberger C, et al. Reduced resting-state functional connectivity between amygdala and orbitofrontal cortex in social anxiety disorder. NeuroImage. 2011;56(3):881-889. doi:10.1016/j.neuroimage.2011.02.064.
- Shiffman S, Stone AA, Hufford MR. Ecological momentary assessment. Ann Rev Clin Psychol. 2008;4(1):1-32. doi:10.1146/annurev.clinpsy.3.022806.091415.
- Amir N, Beard C, Burns M, Bomyea J. Attention modification program in individuals with generalized anxiety disorder. J Abnorm Psychol. 2009;118(1):28-33. doi:10.1037/a0012589.
- Mogg K, Bradley BP. Anxiety and attention to threat: Cognitive mechanisms and treatment with attention bias modification. Behav Res Ther. 2016;87:76-108. doi:10.1016/j.brat.2016.08.001.
- Beard C, Peckham AD. Interpretation bias modification. In: Abramowitz JS, Blakey SM, eds. Clinical handbook of fear and anxiety: Maintenance processes and treatment mechanisms. American Psychological Association; 2019:359-377. doi:10.1037/0000150-020.
- Lavigne KM, Deng J, Raucher-Chéné D, et al. Transdiagnostic cognitive biases in psychiatric disorders: A systematic review and network meta-analysis. Prog Neuropsychopharmacol Biol Psychiatry. 2024;129:110894. doi:10.1016/j.pnpbp.2023.110894.