


Predicting COVID-19 Spread with Neural Networks in Canada
Utilizing Socio-Economic Indicators and Artificial Neural Networks to Predict COVID-19 Spread in Canadian Health Regions
Lahiru Wickramasinghe¹, Aditya Jain²
- The University of Winnipeg, 515 Portage Avenue, Winnipeg, R3B 2E9, Canada. (ORCID ID: 0000-0003-3851-5950)
- Indian Institute of Technology Bhubaneswar, Argul, Khordha, Odisha, 752050, India.
OPEN ACCESS
PUBLISHED:30 November 2024
CITATION: Wickramasinghe, L., and Jain, A., 2024. Utilizing Socio-Economic Indicators and Artificial Neural Networks to Predict COVID-19 Spread in Canadian Health Regions. Medical Research Archives, [online] 12(11).
https://doi.org/10.18103/mra.v12i11.6017
COPYRIGHT © 2024 European Society of Medicine. This is an open-access article distributed under the terms of the Creative Commons Attribution License, which permits unrestricted use, distribution, and reproduction in any medium, provided the original author and source are credited.
DOI https://doi.org/10.18103/mra.v12i11.6017
ISSN 2375-1924
Abstract
This study explores how well Artificial Neural Networks (ANNs) can predict the spread of COVID-19 across Canadian health regions, focusing on the impact of socio-economic factors. By examining a wide range of demographic, economic, and social indicators, we identify which factors play the biggest role in accurately forecasting the pandemic’s spread. The trained ANN model underscores the critical role of urbanization, population density, and social behaviors in densely populated regions, such as Toronto and Montreal, where transmission rates were higher. Conversely, remote regions like the Keewatin Yatthé and Labrador-Grenfell Health Authorities saw lower transmission due to geographic isolation and community-based controls. Additionally, the study highlights disparities in healthcare infrastructure, especially in ICU bed availability, which were more pronounced in urban areas. Vaccination rates were also identified as key in controlling the spread, with proactive public health efforts leading to higher rates in regions like the Northwest Territories. Our findings show that these socio-economic factors vary in importance from one region to another, offering valuable insights for public health planning. These findings provide practical advice for improving how resources are allocated and how public health strategies are developed, emphasizing the need to consider socio-economic differences in pandemic forecasting. This approach aims to help policymakers and health officials respond more effectively to current and future public health challenges.
Keywords
SARS-Cov-2, COVID-19; Machine Learning; Artificial Neural Network; Canadian Health Regions.
1. Introduction
The COVID-19 pandemic has upended lives around the world, forcing public health systems to confront challenges on a scale never seen before. This crisis has highlighted the urgent need for strong predictive models to guide decision-making and allocate resources effectively. As the pandemic unfolded, it became clear that the spread of the virus was not uniform, varying significantly across different regions and communities. These variations highlighted the need for localized forecasting models that account for regional socio-economic disparities. Accurate predictions of how the virus spreads are crucial for shaping effective public health responses and making informed decisions about resource allocation.
Incorporating socio-economic characteristics into modeling the spread of COVID-19 across Canadian health regions is essential because these factors play a pivotal role in determining how the virus affects different communities. Without accounting for these variables, models risk being incomplete, leading to ineffective public health interventions and misallocated resources. Socio-economic factors such as demographic data (e.g., population size and age group distributions), geographical characteristics (e.g., latitude, longitude, and health region size), health infrastructure (e.g., number of hospital beds and healthcare access), and vaccination data (e.g., number of doses administered) all contribute to a region’s vulnerability to COVID-19. For example, densely populated regions with limited healthcare access may experience faster spread and higher mortality rates, while areas with better healthcare infrastructure and higher vaccination rates may be more resilient to the virus. Ignoring these factors could lead to inaccurate predictions and ineffective public health policies that fail to meet the specific needs of different regions. Therefore, incorporating elements like population size, geographic location, healthcare resources, and vaccination uptake into models is crucial for guiding effective interventions that are tailored to each region’s unique characteristics.
This study used a machine learning technique, specifically an artificial neural network, to model the spread of COVID-19 across Canadian health regions using a range of socio-economic indicators. Here are some advantages of using machine learning techniques to model the spread of COVID-19 across Canadian health regions using a range of socio-economic indicators:
- Handling Complex Interactions: Machine learning can capture and model the complex interactions between various socio-economic factors and COVID-19 spread, which traditional models might miss.
- Improved Prediction Accuracy: By analyzing large datasets and identifying patterns, machine learning algorithms can improve the accuracy of predictions, helping to better anticipate outbreak hotspots.
- Adaptability to New Data: Machine learning models can be continuously updated with new data, allowing them to adapt to changing conditions and provide real-time insights.
- Identification of Key Predictors: Machine learning can identify the most significant socio-economic indicators that influence COVID-19 spread, guiding targeted interventions.
- Scalability Across Regions: These models can be applied to different health regions, offering scalable solutions that can be tailored to local socio-economic contexts.
- Reduction of Human Bias: Machine learning techniques minimize human biases in model development, leading to more objective and data-driven predictions.
- Efficient Resource Allocation: Accurate predictions enable better allocation of resources, such as vaccines and medical supplies, to areas that need them the most.
Artificial Neural Networks are particularly well-suited for modeling the spread of COVID-19 across Canadian health regions using a range of socio-economic indicators due to their ability to handle complex, non-linear relationships within large datasets. Here’s why ANNs stand out and offer several advantages over other machine learning techniques:
- Ability to Capture Non-Linear Relationships: COVID-19 transmission and its impact on different regions are influenced by a multitude of socio-economic factors, such as population density, income levels, healthcare access, and education. These factors often interact in non-linear ways that traditional statistical models may struggle to capture. ANNs, with their multi-layered structure, excel at identifying and modeling these intricate relationships, leading to more accurate predictions.
- Automatic Feature Extraction: Unlike some machine learning methods that require extensive feature engineering, ANNs can automatically learn and extract relevant features from the input data. This capability is particularly advantageous when dealing with diverse and complex socio-economic data, as it reduces the need for manual intervention and ensures that critical patterns are not overlooked.
- Robustness Against Noise and Variability: Artificial Neural Networks are designed to be resilient to noisy data and can generalize well, even when faced with variability in the input data. In the context of COVID-19 modeling, where data can be noisy or incomplete, ANNs provide a robust approach to making reliable predictions.
- Scalability and Flexibility: Artificial Neural Networks can easily scale to accommodate large datasets, which is crucial when analyzing COVID-19 data across multiple Canadian health regions. Their flexibility allows them to adapt to different types of input data, whether it’s demographic information, healthcare capacity, or economic indicators.
- Improved Prediction Accuracy: Due to their deep learning architecture, ANNs have the capacity to achieve higher prediction accuracy compared to simpler machine learning models. This is particularly important in a pandemic scenario, where accurate predictions can guide effective public health interventions and resource allocation.
- Adaptability to Dynamic Data: Artificial Neural Networks can be continuously trained with new data, making them adaptable to the evolving nature of the COVID-19 pandemic. This adaptability ensures that predictions remain relevant and accurate over time as new information becomes available.
1.1 CANADIAN HEALTH REGIONS
Canadian health regions are geographically defined areas established by provincial and territorial governments to manage and deliver health services tailored to the local population. These regions serve as administrative units through which public health policies, programs, and services are implemented. The specific boundaries and organization of health regions vary by province and territory, reflecting differences in population distribution, geography, and governance.
Each province and territory in Canada has its own method for defining health regions. For example, Ontario has Public Health Units (PHUs), while Alberta uses zones to organize its health services. Quebec has Integrated Health and Social Services Centres (CISSS) and Integrated University Health and Social Services Centres (CIUSSS), which further integrate healthcare delivery with social services. The number of health regions within each province or territory also varies significantly. For instance, British Columbia has five health authorities, Alberta has five health zones, and Ontario has 34 PHUs.
Although Ontario has named health regions, we considered the public health regions as the health regions for our study. This approach allows us to include a greater number of regions by focusing on public health regions. Public Health Units (PHUs) in Ontario are geographically defined areas governed by local boards of health that are responsible for delivering public health services and programs to communities within their jurisdiction. Each PHU operates under the authority of the Ontario Ministry of Health and is tasked with implementing a wide range of public health initiatives, including disease prevention, health promotion, and health protection. The services provided by PHUs cover essential areas such as immunization programs, infectious disease control, sexual health services, nutrition, environmental health inspections, and emergency preparedness. Ontario is divided into 34 Public Health Units, each serving a specific population and geographic area. These units are typically organized based on municipal boundaries, which can include one or multiple municipalities.
Quebec’s health regions, known as “régions sociosanitaires,” are administrative divisions established to organize and deliver healthcare and social services across the province. The province is divided into 18 health regions, each managed by an Integrated Health and Social Services Centre (CISSS) or, in urban areas with universities, an Integrated University Health and Social Services Centre (CIUSSS). These regions are responsible for providing a wide range of services, including primary and specialized healthcare, mental health support, social services, and community health initiatives. Their duties also include coordinating resource allocation, managing population health, promoting public health, and responding to emergencies. By tailoring services to the specific needs of their populations, Quebec’s health regions play a vital role in ensuring accessible and comprehensive healthcare across the province.
British Columbia (BC) is divided into five regional health authorities that are responsible for delivering and managing health services across the province. These regions, Fraser Health, Interior Health, Northern Health, Vancouver Coastal Health, and Island Health are geographically defined to cover the diverse populations and needs of BC’s urban, rural, and remote areas. Each health authority is tasked with providing a full range of healthcare services, including primary care, hospital care, mental health services, public health initiatives, and specialized medical services. Their duties also involve health promotion, disease prevention, and ensuring equitable access to healthcare. Additionally, BC has a provincial health authority, the Provincial Health Services Authority (PHSA), which coordinates specialized health services across the region, including cancer care, emergency health services, and public health labs. Together, these health authorities ensure that residents of British Columbia receive comprehensive and coordinated healthcare tailored to their regional needs.
In the Prairie Provinces of Canada; Alberta, Saskatchewan, and Manitoba; health regions are defined to effectively manage and deliver healthcare services tailored to their diverse populations. In Alberta, healthcare is organized under Alberta Health Services (AHS), which is divided into five zones: North Zone, Edmonton Zone, Central Zone, Calgary Zone, and South Zone. Each zone is responsible for providing a wide range of healthcare services, including hospitals, primary care, mental health services, and emergency medical services, to both urban and rural areas within its jurisdiction. Saskatchewan operates under a single health authority known as the Saskatchewan Health Authority (SHA), which consolidated Six (Far North, North, Central, Regina, South and Saskatoon) health regions into one province-wide organization. This centralized system is responsible for delivering healthcare services across the entire province, including hospitals, long-term care, public health programs, and mental health services, ensuring consistent and equitable access for all residents.
Manitoba is divided into five regional health authorities: Winnipeg Regional Health Authority, Southern Health-Santé Sud, Prairie Mountain Health, Interlake-Eastern Regional Health Authority, and Northern Regional Health Authority. Each authority manages healthcare services within its geographic area, overseeing hospitals, community health programs, and public health initiatives.
The Atlantic Provinces of Canada; Newfoundland and Labrador, Prince Edward Island, Nova Scotia, and New Brunswick; each have healthcare services managed by regional health authorities tailored to their geographic and population needs. Newfoundland and Labrador is divided into four regional health authorities: Eastern Health, Central Health, Western Health, and Labrador-Grenfell Health, each overseeing healthcare delivery in their respective regions. Prince Edward Island has a single health authority, Health PEI, responsible for managing all healthcare services across the island. Nova Scotia operates under the Nova Scotia Health Authority (NSHA), which administers healthcare throughout the province, with four zones; Central, Eastern, Northern and Western. New Brunswick is divided into seven health regions: Moncton, Saint John, Fredericton, Miramichi, Edmundston, Campbellton, and Bathurst which are managed by the two regional health authorities, Horizon Health Network and Vitalité Health Network. The health regions in the Atlantic Provinces are responsible for delivering comprehensive healthcare services, including hospital care, primary care, mental health, and public health programs, to ensure equitable access across their populations. They also manage healthcare facilities, respond to public health emergencies, and promote overall community health and well-being in their respective regions.
The Northern Territories of Canada; Yukon, Northwest Territories, and Nunavut; each have unique health regions tailored to their vast and sparsely populated landscapes. Yukon is served by a single health region managed by the Yukon Health and Social Services, which oversees healthcare delivery across the territory, including Whitehorse and the remote communities. The Northwest Territories has a single health region, which is managed by the Northwest Territories Health and Social Services Authority (NTHSSA). Nunavut also has a single health region, which is managed by the Nunavut Department of Health. Although each Northern Territory could be divided into more health regions, the availability of information is very limited, so we may need to aggregate some regions to create health regions based on the available data. The health regions in the Northern Territories focus heavily on providing healthcare to remote and isolated communities, often requiring specialized approaches to deliver services across vast, sparsely populated areas. Their duties also emphasize culturally appropriate care for Indigenous populations, reflecting the unique demographic and geographic challenges of the region.
1.2 SOCIO-ECONOMIC FACTORS IN CANADIAN HEALTH REGIONS
Socio-economic factors play a crucial role in shaping the health and well-being of populations, influencing access to resources, health behaviors, and overall quality of life. In Canada, these factors include income levels, education, employment status, housing conditions, and access to healthcare, among others. Data on these socio-economic factors are meticulously collected and maintained by various governmental agencies, such as Statistics Canada and the Canadian Institute for Health Information (CIHI). These organizations gather data through national surveys, censuses, and administrative records, which are then disaggregated by health regions to provide a granular understanding of the socio-economic landscape across the country. This localized data is vital for public health planning, policy-making, and resource allocation, ensuring that interventions are targeted effectively to address the unique needs of different communities.
When compared globally, Canada’s socio-economic factors generally reflect a high standard of living, with strong social safety nets, universal healthcare, and relatively low levels of poverty and unemployment. However, these factors also reveal disparities when contrasted with other high-income countries. For instance, Canada’s income inequality is more pronounced than in some European nations, though it remains less severe than in countries like the United States. Education levels in Canada are among the highest in the world, with a significant proportion of the population holding post-secondary degrees. Additionally, Canada’s health infrastructure, including the number of hospital beds and healthcare access, varies by region, affecting healthcare outcomes during crises like the COVID-19 pandemic. The country’s universal healthcare system ensures that all citizens have access to medical services, but the distribution of these services is uneven, particularly in remote areas. Disparities in vaccination rates across health regions also highlight regional differences in public health responses, with factors like population density and healthcare access playing a critical role. Challenges such as housing affordability, regional economic disparities, and the unequal distribution of healthcare resources continue to impact socio-economic outcomes, highlighting areas where Canada lags behind its global peers.
Within Canada, socio-economic factors such as population size, age group distributions, geographic characteristics, health infrastructure, and vaccination efforts vary significantly across provinces and health regions, reflecting the country’s diverse population and geography. For instance, provinces like Ontario and British Columbia tend to have higher income levels, larger populations, and better access to healthcare compared to rural and remote regions, where physician shortages, limited healthcare infrastructure, and smaller populations create challenges for effective public health interventions. In areas like northern health regions, which include Indigenous communities, there are higher levels of poverty and limited access to healthcare, impacting COVID-19 vaccination rates and health outcomes. The geographic isolation of regions such as Nunavut and the Région des Terres-Cries-de-la-Baie-James has contributed to lower vaccination rates due to healthcare access issues and logistical challenges. Conversely, more urbanized regions like the City of Toronto and Montréal benefit from higher vaccination rates and robust health infrastructure, enabling better control over virus transmission. These disparities underscore the importance of targeted public health measures that account for the unique socio-economic challenges of different regions across Canada.
This paper is structured as follows: Section 2 reviews the statistical and machine learning models previously employed to analyze the spread of COVID-19. In Section 3, we present a methodology based on artificial neural networks. Section 4 applies the proposed methods to model the spread of COVID-19 across Canadian health regions, utilizing various socio-economic indicators. Section 5 provides a brief discussion of the results and methodologies presented in the paper, followed by the concluding remarks in Section 6.
2. Literature Review
The analysis of COVID-19 data has employed a variety of statistical models and machine-learning techniques, each tailored to address specific aspects of the pandemic’s dynamics. Statistical methods and machine learning methods both aim to analyze and interpret data, but they differ in their approaches and objectives. Statistical methods, rooted in classical statistics, often focus on understanding relationships between variables, hypothesis testing, and making inferences about populations based on sample data. These methods typically rely on well-defined models and assumptions, such as linear regression or ANOVA. In contrast, machine learning methods emphasize predictive accuracy and are designed to handle large and complex datasets. Machine learning techniques, such as neural networks or support vector machines, are often less concerned with the underlying statistical assumptions and more focused on optimizing predictive performance through iterative training on data. While statistical methods provide insights into the data’s structure and significance, machine learning methods excel in making accurate predictions and discovering patterns in high-dimensional or unstructured data. First, we explore some statistical models that have been used to model COVID-19 data. The statistical models can broadly be categorized into traditional epidemiological models, regression models, time series forecasting models and spatial models. One of the foundational models used in the analysis of infectious diseases, including COVID-19, is the Susceptible-Infected-Recovered (SIR) model. This model helps in understanding the spread of the virus by categorizing the population into three compartments: susceptible, infected, and recovered. discussed the application of the SIR model in evaluating the effectiveness of large-scale anti-contagion policies during the pandemic. Cooper et al.6 discuss the application of the Susceptible-Infectious-Recovered (SIR) model to predict and analyze the spread of COVID-19 across various communities, focusing on the impact of different parameters on the outbreak dynamics. Liu et al.18 explore the COVID-19 epidemic using a modified time-dependent SIR model that incorporates nonextensive statistics to better represent the dynamic societal impacts and control measures. Next, we will focus on exploring regression methods for modeling COVID-19 data.
Regression models, including count regression models, have been instrumental in analyzing the relationship between various predictors and COVID-19 outcomes. Specifically, count regression models like the negative binomial distribution have been applied to effectively analyze COVID-19 data. Chan et al.5 presented a statistical study on modeling and analyzing the daily incidence of COVID-19 across eighteen countries, demonstrating that count regression models, particularly the negative binomial distribution with a log link function, are effective for short-term predictions of new daily cases. Oztig and Askin21 examine the relationship between human mobility and the spread of COVID-19 using negative binomial regression analysis, providing insights into how movement patterns contribute to the pandemic’s dynamics. Kremer et al.14 emphasize the importance of accurately modeling the distribution of secondary COVID-19 cases caused by an infectious individual. While the negative binomial distribution is frequently used, the study suggests that alternative distributions like the Poisson-lognormal may provide a better fit for data with considerable heterogeneity. These models are well-suited for handling count data, such as the number of confirmed cases or deaths, and allow for the incorporation of multiple covariates to enhance predictive accuracy, providing valuable insights into the factors influencing the spread and impact of the virus.
Next, we will shift our focus to examining time series models for analyzing COVID-19 data. Time series models, particularly the Autoregressive Integrated Moving Average (ARIMA) model, have been extensively used to predict the future trajectory of COVID-19 cases. Kumar and Susan15 discuss the use of ARIMA and Prophet time series forecasting models to predict the spread of COVID-19 across various countries, demonstrating that the ARIMA model is more effective for forecasting COVID-19 prevalence, which can aid governments in planning policies to contain the virus. Somyanonthanakul et al.27 explore the use of advanced time series models combined with association rule mining techniques to predict future COVID-19 cases, aiming to enhance the accuracy and reliability of pandemic forecasting efforts. These models are particularly valuable for short-term forecasting and understanding trends over time. Next, we will direct our attention to exploring spatial models for analyzing COVID-19 data.
Spatial models have been used to understand the geographical spread of COVID-19. Cordes and Castro7 use a spatial model to identify clusters with low testing and high positivity rates, often correlated with lower income, less education, and minority populations, while areas with higher income and predominantly white populations had more testing and lower positivity rates. Thomas et al.28 explore how geographically detailed diffusion models, which account for the spatial distribution of interpersonal networks and declining interaction probabilities with distance, reveal significant impacts on the timing and severity of local COVID-19 outbreaks, demonstrating the limitations of standard SIR models that assume uniform local mixing. Next, we will address some of the complex structures in the data relevant to modeling COVID-19.
Analyzing COVID-19 data with statistical models varies in complexity depending on data characteristics like sparsity. Wickramasinghe et al.29 proposed a Bayesian shrinkage-type estimator to estimate COVID-19 age-region-specific counts by borrowing information across other populations and categories, which is particularly beneficial for addressing data sparsity in smaller health regions with limited observations. Hadley et al.10 use Bayesian methods to handle the complexity of agent-based models by incorporating aggregated hospital data to account for factors like comorbidities and testing status, thereby enhancing the interpretability and accuracy of predictions in scenarios with limited information. Next, we explore some Machine learning methods that have been used to model COVID-19 data.
Clustering techniques, such as k-means and hierarchical clustering, have been utilized to analyze COVID-19 data by grouping similar cases based on various features. For example, Zarikas et al.32 introduce a novel clustering analysis that groups countries based on active COVID-19 cases, adjusting for population and area, providing valuable insights for policymakers across multiple disciplines using Johns Hopkins epidemiological data. The advantages of clustering include its ability to uncover natural groupings within the data, which can inform targeted interventions and resource allocation. Clustering is particularly valuable in epidemiological studies, where identifying subgroups of patients can lead to more personalized treatment approaches. While clustering focuses on grouping data points based on similarity, the next technique, natural language processing (NLP), analyzes unstructured text data, showcasing a different dimension of machine learning applications in the context of COVID-19.
Deep learning is another powerful machine learning technique that has been extensively applied to COVID-19 data analysis, particularly in image classification tasks. Deep learning models, such as convolutional neural networks (CNNs), have shown remarkable success in distinguishing between COVID-19 and other types of pneumonia from chest X-rays and CT scans. Shorten et al.25 highlight the significant role of Deep Learning in combating the COVID-19 pandemic, covering its applications across Natural Language Processing, Computer Vision, Life Sciences, and Epidemiology, while also addressing key limitations such as interpretability and data privacy. The advantages of deep learning include its ability to automatically learn hierarchical features from raw data, which reduces the need for manual feature extraction and allows for the processing of large datasets efficiently. This capability is particularly beneficial in the context of COVID-19, where rapid and accurate diagnosis is crucial. While both radiomics and deep learning leverage imaging data, deep learning’s reliance on end-to-end learning contrasts with radiomics’ feature extraction approach, leading to different methodologies in handling the data.
One prominent machine learning technique used to analyze COVID-19 data is Convolutional Neural Networks (CNNs), particularly in the context of medical imaging. Convolutional Neural Networks have been effectively employed for the automatic detection of COVID-19 from X-ray images, as demonstrated by Apostolopoulos and Mpesiana3. Their study utilized transfer learning with CNN architectures, achieving an impressive accuracy of 97.82% in distinguishing COVID-19 cases from other conditions. The primary advantage of CNNs lies in their ability to automatically extract features from images, reducing the need for manual feature engineering. This capability is particularly beneficial in medical imaging, where subtle patterns can indicate disease presence. Furthermore, the use of transfer learning allows models to leverage pre-trained weights from large datasets, making it feasible to achieve high performance even with limited COVID-19 image data. However, while CNNs excel in image classification, they require substantial amounts of labelled data to train effectively, which can be a limitation in early pandemic stages when data availability is scarce.
In contrast to CNNs, Decision trees offer a non-linear approach to classification and regression tasks. Decision trees partition the data into subsets based on feature values, creating a model that is easy to visualize and interpret. They have been employed in various COVID-19 studies to classify patients based on symptoms and risk factors, providing clear decision rules for healthcare professionals. For instance, Yoo et al.31 demonstrate the feasibility of a deep learning-based decision-tree classifier for detecting COVID-19 from chest X-ray images, achieving an accuracy of 95% and providing a rapid, effective tool for pre-screening and triage before RT-PCR results are available. The primary advantage of decision trees lies in their ability to capture non-linear relationships and interactions without requiring extensive data preprocessing. However, they can be prone to overfitting, especially with small datasets, which may lead to less generalizable models.
Naive Bayes is a probabilistic machine learning technique based on Bayes’ theorem, which assumes independence among predictors. This method has been employed in analyzing COVID-19 data, particularly in sentiment analysis of social media posts or news articles related to the pandemic. Mansour et al.19 introduce the Feature Correlated Naïve Bayes (FCNB) strategy to enhance the detection of COVID-19 cases, achieving 99% accuracy by incorporating a feature selection phase, feature clustering, master feature weighting, and a modified Naïve Bayes algorithm that accounts for feature correlations. The advantages of Naive Bayes include its speed, ease of implementation, and effectiveness in handling large datasets with many features. Additionally, it performs well even with a relatively small amount of training data, making it a practical choice in scenarios where labeled data is scarce. While Naive Bayes is less complex than Random Forest, Support Vector Machines, or deep learning, its probabilistic nature allows for straightforward interpretation of results. This contrasts with the more intricate models discussed earlier, highlighting a trade-off between interpretability and predictive power. Following Naive Bayes, K-Nearest Neighbors (KNN) is another straightforward machine-learning technique that can be utilized for classification tasks in COVID-19 data analysis.
K-Nearest Neighbors (KNN) is another machine learning technique that has been applied to COVID-19 data analysis, particularly for classification tasks. K-Nearest Neighbors operate on the principle of proximity, classifying a data point based on the majority class of its k-nearest neighbors in the feature space. Shaban et al.24 introduce an enhanced K-Nearest Neighbor (EKNN) classifier for detecting COVID-19 from chest CT images, which improves upon the traditional KNN by incorporating heuristics to select only the most relevant neighbors for classification, thereby increasing accuracy and reducing the time required for detection. The primary advantages of KNN include its simplicity and effectiveness in scenarios where the decision boundary is irregular. Additionally, KNN does not require a training phase, making it computationally efficient for smaller datasets. However, KNN can struggle with high-dimensional data due to the curse of dimensionality, which can lead to decreased performance. This limitation contrasts with the next technique, Random Forest, which excels in handling high-dimensional datasets and provides robust predictions.
Random Forests represent a different approach to machine learning that is particularly useful for analyzing structured data, such as patient demographics and clinical features. Random Forests are ensemble learning methods that build multiple decision trees and aggregate their predictions to improve accuracy and control overfitting. Galasso et al.9 use random forests that can handle a wide range of input features, including non-linear interactions, without requiring strong parametric assumptions, making them well-suited for complex and diverse datasets like those used in predicting COVID-19 cases. Additionally, random forests are less susceptible to overfitting and can provide robust predictions even when the underlying data is noisy or incomplete, as demonstrated by their performance in forecasting COVID-19 case numbers at the county level during the pandemic.
Another machine learning technique that has gained traction in COVID-19 research is Support Vector Machines (SVM), which are particularly effective for classification tasks in high-dimensional spaces. Support Vector Machines are a supervised learning algorithm that excels in classification tasks by finding the optimal hyperplane that separates different classes in the feature space. Batista et al.4 developed an SVM to predict COVID-19 diagnosis in emergency care patients, demonstrating its potential to enhance early detection and triage during the pandemic. In the context of COVID-19, SVMs have been utilized to classify patients based on clinical and demographic data, helping to identify those at higher risk for severe disease. The primary advantage of SVMs is their effectiveness in high-dimensional spaces, where they can perform well even with a limited number of samples. Additionally, SVMs are robust to overfitting, especially when using kernel functions to transform the input space. While CNNs and Random Forests focus on different types of data, SVMs provide a powerful alternative for classification tasks, particularly when dealing with complex, high-dimensional datasets.
Gradient Boosting Machines (GBM) represent another powerful ensemble learning technique that has been employed to analyze COVID-19 data. GBMs build models in a stage-wise fashion, where each new model attempts to correct the errors made by the previous ones. This method has been particularly useful for predicting COVID-19 outcomes and understanding the impact of various risk factors. Shrivastava and Jha26 investigate the impact of meteorological parameters on COVID-19 transmission in India, finding that a gradient boosting model (GBM) accurately predicts active and recovered cases based on factors such as temperature and humidity. The advantage of GBMs lies in their ability to handle various types of data and their flexibility in modeling complex relationships. They often outperform other models in terms of predictive accuracy, making them a popular choice in competitive machine learning scenarios. While SVMs focus on finding optimal hyperplanes for classification, GBMs enhance predictive performance through iterative learning, showcasing the diversity of machine-learning techniques available for COVID-19 analysis.
XGBoost (Extreme Gradient Boosting) is another machine learning technique that has been effectively utilized for COVID-19 data analysis. Extreme Gradient Boosting is an ensemble learning method that builds upon decision trees, optimizing them through gradient boosting techniques to enhance predictive performance. Its advantages include high accuracy, speed, and the ability to handle missing data and outliers effectively. Fang et al.8 use XGBoost to predict the trend of COVID-19 in the USA, and its performance was compared with the ARIMA model to assess which provided more accurate forecasts of the outbreak’s progression. Extreme Gradient Boosting’s regularization techniques help prevent overfitting, making it a robust choice for modeling COVID-19 outcomes where data can be noisy and variable. Moreover, XGBoost provides insights into feature importance, similar to Random Forest, allowing researchers to identify key factors influencing COVID-19 spread. While Neural Networks excel in capturing complex patterns, XGBoost offers a more interpretable and computationally efficient alternative, bridging the gap between model complexity and usability in public health contexts.
In the next section, we propose an artificial neural network model that utilizes socio-economic indicators to predict the spread of COVID-19 in Canadian health regions.
3. Methods
A neural network is a computational model inspired by the way biological neural networks in the human brain process information. It consists of interconnected nodes, or neurons, organized in layers: an input layer, one or more hidden layers, and an output layer. Each connection between neurons has an associated weight that adjusts as learning proceeds, allowing the network to learn complex patterns and relationships within data. Neural networks are particularly effective for tasks such as image and speech recognition, natural language processing, and time-series forecasting due to their ability to model non-linear relationships and capture intricate data structures. In recent years, deep artificial neural networks, including recurrent networks, have achieved significant success in pattern recognition and machine learning, Schmidhuber23 provides a concise summary of the historical development and key concepts in deep learning, including supervised, unsupervised, and reinforcement learning, as well as evolutionary computation.
Neural networks differ from traditional machine learning techniques primarily in their architecture and learning capabilities. Unlike linear models, which assume a direct relationship between input and output, neural networks can learn complex, non-linear mappings through multiple layers of processing. This allows them to excel in tasks involving high-dimensional data, such as images and audio. Additionally, neural networks automatically extract features from raw data, reducing the need for manual feature engineering, which is often required in other machine learning methods. Their ability to generalize well to unseen data, especially when trained on large datasets, further enhances their performance compared to simpler models like logistic regression or decision trees. Sarker22 highlights the critical role of deep learning, particularly neural networks, in analyzing large-scale data from various sectors like cybersecurity, healthcare, and smart cities, showcasing its potential to significantly enhance the intelligence and capabilities of automated applications.
An Artificial Neural Network (ANN) is a specific type of neural network that mimics the structure and function of biological neural networks. Artificial Neural Networks consist of interconnected nodes (neurons) that process input data and produce output through a series of transformations. Each neuron applies an activation function to its input, determining whether it should be activated based on the weighted sum of its inputs. Artificial Neural Networks can be shallow (with only one hidden layer) or deep (with multiple hidden layers), with deep learning being a subset of machine learning that focuses on training deep neural networks. Artificial Neural Networks are widely used in various applications, including image recognition, natural language processing, and predictive analytics1. Jain et al.11 discuss the development of artificial neural networks (ANNs), their architecture, learning processes, and commonly used models, highlighting their successful application in character recognition.
The terms “neural network” and “artificial neural network” are often used interchangeably; however, there is a subtle distinction. “Neural network” is a broader term that encompasses both biological neural networks and artificial implementations. In contrast, “artificial neural network” specifically refers to the computational models designed to simulate the behavior of biological neurons. While both types of networks share similar principles of information processing, artificial neural networks are explicitly designed for machine learning tasks and are implemented using algorithms and computational frameworks, whereas biological neural networks are naturally occurring systems in living organisms.
Artificial neural networks have been effectively utilized to analyze COVID-19 data across various domains, including medical imaging, epidemiological modeling, and clinical decision support systems. For instance, Niazkar and Niazkar20 use ANNs effectively to predict the COVID-19 outbreak by modeling the confirmed cases based on historical data, with models incorporating a 14-day period showing the highest accuracy in forecasting daily cases. Additionally, neural networks have been employed to predict infection rates and assess the severity of COVID-19 cases based on clinical features. Their ability to learn complex patterns and relationships from large datasets makes them a valuable tool in understanding the dynamics of the COVID-19 pandemic and informing public health responses.
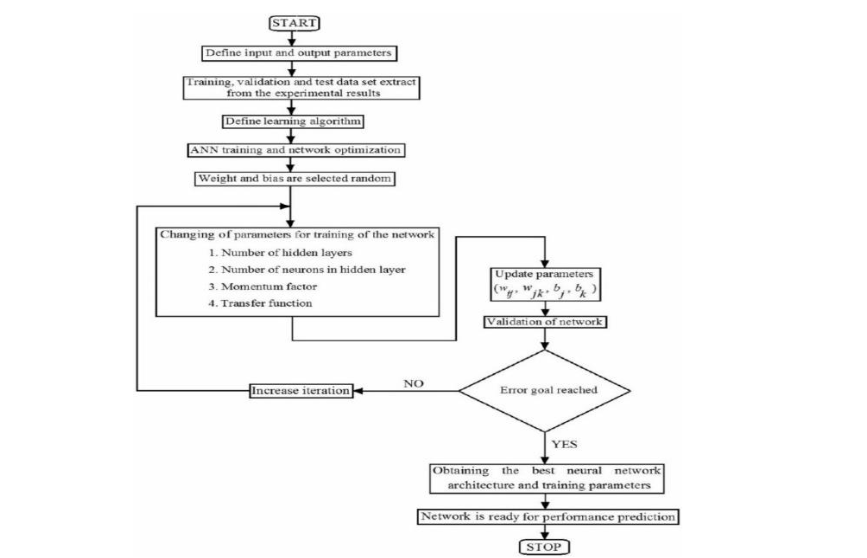
Here’s a detailed description of each step tailored to COVID-19 prediction:
- Start: The process begins by initiating the design and training of the ANN model to predict the spread of COVID-19 across different regions.
- Define input and output parameters: Input parameters, such as demographic data, geographical data, health metrics, and vaccination rates, are defined. The output parameter would be the predicted spread of COVID-19 cases or infection rates.
- Extract training, validation, and test datasets from experimental results: The dataset is divided into three parts—training, validation, and test sets. These sets consist of COVID-19-related data collected from Canadian health regions, ensuring the model can learn, validate its predictions, and test its performance accurately.
- Define learning algorithm: An appropriate learning algorithm is selected to train the ANN. For COVID-19 predictions, a backpropagation learning algorithm could be used, enabling the network to minimize errors in predicting infection rates by adjusting weights.
- ANN training and network optimization: This step involves initiating the training of the neural network by feeding the input data and adjusting network parameters such as weights and biases. The network learns the relationship between input data (e.g., population density, and healthcare resources) and the spread of COVID-19 through this process.
- Weights and biases are selected randomly: Initially, the weights and biases for the neural network nodes are selected randomly. These values are updated as training progresses to optimize the network’s predictions.
- Changing of parameters for training of the network: During training, different network parameters are adjusted to optimize performance. These include:
- Number of hidden layers: The number of hidden layers is tuned to ensure the model can capture the complex relationships between inputs like socio-economic factors and the virus’s spread.
- Number of neurons in hidden layers: The number of neurons in each hidden layer is varied to enhance learning.
- Momentum factor: This parameter controls the speed of learning and helps to avoid getting stuck in local minima during optimization.
- Transfer function: The transfer (or activation) function is chosen, determining how input is transformed into output at each node in the network.
- Validation of the network: After training, the model is validated using the validation dataset. This checks whether the model generalizes well to unseen data, ensuring that it can predict the spread of COVID-19 in different health regions.
- Update parameters: The weights and biases are updated during training using backpropagation and gradient descent to reduce the error between predicted and actual COVID-19 case numbers.
- Error goal reached: This decision point checks if the model has reached a predefined error threshold. If the error is still above the target, the network parameters are updated and training continues with another iteration.
- Increase iteration: If the error goal is not reached, the number of training iterations is increased, and the model undergoes further optimization.
- Error goal reached (Yes): Once the error threshold is met, the training is considered successful.
- Obtain the best neural network architecture and training parameters: At this stage, the best-performing neural network architecture is selected, along with the optimal training parameters that have been tuned through the previous steps.
- Network is ready for performance prediction: The trained and optimized ANN model is now ready to predict the future spread of COVID-19 in Canadian health regions based on the input factors like demographics, vaccination data, and health infrastructure.
- Stop: The process concludes once the network is ready to predict and is deployed for forecasting COVID-19 cases, helping inform public health decisions.
This flowchart demonstrates a systematic approach to building an effective ANN model, ensuring that the network is well-optimized and capable of accurate predictions of COVID-19 spread in Canadian health regions.
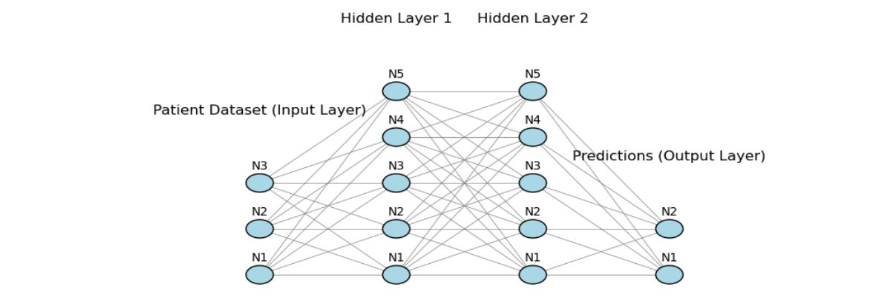
The architecture of the ANN used for predicting the spread of COVID-19 consists of three main components: the input layer, two hidden layers, and the output layer. Here’s a detailed description of each layer in relation to the datasets and flowchart (Figure 1) provided earlier.
The input layer represents the initial data fed into the neural network. In this context, the input nodes (N1, N2, N3, etc.) correspond to various features of the COVID-19 datasets we discussed earlier, such as:
- Demographic data (e.g., population size, age group distributions)
- Geographical data (e.g., latitude, longitude, and area of health regions)
- Health infrastructure data (e.g., number of hospital beds, healthcare access)
- Vaccination data (e.g., number of doses administered)
Each node (N1, N2, N3, etc.) represents a different feature from these datasets, and collectively they provide the network with crucial inputs about the socio-economic and health characteristics of Canadian health regions.
The two hidden layers (Hidden Layer 1 and Hidden Layer 2) contain nodes (N1-N5) that perform the intermediate computations. These layers enable the network to learn complex patterns in the input data. For example, they might capture non-linear relationships between factors like population density, healthcare availability, and COVID-19 case spread. Here’s the role of each hidden layer:
Hidden Layer 1: This layer captures basic interactions between the input features (e.g., how population density and vaccination rates jointly impact transmission).
Hidden Layer 2: This layer refines the learned patterns from Hidden Layer 1 and adds complexity, helping the network improve its predictive power by recognizing deeper associations (e.g., how health infrastructure and vaccination data together influence outcomes across regions).
As indicated in the earlier flowchart, the training process involves adjusting the weights and biases associated with these layers. These parameters are optimized through iterations, allowing the network to minimize errors in predictions.
The output layer represents the final predictions made by the neural network, based on the features provided in the input layer and the transformations applied by the hidden layers. In this case, the output nodes (N1, N2) would predict:
- COVID-19 case numbers or infection rates for a given health region
- Potential hotspots based on demographic and geographical inputs
This prediction is key for forecasting the spread of the virus across Canadian health regions, providing actionable insights for public health interventions. The importance of each layer is given below:
- Input Layer: It ensures that all relevant data (socio-economic, geographic, and health infrastructure) is considered for accurate predictions.
- Hidden Layers: These layers enable the model to capture the intricate patterns and relationships between the inputs, which is critical for accurately predicting how the virus spreads.
- Output Layer: Provides actionable insights into COVID-19 spread, enabling authorities to deploy interventions based on predicted hotspots and high-risk areas.
More technical details about the ANN architecture can be found in Wickramasinghe and Jain30. This ANN architecture helps create a model capable of learning from multiple data sources and improving its ability to predict the spread of COVID-19 in Canadian health regions by leveraging various socio-economic and geographical factors that is discussed in Section 4.
4. Results
4.1 DATASETS
To predict the spread of COVID-19 across Canadian health regions, we combine several datasets that provide different types of information. By integrating data on COVID-19 cases, demographics, geography, health infrastructure, and vaccinations, we can analyze the multifaceted impact of socio-economic factors on the pandemic’s spread. Combining these datasets allows us to identify key socio-economic characteristics that may correlate with higher infection rates, deaths, or vaccination disparities. This approach helps build a comprehensive model, enabling targeted public health responses and resource allocation to mitigate the pandemic’s impact across various health regions in Canada.
The COVID-19 Data serves as the geographical foundation for tracking the virus across Canadian health regions. Although it does not contain direct data on cases or outcomes, it offers a structural framework for aligning other datasets and conducting spatial analyses. The ability to link health regional data is vital for examining the pandemic’s spread at health region levels, providing a clearer view of how COVID-19 moves across regions.
The Demographic Data is crucial in understanding the distribution of COVID-19’s effects on different population groups. By providing information on age and gender demographics, it allows us to analyze how various population segments; such as older adults or specific gender groups; are more vulnerable to the virus. This data helps in evaluating the pandemic’s demographic patterns, which are essential for tailoring health policies and prioritizing vulnerable populations.
The Geographical Data enhances spatial analysis by offering details about the size, location, and population density of different Canadian health regions. Geography plays a critical role in understanding how the virus spreads across Canadian health regions, as highly populated cities within these regions and their proximity to urban centers or neighboring areas can significantly influence transmission patterns. This data aids in mapping potential hotspots and regions at higher risk, enabling more targeted and efficient public health interventions.
The Health Data offers key insights into the preparedness of different Canadian health regions to handle COVID-19 outbreaks. By analyzing healthcare access, hospital bed availability, and overall health infrastructure, we can predict which health regions may struggle to contain the virus due to inadequate resources. This data is essential for identifying health regions that may require additional healthcare support or investment to manage pandemic-related challenges effectively.
Finally, the Vaccination Data is pivotal in understanding how vaccination efforts are influencing the course of the pandemic. Analyzing vaccination rates, doses administered, and the distribution of vaccines across Canada helps to assess the relationship between immunization levels and COVID-19 case reductions. This dataset is vital for identifying health regions where low vaccination rates may contribute to ongoing transmission, guiding vaccination campaigns to reach underserved areas.
4.2 DATA PREPROCESSING
Data preprocessing is a crucial step in preparing the datasets for predicting the spread of COVID-19 across Canadian health regions. Effective preprocessing ensures that the data is clean, consistent, and appropriately scaled, enabling accurate predictions and minimizing the risk of biased or erroneous results. For this study, the preprocessing tasks included handling missing data and applying scaling techniques, both of which were essential for creating a robust predictive model.
Missing Data Handling involved addressing gaps in key columns, particularly in age group breakdowns and gender-based population data. Missing values were filled using the median of each column, which is a reliable method in scenarios where data exhibits large variations across different health regions. By using the median, the preprocessing avoided the pitfalls of mean imputation, which can be skewed by outliers in population data17. This approach ensures that no region or group was excluded from the analysis due to incomplete data, maintaining the integrity of the model and ensuring that the predictions reflect the diverse socio-economic conditions across Canadian health regions. Handling missing data is critical for COVID-19 modeling, as missing or inaccurate demographic information can lead to flawed predictions, particularly in regions with distinct age distributions or healthcare needs.
Scaling of the data was performed using Standard Scaler, which normalizes the input features to have a mean of zero and a standard deviation of one. This step is especially important when feeding the data into machine learning models, such as neural networks, that are sensitive to the relative magnitude of input features. For instance, variables like population size, age group distribution, and vaccination numbers can differ vastly in their numerical ranges. Without scaling, larger values could disproportionately influence the learning process, making it harder for the model to capture the nuanced relationships between smaller-scale features and the spread of COVID-19. Scaling ensures that all features contribute equally, allowing the model to learn efficiently and make more accurate predictions16.
The importance of these preprocessing steps cannot be understated when it comes to predicting the spread of COVID-19. Data quality directly affects the model’s ability to accurately capture trends and forecast future cases. In a highly complex situation like the pandemic, with vast differences in socio-economic factors across health regions, ensuring the data is complete, unbiased, and properly scaled is fundamental for providing actionable insights for public health decision-making.
4.3 MODEL ARCHITECTURE
In this study, an Artificial Neural Network (ANN) was used to model the spread of COVID-19 across Canadian health regions by analyzing demographic and socio-economic factors. The selected model architecture aimed to capture the non-linear relationships between population characteristics and regional vulnerability to COVID-19 outcomes. The analysis was designed to leverage the available population data and predict the potential spread of the virus across different health regions based on these inputs.
The input features selected for the model included key population-related variables: total population, male population, female population, and population distribution across age groups (e.g., 0-11, 12-19, 20-29, etc.). These features were chosen because they capture the overall size of the population as well as its structure in terms of age and gender. Population size and demographic breakdowns are critical factors influencing health outcomes and the transmission dynamics of infectious diseases, as younger and older age groups may experience different levels of susceptibility and exposure to the virus. Additionally, geographical features such as total area size, urban and rural area proportions, and the latitude and longitude of each region are included to account for location-based variations that could affect transmission patterns. Also, health data and vaccination data have been incorporated into the model. This combination of demographic, health, and geographic data helps the model capture the complex interactions between population characteristics and spatial factors, which is crucial for modeling COVID-19 spread across Canadian health regions.
The ANN model was designed with two hidden layers to facilitate deep learning of the complex patterns in the input data. The first hidden layer contained 64 neurons with the Rectified Linear Unit (ReLU) activation function2. Rectified Linear Unit was chosen because it introduces non-linearity into the model while avoiding the vanishing gradient problem, thereby enabling the network to learn intricate relationships in the data. The second hidden layer comprised 32 neurons, also utilizing the ReLU activation function. This layer aimed to further refine the feature representations learned by the first layer, improving the model’s predictive power by capturing more abstract patterns in the data.
The output layer consisted of a single neuron with a linear activation function. Since the task was to predict a continuous variable; such as regional population or other health-related outcomes—a linear activation function was appropriate to ensure the output matched the continuous nature of the target variable.
To evaluate the performance of the model, the Mean Squared Error (MSE) loss function was employed. MSE is a standard loss function for regression tasks, measuring the average squared difference between the predicted and actual values33. Minimizing MSE helps ensure that the model’s predictions closely align with the observed data, which is critical in predicting population characteristics that influence the spread of COVID-19.
The model training process used the Adam optimizer13, which combines the benefits of both RMSprop and Stochastic Gradient Descent (SGD). Adam was chosen for its ability to handle sparse gradients and noisy data, making it a robust choice for optimizing neural networks. The optimizer adaptively adjusted the learning rate during training, leading to faster convergence and more efficient learning. This ensured that the model could effectively capture the relationships between the input features and the target outcomes without overfitting or underfitting.
The ANN model was trained for 50 epochs with a batch size of 32, allowing the network to iteratively refine its weight adjustments and reduce error on the training data. This approach ensured that the model gradually learned the relationships between the input features and the target variable—population density, which was used as a proxy for understanding the spread of COVID-19 across different regions. The use of a moderate batch size allowed for balanced training, avoiding overfitting and helping the model generalize better to new data. By the end of the training phase, the model achieved a reasonable Mean Squared Error (MSE) on the test set, indicating that it successfully captured the underlying patterns in the data.
To assess the model’s ability to generalize to new and unseen regions, the dataset was split into 80% training data and 20% test data12. This approach ensures that the model is trained on a majority of the data while preserving a separate portion for evaluation. By withholding 20% of the data for testing, we can better mimic real-world scenarios where predictions are made on regions not included in the training phase. This method allows for a more accurate assessment of the model’s performance and its potential to generalize well to unseen cases, which is critical when applying the model to predict the spread of COVID-19 across different Canadian health regions. The test data serves as a benchmark to ensure that the model is not overfitting to the training data and can reliably make predictions on new data.
To assess the model’s performance, it was evaluated on the test set, consisting of unseen data representing various regions. Predictions made by the ANN were compared to the actual population density values, and the results demonstrated good generalization capabilities. The low MSE on the test set indicated that the model was able to make accurate predictions, even for regions not included in the training phase. This performance suggests that the ANN effectively learned the complex relationships between the input demographic features and population density, offering valuable insights into how socio-economic factors might influence the spread of COVID-19 across Canadian health regions.
4.4 DATA ANALYSIS
Canada confirmed its first COVID-19 case in Toronto, Ontario, on January 25, 2020. For this study, we considered a dataset of COVID-19 cases reported up until July 20, 2024, with a total of 4.5 million cases. Table 1 presents the top five health regions with the highest and lowest predicted COVID-19 cases, providing insight into regional variations in case numbers.
| Highest | Lowest |
|---|---|
| City of Toronto Health Unit | Keewatin Yatthé Regional Health Authority |
| Région de Montréal | Région du Nord-du-Québec |
| Calgary Zone | Labrador-Grenfell Regional Integrated Health Authority |
| Peel Regional Health Unit | Western Regional Integrated Health Authority |
| Edmonton Zone | Région des Terres-Cries-de-la-Baie-James |
In many health regions, predicted COVID-19 case rates between males and females were relatively balanced. For example, the City of Toronto Health Unit has similar predicted COVID-19 cases among males and females. However, females may have had slightly higher infection rates in some regions. For example, Peel Regional Health Unit, which includes cities like Mississauga and Brampton, had a higher proportion of predicted COVID-19 cases among women, particularly in the early stages of the pandemic. In remote and rural regions with smaller populations such as Keewatin Yatthé Regional Health Authority (North Saskatchewan), gender differences in COVID-19 cases were less pronounced.
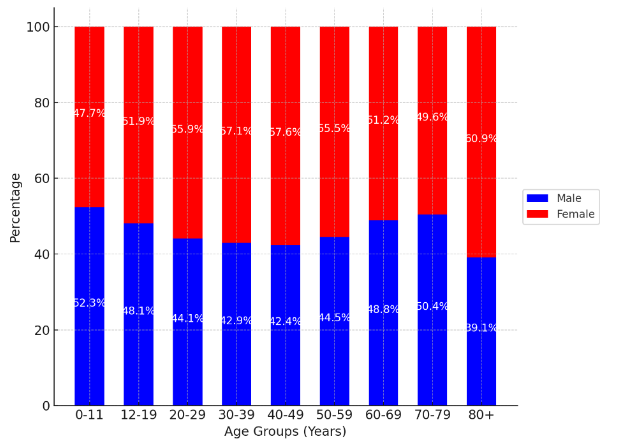
Figure 3 illustrates the distribution of COVID-19 cases by age group and gender (male and female) across different age categories in Canada. For younger age groups (0-11, 12-19), the distribution of cases is relatively balanced between males and females, with females slightly surpassing males in the 12-19 age group. As age increases, the proportion of female cases tends to dominate, particularly in the older age brackets (40-49, 50-59, and above). The 80+ age group shows the highest female proportion of cases, reflecting the increased vulnerability of elderly women to the virus. The chart highlights that while males generally have a higher percentage of cases in some age groups (20-29, 30-39), females dominate in the older age brackets.
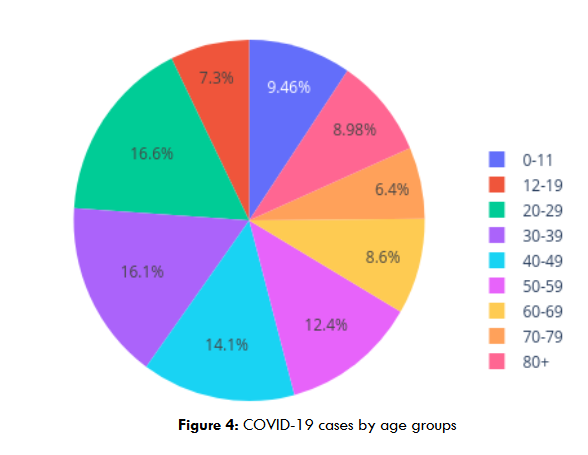
Figure 4 provides the distribution of COVID-19 cases across different age groups. The highest proportion of cases is observed in the 20-29 age group, accounting for 16.63% of total cases, followed closely by the 30-39 age group with 16.10%. These two groups represent the peak of COVID-19 infections, likely due to higher levels of social interaction and mobility. The 40-49 and 50-59 age groups also have significant case proportions, contributing 14.13% and 12.40%, respectively. Younger age groups, such as those between 0-11 and 12-19, exhibit lower proportions of 9.46% and 7.30%, respectively, while older age groups, particularly 70-79 and 80+, show relatively lower case proportions at 6.40% and 8.98%, respectively. This trend reflects how exposure and severity may vary across age groups, with younger adults experiencing higher infection rates compared to children and the elderly.
| Age Group | Health Region with Highest Cases | Health Region with Lowest Cases |
|---|---|---|
| 0-9 years | City of Toronto Health Unit | Keewatin Yatthé Regional Health Authority |
| 10-19 years | Peel Regional Health Unit | Région des Terres-Cries-de-la-Baie-James |
| 20-29 years | Région de Montréal | Labrador-Grenfell Regional Integrated Health Authority |
| 30-39 years | Peel Regional Health Unit | Keewatin Yatthé Regional Health Authority |
| 40-49 years | City of Toronto Health Unit | Région du Nord-du-Québec |
| 50-59 years | Région de Montréal | Labrador-Grenfell Regional Integrated Health Authority |
| 60-69 years | Edmonton Zone | Région des Terres-Cries-de-la-Baie-James |
| 70-79 years | Calgary Zone | Keewatin Yatthé Regional Health Authority |
| 80+ years | City of Toronto Health Unit | Western Regional Integrated Health Authority |
Table 2 outlines the Canadian health regions with the highest and lowest predicted COVID-19 cases rate for each age group. In most health regions, younger age groups, particularly those between 20-39 years, tend to show the highest infection rates as seen in regions like the Peel Regional Health Unit, Région de Montréal, and the City of Toronto Health Unit. However, older adults, particularly those aged 60 and above, remain the most vulnerable to severe outcomes, including hospitalization and death, as observed in urban regions like Région de Montréal. Also, Regions like the City of Toronto Health Unit and Peel Regional Health Unit had the highest hospitalization rates, particularly among older age groups (60+).
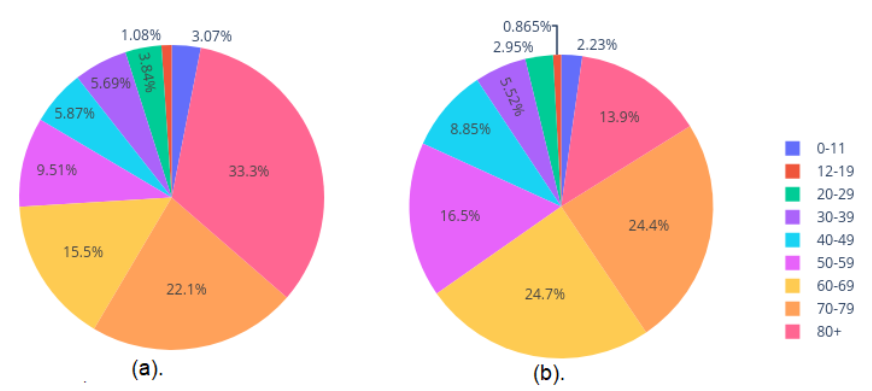
Figure 5 shows the COVID-19 cases by hospital and ICU admission. Individuals aged 80+ represent the largest share of hospitalizations at 33.30%, followed by the 70-79 age group, which accounts for 22.13% of admissions. Younger adults (20-29) and children (0-11) contribute to smaller proportions, with 3.84% and 3.07% of hospitalizations, respectively. Adolescents (12-19) have the lowest hospitalization rate at 1.08%. The 60-69 and 70-79 age groups account for the highest proportions of ICU admissions, with 24.73% and 24.43%, respectively. This highlights the increased vulnerability of these age groups to severe illness. In contrast, younger adults and children exhibit lower ICU admission rates. The 20-29 and 30-39 age groups account for 2.95% and 5.52%, respectively, while children aged 0-11 and adolescents aged 12-19 have the lowest proportions of ICU admissions, at 2.23% and 0.87%, respectively.
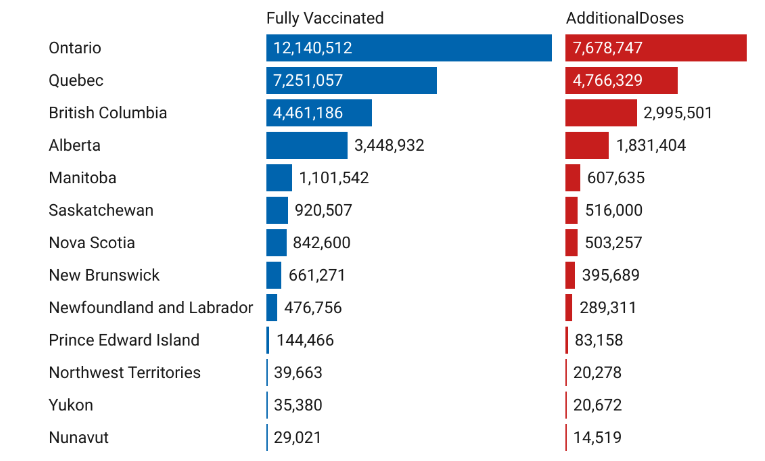
One hundred seven million COVID-19 vaccines have been administered, and about 81% of people in Canada have received at least one dose. Figure 6 shows the distribution of individuals who have completed both required doses of the COVID-19 vaccine, as well as those who have received additional doses (third or fourth doses), across various provinces and territories in Canada. Ontario leads with the highest number of fully vaccinated individuals (12.14 million) and additional doses (7.68 million), followed by Quebec with 7.25 million fully vaccinated and 4.77 million receiving additional doses. British Columbia and Alberta also report significant numbers, with British Columbia having 4.46 million fully vaccinated and 2.99 million additional doses, while Alberta has 3.45 million fully vaccinated and 1.83 million additional doses. Smaller provinces such as Manitoba, Saskatchewan, and the Atlantic provinces (Nova Scotia, New Brunswick, Newfoundland and Labrador, Prince Edward Island) show fewer fully vaccinated individuals and additional doses, with numbers decreasing further in the territories (Northwest Territories, Yukon, Nunavut). Despite the smaller population sizes, there is consistent uptake of additional doses across regions, particularly in Yukon (20,672) and Northwest Territories (20,278). Nunavut has the lowest numbers of both fully vaccinated (29,021) and additional doses (14,519). The highest percentage of fully vaccinated people based on population is in the Northern Territories, at about 96%, while Nunavut has the lowest. The highest percentage of people with a 3rd and 4th booster dose, based on population, is in British Columbia at around 59%, while Nunavut has the lowest.
In our approach, we employed Mean Squared Error (MSE) as the loss function for training an Artificial Neural Network (ANN) to improve the predictive modeling of COVID-19 cases. This ANN integrates preprocessing and regression capabilities into a unified workflow, streamlining the predictive process. To enhance training efficiency and robustness, we implemented an Early-Stopping callback, which monitors validation loss and halts training when no improvement is observed. Additionally, it restores the weights of the best-performing iteration to prevent overfitting. The model’s performance was evaluated using the R2 score, calculated between predicted and actual COVID-19 cases from the test set. With an R2 of 0.74, the ANN effectively captured complex and nonlinear relationships in the data.
5. Discussion
Based on the trained Artificial Neural Network (ANN) model, several key insights were derived about the role of geographical and demographic factors in shaping the spread of COVID-19 across Canadian regions. These findings provide a critical understanding of the spatial and population dynamics that influenced the transmission and impact of the virus.
The City of Toronto Health Unit, as part of Canada’s largest urban center, faces high COVID-19 case rates due to its dense population, significant social interactions, and diverse demographics that complicate public health messaging. Similarly, the Région de Montréal is characterized by high urban density and a multicultural community, which can facilitate rapid virus transmission, especially during large gatherings. The Calgary Zone experiences elevated case numbers owing to its rapid population growth and increased connectivity, with many residents engaging in high-contact activities. The Peel Regional Health Unit serves a diverse population marked by socioeconomic disparities, where crowded living conditions and essential workers contribute to higher vulnerability to infection. Finally, the Edmonton Zone, with its growing population and urban dynamics, faces challenges in controlling the spread of COVID-19, particularly in high-density areas and during periods of increased social interaction. Collectively, these health regions experience high COVID-19 cases due to a combination of urbanization, social behaviors, and systemic public health challenges.
These health regions; Keewatin Yatthé Regional Health Authority, Région du Nord-du-Québec, Labrador-Grenfell Regional Integrated Health Authority, Western Regional Integrated Health Authority, and Région des Terres-Cries-de-la-Baie-James are located in remote and sparsely populated areas of Canada. Their geographic isolation and lower population densities contribute to reduced human interaction, which limits the spread of COVID-19. Additionally, these regions often have smaller, close-knit communities with controlled access points, allowing for stricter monitoring of travel and public health measures. The low case numbers can also be attributed to the quick implementation of preventive measures and fewer large-scale gatherings compared to urban centers.
In health regions with high numbers of healthcare and essential workers often dominated by women, the number of predicted female COVID-19 cases has been slightly higher. For example, in Peel Region, women were more likely to work in healthcare, long-term care facilities, and other essential services, increasing their exposure to the virus. However, males typically experienced more severe outcomes, including higher hospitalization and mortality rates, due to higher rates of underlying health conditions like hypertension and diabetes, making them more vulnerable to severe illness. In contrast, in remote regions such as Keewatin Yatthé Regional Health Authority, COVID-19 case numbers were relatively low, and gender differences were less pronounced. The region’s sparse population, along with swift containment measures, helped keep infection rates low and balanced between genders.
In analyzing COVID-19 cases across Canadian health regions by age groups (e.g., 0-9, 10-19, 20-29, etc.), distinct patterns emerge that highlight both the transmission dynamics and vulnerability to severe outcomes. The highest infection rates among those between 20-39 years, are largely due to their increased mobility, social interaction, and participation in the workforce, as seen in regions like the Peel Regional Health Unit and the City of Toronto Health Unit. However, older adults, particularly those aged 60 and above, remain the most vulnerable to severe outcomes, including hospitalization and death, as observed in urban regions like Région de Montréal. While younger individuals might contract the virus more frequently, their symptoms tend to be milder compared to older adults who have higher rates of comorbidities, such as cardiovascular disease and diabetes. This was especially evident in regions with older populations and limited healthcare access, where the burden of severe illness and mortality disproportionately affected the elderly. The variation in case severity by age underscores the need for region-specific public health strategies, emphasizing protection for older populations while also addressing the high transmission rates among younger adults.
The model revealed that regions with a higher proportion of urban areas and smaller rural zones exhibited significantly higher population densities. This is a key factor in the rapid spread of infectious diseases such as COVID-19. In urban settings, higher contact rates between individuals, increased reliance on public transportation, and crowded living conditions create an environment where the virus can spread more easily. For example, cities like Toronto and Montreal which are heavily urbanized, likely experienced more intense COVID-19 transmission due to these higher densities. This highlights the need for stronger public health interventions in urban centers, where social distancing and containment measures are more challenging to implement effectively.
Conversely, the model indicated that rural regions with lower population densities experienced fewer COVID-19 cases. While the spread was slower in these areas, rural regions often face significant challenges in terms of healthcare infrastructure and access to medical services. Although transmission rates were lower, the ANN model emphasized that rural areas are still vulnerable during pandemics due to limited medical resources. This insight underscores the importance of targeted healthcare support in rural regions, particularly during times of crisis like the COVID-19 pandemic.
Geographical location, captured through latitude and longitude, was also a significant predictor of population density and, consequently, regional vulnerability to COVID-19. Regions situated closer to major economic hubs or transportation centers, such as those in southern Ontario, were more likely to experience higher transmission rates. This can be attributed to increased mobility and higher population densities in these areas. The proximity to large urban centers and interregional travel played a crucial role in shaping the spread of COVID-19 across Canada.
The model found an inverse relationship between total area size and population density. Larger regions tended to have lower population densities, which generally led to lower transmission rates. However, these regions, often characterized by vast rural expanses, faced unique challenges related to healthcare access. During the pandemic, these sparsely populated areas struggled with limited healthcare resources, making it difficult to manage the crisis despite their lower infection rates. This points to the need for healthcare system improvements in expansive rural areas to better handle future pandemics or health crises.
The model found that the spread of COVID-19 and hospitalization rates across Canadian health regions show significant disparities, largely driven by population density and healthcare infrastructure. Despite housing some of the largest hospitals in Canada, such as Hamilton General Hospital and The Ottawa Hospital – Civic Campus, Ontario has the second lowest number of hospital beds per 100,000 people, at around 125, just above Quebec, which has approximately 80 beds per 100,000. Quebec, however, leads in the number of critical care beds available. The availability of hospital beds, particularly ICU beds (with over 400 in Ontario), fluctuated across different waves of the COVID-19 pandemic. To manage the rising hospitalizations, the government took steps to redeploy and train healthcare workers, while actively seeking new staff. Additionally, acquiring essential medical equipment, such as ventilators and personal protective equipment, became a top priority to support the healthcare system’s response to the crisis.
Vaccination plays a crucial role in curbing the spread of COVID-19 by building immunity within populations, reducing transmission rates, and preventing severe outcomes like hospitalizations and deaths. Province with the highest vaccination rates, such as Northwest Territories, reports high uptake due to proactive public health measures, smaller populations, and a strong focus on community-wide vaccination efforts. In contrast, regions like Nunavut have lower vaccination rates due to factors such as geographic isolation, limited healthcare access, and vaccine hesitancy within certain communities. For example, the high vaccination rates in British Columbia can be attributed to effective vaccination campaigns and easier healthcare access. These disparities highlight the importance of tailored strategies to reach underserved regions and promote vaccine confidence.
One limitation of the analysis was the use of median imputation to handle missing data, particularly for demographic features like population and area sizes. While this method ensures no data is excluded, it may reduce the accuracy of the model for certain regions. Median imputation assumes that missing values are centrally distributed, which might not accurately reflect the true variability of the population across different regions. For example, regions with extreme population sizes or unique demographic distributions may have been poorly represented in the model due to this approach, potentially leading to less precise predictions for areas with significant outliers. This challenge underscores the need for more robust imputation techniques that account for regional diversity.
6. Conclusions
In conclusion, the trained Artificial Neural Network (ANN) model provides valuable insights into the geographical and demographic factors that influence the spread of COVID-19 across Canadian health regions. Our findings emphasize the significant role of urbanization, population density, and social behaviors in shaping transmission patterns, particularly in densely populated regions such as the City of Toronto Health Unit and Région de Montréal. In contrast, remote and sparsely populated areas, such as the Keewatin Yatthe Regional Health Authority and Labrador-Grenfell Regional Integrated Health Authority, experienced lower transmission rates due to geographic isolation and tighter community controls. The ANN model further highlighted the importance of vaccination in curbing the spread, with higher vaccination rates observed in regions like Northwest Territories, driven by proactive public health measures. In contrast, lower rates in Nunavut underscore the need for targeted strategies to overcome challenges related to healthcare access and vaccine hesitancy. Additionally, the model revealed disparities in healthcare infrastructure, particularly in terms of hospital and ICU bed availability, which were more pronounced in urban regions. Future research could focus on joint predictive modeling of COVID-19 cases and deaths using advanced machine learning techniques to further enhance our understanding of pandemic dynamics and improve public health preparedness.
Conflicts of Interest Statement
The authors declare that they have no conflicts of interest relevant to the content of this article.
Funding Statement
This research received no specific grant from any funding agency in the public, commercial, or not-for-profit sectors.
Acknowledgements
The authors would like to express their gratitude to the reviewers for their valuable feedback, which has significantly contributed to improving the quality of this paper.
References
1. Abiodun OI, Jantan A, Omolara AE, et al. State-of-the-art in artificial neural network applications: A survey. Heliyon. 2018;4(11). doi:10.1016/j.heliyon.2018.e00938.
2. Agarap AF. Deep Learning using Rectified Linear Units (ReLU). 2019. arXiv.
3. Apostolopoulos ID, Mpesiana TA. COVID-19: automatic detection from X-ray images utilizing transfer learning with convolutional neural networks. Physical and Engineering Sciences in Medicine. 2020;43(2):635-640. doi:10.1007/s13246-020-00865-4.
4. Batista AFM, Miraglia J, Donato R, et al. COVID-19 diagnosis prediction in emergency care patients: a machine learning approach. medRxiv. 2020. doi:10.1101/2020.04.04.20052092.
5. Chan S, Chu J, Zhang Y, Nadarajah S. Count regression models for COVID-19. Physica A: Statistical Mechanics and its Applications. 2021;563:125460. doi:10.1016/j.physa.2020.125460.
6. Cooper I, Mondal A, Antonopoulos CG. A SIR model assumption for the spread of COVID-19 in different communities. Chaos Solitons Fractals. 2020; 139:110057. doi:10.1016/j.chaos.2020.110057.
7. Cordes J, Castro MC. Spatial analysis of COVID-19 clusters and contextual factors in New York City. Spatial and Spatio-temporal Epidemiology. 2020;34:100355. doi:10.1016/j.sste.2020.100355.
8. Fang ZG, Yang SQ, Lv CX, et al. Application of a data-driven XGBoost model for the prediction of COVID-19 in the USA: a time-series study. BMJ Open. 2022;12(7):e056685. Published 2022 Jul 1. doi:10.1136/bmjopen-2021-056685.
9. Galasso J, Cao DM, Hochberg R. A random forest model for forecasting regional COVID-19 cases utilizing reproduction number estimates and demographic data. Chaos Solitons Fractals. 2022;156:111779. doi:10.1016/j.chaos.2021.111779.
10. Hadley E, Rhea S, Jones K, et al. Enhancing the prediction of hospitalization from a COVID-19 agent-based model: A Bayesian method for model parameter estimation. PLoS One. 2022;17(3). doi:10.1371/journal.pone.0264704.
11. Jain AK, Mao J, Mohiuddin KM. Artificial neural networks: a tutorial. Computer. 1996;29(3):31-44. doi:10.1109/2.485891.
12. Joseph VR. Optimal ratio for data splitting. Statistical Analysis and Data Mining: The ASA Data Science Journal. 2022;15(4):531-538. doi:10.1002/sam.11583.
13. Kingma DP. Adam: A method for stochastic optimization. arXiv preprint arXiv:1412.6980. 2014.
14. Kremer C, Torneri A, Boesmans S, et al. Quantifying superspreading for COVID-19 using Poisson mixture distributions. Science Reports. 2021;11:14107. doi:10.1038/s41598-021-93578-x.
15. Kumar N, Susan S. COVID-19 Pandemic Prediction using Time Series Forecasting Models. In: 2020 11th International Conference on Computing, Communication and Networking Technologies (ICCCNT). Kharagpur, India: IEEE; 2020:1-7. doi:10.1109/ICCCNT49239.2020.9225319.
16. Lecun Y, Bengio Y, Hinton G. Deep learning. Nature. 2015;521(7553):436-444.
17. Little RJ, Rubin DB. Statistical Analysis with Missing Data. 2nd edition. Wiley; 2002.
18. Liu Y, Yu C, Shen K. Researches on the COVID-19 epidemic in the world within a nonextensive SIR model. Medical Research Archives. 2020; 10(6). doi:10.18103/mra.v10i6.2904.
19. Mansour NA, Saleh AI, Badawy M, Ali HA. Accurate detection of COVID-19 patients based on Feature Correlated Naïve Bayes (FCNB) classification strategy. Journal of Ambient Intelligence and Humanized Computing. 2022;13(1):41-73. doi:10.1007/s12652-020-02883-2
20. Niazkar HR, Niazkar M. Application of artificial neural networks to predict the COVID-19 outbreak. Global Health Research and Policy. 2020;5:50. doi:10.1186/s41256-020-00175-y.
21. Oztig LI, Askin OE. Human mobility and coronavirus disease 2019 (COVID-19): a negative binomial regression analysis. Public Health. 2020;185:364-367. doi:10.1016/j.puhe.2020.07.002.
22. Sarker IH. Machine Learning: Algorithms, Real-World Applications and Research Directions. SN Computer Science. 2021;2(3):160. doi:10.1007/s42979-021-00592-x.
23. Schmidhuber J. Deep learning in neural networks: an overview. Neural Networks. 2015;61:85-117. doi:10.1016/j.neunet.2014.09.003.
24. Shaban WM, Rabie AH, Saleh AI, Abo-Elsoud MA. A new COVID-19 Patients Detection Strategy (CPDS) based on hybrid feature selection and enhanced KNN classifier. Knowledge Based Systems. 2020;205:106270. doi:10.1016/j.knosys.2020.106270.
25. Shorten C., Khoshgoftaar TM, Furht B. Deep Learning applications for COVID-19. Journal of Big Data 8, 18 (2021). https://doi.org/10.1186/s40537-020-00392-9.
26. Shrivastav LK, Jha SK. A gradient boosting machine learning approach in modeling the impact of temperature and humidity on the transmission rate of COVID-19 in India. Applied Intelligence. 2021;51(5):2727-2739. doi:10.1007/s10489-020-01997-6.
27. Somyanonthanakul R, Warin K, Amasiri W, et al. Forecasting COVID-19 cases using time series modeling and association rule mining. BMC Medical Research Methodology. 2022;22:281. doi:10.1186/s12874-022-01755-x.
28. Thomas LJ, Huang P, Yin F, et al. Spatial heterogeneity can lead to substantial local variations in COVID-19 timing and severity. Proceedings of the National Academy of Sciences. 2020;117(39):24180-24187. doi:10.1073/pnas.2011656117.
29. Wickramasinghe L, Muthukumarana S, Leblanc A. Bayesian Inference On Sparse Multinomial Data Using Smoothed Dirichlet Distribution with an Application to COVID-19 data. Model Assisted Statistics and Applications. 2023;18(3):207-226. doi:10.3233/MAS-221411.
30. Wickramasinghe L, Jain A. Quantitative Insights into the Winnipeg Rental Sector: A Data-Driven Analytical Approach Using Geographic and Property Metric. Machine Learning with Applications. 2024, (under review).
31. Yoo SH, Geng H, Chiu TL, et al. Deep Learning-Based Decision-Tree Classifier for COVID-19 Diagnosis From Chest X-ray Imaging. Frontiers in Medicine. 2020;7:427. doi: 10.3389/fmed.2020.00427.
32. Zarikas V, Poulopoulos SG, Gareiou Z, Zervas E. Clustering analysis of countries using the COVID-19 cases dataset. Data in Brief. 2020;31:105787. doi:10.1016/j.dib.2020.105787.
33. Zhou J, Li X, Ding T, You C, Qu Q, Zhu Z. On the Optimization Landscape of Neural Collapse under MSE Loss: Global Optimality with Unconstrained Features. In: Proceedings of the 39th International Conference on Machine Learning. 2022;162:27179-27202. https://proceedings.mlr.press/v162/zhou22c.html.