


Food Desert Residents: Insights on Dietary Choices
A multi-method Analysis of Food Desert Residents’ Lived Experience with Food
Terrence W. Thomas 1, Murat Cankurt 2
- Agribusiness, Applied Economics and Agriscience Education, North Carolina A&T State University, Greensboro, NC, 27411
- Agribusiness, Applied Economics and Agriscience Education, North Carolina A&T State University, Greensboro, NC, 27411
OPEN ACCESS
PUBLISHED: 31 October 2024
CITATION: Thomas, TW., and Cankurt, M., 2024. A multi-method Analysis of Food Desert Residents’ Lived Experience with Food. Medical Research Archives, [online] 12(10). https://doi.org/10.18103/mra.v12i10.6062
COPYRIGHT: © 2024 European Society of Medicine. This is an open-access article distributed under the terms of the Creative Commons Attribution License, which permits unrestricted use, distribution, and reproduction in any medium, provided the original author and source are credited.
DOI https://doi.org/10.18103/mra.v12i10.6062
ISSN 2375-1924
ABSTRACT
Accessibility is one of the main factors determining dietary habits. Food deserts are the zones where it is difficult to access healthy food. The main purpose of this study is to reveal the food perceptions, behaviors and food experiences of individuals living in food deserts in Guilford County, North Carolina. The ISAC analysis procedure (which includes identification, segmentation, and characterization stages), first published in this paper, was used to examine the study data. Factor analysis isolated the following dimensions of food value, emotional, environmental & social, economic, ethical and safety in the identification stage. Using these dimensions as clustering variables, segments labeled as value-positive, value-negative, and hedonic approaches to food values were identified. The Value-Positive segment consists mostly of African Americans who work full-time, are middle-aged, and live in one-person households. The Hedonic segment consists mostly of women, full-time workers, and young adults. Older, unemployed, and low-income individuals represent the value-negative segment. Results clearly show that each segment differed according to its demographic and behavioral characteristics. The qualitative analysis revealed that factors other than access to food are important in determining food desert residents’ relationship with food and even though residents recognize that food plays a key role in achieving good health, they are reluctant to follow healthier diets because it takes too long realize the positive effects. Overall, these results can be used to develop targeted strategies and policies for a healthier society and a better quality of life.
Keywords
Food deserts, dietary habits, food perceptions, ISAC analysis, Guilford County, North Carolina
1. Introduction
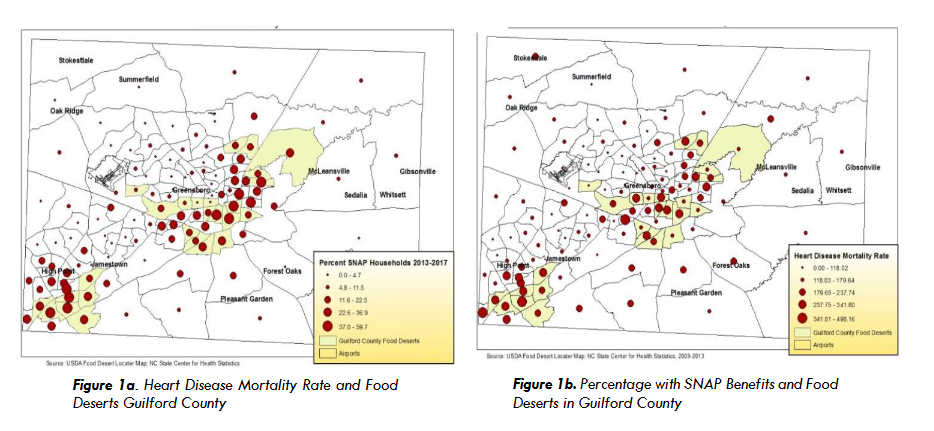
Healthy individuals are the building blocks of a healthy society. The relationship between nutrition and health is undeniable. Ensuring a population’s food security is crucial for overall well-being and disease prevention. Guilford County, North Carolina, has large pockets of low-income communities classified as food deserts. The relatively high incidence of chronic diseases among low-income food desert residents is often attributed to an unhealthy lifestyle. Poor diets and unhealthy eating habits are named among the factors responsible for the spate of chronic diseases such as obesity and cardiovascular ailments. For example, the Wernersville community, south of downtown Greensboro, Guilford County, North Carolina, U.S, has the highest rate of chronic diseases in all of Guilford County, said Janet Mayer, a nutritionist and registered dietician with the Guilford County DHHS. Guilford County has 26 food desert areas, up from 24 in 2010. Obese individuals are faced with an increased risk for coronary heart disease, type 2 diabetes, cancer, hypertension, stroke, and liver disease, as well as other conditions such as sleep apnea, respiratory problems, and osteoarthritis. The impact of these diseases goes far beyond the cost of treatment. There is also the cost of person-hours lost, reduced quality of work attributable to debilitated employees and a decrease in the overall quality of life among affected communities. If current trend continues the estimated medical and productivity cost per North Carolina resident is $8,600.00 in 2030. The Guilford County DHHS Report (2017) identified lack of physical activity and poor nutrition as the primary risk factors for obesity and related chronic diseases and named lack of time, lack of knowledge and cost of food as barriers to a healthier lifestyle.
A report prepared by Partnership to Fight Chronic Disease Organization estimated that in 2024 chronic disease (including diabetes) and lack of physical activity could cost the state 1.4 trillion dollars over the period 2016-2030. The report also projected that modest changes in health behavior, which include increased physical activity and healthier food choices and improved care delivery, among other changes, could produce annual savings of $4.1 billion. Considering the cost to the state of diet related chronic diseases, developing insights that increase the effectiveness of programs that promote healthier food choice behavior of individuals, particularly low-income underserved communities, could yield significant financial and public health benefits.
Investigation of the experience of food desert residents with food has focused primarily on the factors that affect their choice of food and the consequence of their choice for their health status. For example, previous studies among others have focused on features of the individual and or the physical or commercial characteristics of the food environment, for example, physical access-ease of getting to and from stores or markets, economic access-affordability, and commercial feature of stores. Overall, in the literature, food desert residents’ experience with food is investigated as a matter of choice under the extant condition of food desert. Theoretical expositions on choice behaviors, in general, have considered models such as Becker’s view of decisions emanating from stable preferences and the theory of planned behavior. In the case of food choice behavior, in particular, researchers have investigated the food retail environment, food-related values, and food-related lifestyle. These models explain choice from the perspective of the individual decision-maker, while social practice theory and Pentland’s view of social learning, based on the level of engagement among individuals (around food) within the community, provide a social or collective perspective on food choice behavior. Notwithstanding the rich literature on the subject, there is still an opportunity to deepen the current level of understanding concerning food choice behavior especially among food desert residents. Applying a multimethod approach and thinking of choice more broadly as a social experience with food offers a promising avenue for seizing this opportunity, particularly in the context of underserved food insecure communities.
Making decisions is the staple activity of every aspect of human endeavor. Choice is a central concept in the social sciences not just from a theoretical perspective but also from a policy perspective. One’s belief about what people choose and why they choose it influences almost all our explanation of social, economic, and political outcomes. So deepening insights into the how and why individuals choose one course of action over another course of action determines strategies for encouraging individuals to make choices that are in their own best interests and that of society. Because choosing plays a role in almost all aspects of human endeavor, no single research tradition, with its unique epistemology is equipped to deepen our understanding of choice.
In this paper we draw on earlier work and the work of others to show the relevance of social practice theory for generating insights into the food desert residents’ relationship with food. Social practice is a routinized form of behavior comprising several interconnected elements that include material things and their use, physical and mental activities, background knowledge as know-how, understanding, emotional states and motivational knowledge. Using this definition as a guide and the work of others, this paper offers the following interpretation of social practice, that is, practice is an accepted way of doing things shaped over time by social, political, economic, and technological forces. Additionally, social practice or the “practice” can be viewed as a system where the components of a practice interact to define the practice, and the practice is dynamic evolving over time as linkages among elements are redefined. This view of social practice separates it from practice as performance, which in this sense is the repetition of an activity with the aim of getting better at performing the activity, a symphonic orchestra practicing before a concert comes to mind. Notice that practice as performance takes place within the tradition/protocol of a particular practice, which is practice as an entity.
For example, soccer team practice sessions happen within the practice of participating in a league competition. Since this paper views a social practice (practice as an entity) as a system where interconnected and interacting elements shape the character of the system, the system of social practice is a dynamic entity, which means that food choice behavior and the impact from this behavior are emergent outcomes, and the food environment is one element of the material component of the social practice system. Because the outcomes of this “social practice system” for example, food choice behavior and its impact are emergent phenomena, it is difficult for researchers to connect them to a single component or a defined set of components with a stable relationship among a set of components. This means an analytical approach that takes a system view of the food environment is likely to yield more fruitful results. A systems perspective of social practice is consistent with the proposition that “social practice conceptualized as an entity” is an appropriate unit of analysis in the investigation of social phenomena where the observed outcome is the emergent result of numerous interacting variables, for example the food choice behavior of food desert residents.
The idea that individuals live in a network which impacts their behavior can be considered closely related to the social practice concept because it views the individual as embedded in a web of social connections. Others argue that our social networks determine our beliefs and behaviors. And others provide convincing rationale and empirical evidence to support the role of social structure as a major driver of norms, habits, preferences, and behavior. Arguing that learning from examples of other people’s behavior and the associated contextual features is an important and likely dominant mechanism for behavior change. In his family and friends’ study, he showed that exposure to the examples of peers had the greatest effect on behavior change including health behaviors, the adoption of habits and preferences. The arguments presented here point piercingly in the direction of an integrated systems approach for investigating the complex phenomena of food desert community’s relationship with food that comprises social, economic, geographic, political, and psychographic elements. Further, inference leads us to conclude that an integrated systems approach designed to study such complex phenomena must include transdisciplinary teams of researchers and employ a multimethod approach such as ISAC. The main objective of this study is to gain insight into the food experience of food desert communities in Guilford County, which involves interaction and experience with food environment, preparation, and shopping, their tradition, dietary behavior, and food values.
2. Methodology
In this research study, we applied both quantitative and qualitative methodologies in collecting, analyzing the data, and in interpreting the results. Quantitative techniques enable the collection of data, over a large sample, on well-defined ideas with a conceptual structure that facilitates the application of quantitative and mathematical logic to summarize information in terms of statistics and relationships among variables. On the other hand, the qualitative approach focuses on using focus groups, observations, and in-depth interviews for collecting narrative data over purposively selected small samples. Qualitative (narrative data) provides rich, thick descriptions, which adds context and facilitates a deeper more meaningful interpretation of quantitative data.
A description of food desert residents’ experience with food based solely on quantitative analysis of the attributes of food desert residents and their food environment is limited because the summary statistics and relationships generated from them lack human connections. So, there is a need to go beyond this limited quantitative perspective of food desert residents’ relationship with food by embracing a qualitative/ethnographic perspective based on social action theory and the concepts of social learning, engagement and exposure. These perspectives have the potential to generate additional insights that deepen understanding of the relationship of food desert residents with food. These methods differ in the way data is collected and analyzed. For this reason, the methods used to collect the data will be described first, followed by the methods used to analyze the data.
2.1. DATA COLLECTION METHODS
Primary data was obtained from individuals living in food deserts of Guilford County, North Carolina.
2.1.1. Data Collection for Quantitative Methods
For quantitative analysis, a telephone survey was developed and administered to collect data on food value perceptions and dietary behaviors of residents in 24 food desert census tracts in Guilford County. The survey questionnaire was designed to use the Qualtrics online platform to collect and store interview data. The study utilized the Dillman technique to increase survey response rates and collect more reliable and valid data. To determine the appropriate sample size, the Cochran formula, a reliable and widely used method of sample size calculation, was used. Since food deserts are a demographically heterogeneous region, higher confidence levels were targeted in the sample size calculation. Firstly, a sample size of 646 was calculated with a confidence level of 99% and a margin of error of 5%.
Despite its apparent simplicity, this method required approximately more than 6 attempts to complete a single survey. This means that a total of approximately 4 thousand attempts are required. The responses obtained from individuals were recorded online in the Qualtrics database. The data downloaded from the Qualtrics database were reviewed and cleaned–removed inconsistent surveys and adjusted for missing data to ensure that the analyses were unbiased and consistent. Removing inconsistent surveys from a dataset is a crucial step to enhance the quality of survey data and ensure the reliability of results. Inconsistencies can arise from contradictions, denials, or illogical responses. Eliminating such outliers contributes to establishing a more solid foundation for analysis. A study conducted at the University of North Carolina suggested that excluding inconsistent or misleading data from analysis can enhance result reliability. Removing inconsistent data to maintain data integrity and improve the accuracy of analysis is a widespread practice.
After cleaning the data, the margin of error of the sample in representing the population increased only slightly, but not significantly. After weeding out the questionnaires with outliers and missing data, the sample size decreased to 536. However, this sample size represents the population with a 99% confidence interval and a 5% margin of error.
2.1.2. Methodology Qualitative Component
We developed an instrument for the in-depth interviews based on our knowledge of the issues from past research that include surveys and listening sessions. We selected six participants from a food desert community based on their knowledge of the community and the issues to participate in the in-depth interviews. An in-depth ethnographic interview questionnaire was constructed using the following framework: domain of interest, topic of inquiry, subdomain, and sample questions. The questionnaire was field tested to ensure relevance and salience. Immediately following each interview, the interviewer prepared a summary brief. We used this summary brief and recordings to validate transcripts. All interviews were recorded and transmitted to a private transcription firm for preparing transcripts from recordings (following IRB protocol). Interviews and observations of participants in their natural environment took place over a period of six weeks. We conducted a rapid thematic analysis of data with the aid of qualitative software -NVivo- to identify themes and psychographic dimensions.
2.2. METHODS USED IN ANALYZING THE DATA
2.2.1. Analytical Methodology
The quantitative analysis involved the calculation of descriptive statistics, hypothesis testing, factor analysis, cluster analysis and ISAC Analysis Procedure. SPSS 21 software was used for statistical and multivariate data analysis.
Factor analysis is a statistical technique that aims to examine the relationships between variables in a data set and group these variables under a smaller number of latent factors. This method identifies highly interdependent variables in complex data sets and reveals the more fundamental underlying structures. Factor analysis is widely used in the social sciences, psychometric testing, and market research, and is applied to reduce data size, recognize patterns, and construct structural models. In this study, we used factor analysis to identify the dimensionality of the individual’s perceptions of food values.
Cluster analysis is a statistical technique used to organize similar items in a data set into groups. This method divides data points into clusters based on similarities between observations, so that items in the same cluster are more like each other, while items in different clusters are very dissimilar. Cluster analysis is widely used for data classification and segmentation, especially in areas such as marketing, bioinformatics, image processing and social sciences. This technique helps to discover naturally occurring groups in the data set and enables decision makers to customize products and services to meet the needs of diverse groups.
2.2.2. ISAC Analysis Procedure
The ISAC Analysis Procedure is a multi-stage analytical approach used to systematically study and interpret complex phenomena, particularly in the context of social sciences, consumer behavior, or any field where understanding the underlying patterns and relationships is crucial. ISAC Analysis Procedure takes its name from the initials of its stages Identification, Segmentation, And Characterization. In fact, it is a research process that is used by many researchers, perhaps completely or partially. However, we defined and developed the ISAC procedure to make the process more recognizable, easier to remember and understand.
Step 1: Identification
Identification is the first step of the ISAC process. It involves calculating descriptive statistics which reveals the structure of the data, for example, means, standard deviations, min/max and frequencies for variables of interest, followed by dimension reduction for identifying variable for use in further analysis to achieve the research purpose.
Step 2: Segmentation
Segmentation, the second stage of the ISAC procedure, involves dividing population, community, or target group into defined subgroups in terms of some characteristics. These characteristics may be demographic, psychographic, behavioral, geographic, or some other variables related to research focus. Segmentation helps researchers to understand the needs, behaviors, attitudes, or opinions of specific groups (segments) and develop strategies adapted to the peculiar needs of each segment.
Segmentation in social research can be conducted for different purposes. It can be done to develop customized strategies for specific subgroups (e.g., young adults, retirees, highly educated individuals), which is called targeting and personalization. It can be used to allocate limited resources more effectively by focusing on smaller, more homogeneous groups and achieving more precise results. It can be done for market and policy development, optimizing social marketing, policy development and communication strategies by targeting specific groups. Or, as we have done in this study, it can be used to improve insight into how different groups react, their attitudes towards social issues, products, or services to customize programs to meet their needs.
Methods of analysis which can be used for segmentation vary depending on the nature of the data and the purpose of segmentation. Some of the commonly used methods are Cluster Analysis, Factor Analysis, Discriminant Analysis, Logistic Regression, Decision Trees, Latent Class Analysis – LCA, CHAID (Chi-square Automatic Interaction Detection). Because it is commonly known and used, we chose to use cluster analysis in this research.
Step 3: Characterization
The characterization stage is one of the last and most critical stages of the ISAC analytical procedure. In this stage, the groups defined in the segmentation process are analyzed in detail to reveal the unique characteristics of each segment.
In the characterization process, each segment is first analyzed using data such as demographic information, psychographic characteristics, and behavioral tendencies. As a result of this analysis, the characteristic features of each segment are identified. Then, fictitious characters called “personas” are created from these segments. Personas represent a typical member of the segment and reflect its typical characteristics such as needs, motivations and behaviors. Personas help to improve understanding of who the target audience is and serve as a guide for the development of strategies and policies for these personas.
Personas allow customized strategies to be developed based on the specific needs and preferences of each segment. These strategies can be applied in various areas such as public education and behavior modification campaigns to promote healthier lifestyles, product development, customer service and communication strategies. More generally, public policies or corporate strategies can be shaped based on the findings from the characterization phase. Policies developed according to the needs and social behaviors of different personas can offer more effective and sustainable solutions. In this manner, characterization enables resources to be used more efficiently. Particularly allocating marketing and communication budgets to the right individuals (personas) can increase returns on investment. This helps businesses, policymakers and organizations to communicate more empathetically and effectively with their target audiences.
In summary, the ISAC Analysis Procedure is especially useful in research areas like marketing and in the case of this study, where it helps researchers and analysts derive actionable insights by systematically breaking down and examining the data in a structured manner. Segmentation in this case facilitates more effective policy making by enabling the customization of programs.
3. Results
3.1. IDENTIFICATION (STAGE 1 OF ISAC)
To begin the identification phase, we will calculate descriptive statistics and conduct dimension reduction of food value perception variables.
3.1.1. Descriptive Statistics of Food Values
Food value is one of the focus areas of the research. It is a measure that can be used to understand the value that individuals and, by extension, society place on food and its attributes. Table 1 presents simple descriptive statistics and ranking of food attributes that represent food value. Reliability analysis was conducted to assess whether the responses of community members about food values were consistent and reliable. The reliability test yielded a Cronbach’s Alpha of 0.78, meaning that all the items included in the analysis were measured with a reasonable degree of reliability. Based on the results of the reliability analysis, the exclusion of variable from the analysis does not cause a significant change in the value of Cronbach’s Alpha. This means it is appropriate to use all our variables in the analysis. Hotelling’s T-Square test, which is significant (Hotelling’s T-Squared= 905.343; p < 0.01), confirms that the degrees of importance reported by residents for food values are significantly different. The results indicate that taste is the most important food value, followed by appearance, price and nutrition. The least important ones are tradition, fairness, and origin.
| Mean | Minimum | Maximum | Standard Deviation | Score | Rank | |
|---|---|---|---|---|---|---|
| Naturalness | 5.91 | 1 | 7 | 1.58 | 3167 | 5 |
| Taste | 6.75 | 2 | 7 | 0.69 | 3619 | 1 |
| Price | 6.19 | 1 | 7 | 1.35 | 3319 | 3 |
| Safety | 5.90 | 1 | 7 | 1.41 | 3164 | 6 |
| Convenience | 5.46 | 1 | 7 | 1.63 | 2929 | 8 |
| Nutrition | 6.03 | 1 | 7 | 1.34 | 3232 | 4 |
| Tradition | 4.43 | 1 | 7 | 2.06 | 2377 | 11 |
| Origin | 4.81 | 1 | 7 | 1.91 | 2577 | 10 |
| Fairness | 4.86 | 1 | 7 | 2.01 | 2607 | 9 |
| Appearance | 6.57 | 1 | 7 | 1.02 | 3524 | 2 |
| Env. Impact | 5.82 | 1 | 7 | 1.58 | 3121 | 7 |
* 1: Not at all important, 7: Very important; Null hypothesis was rejected under Friedman Test for p < 0.01; Cronbach’s Alpha: 0.78.
3.1.2. Identification of Food Value Dimensions by Factor Analysis
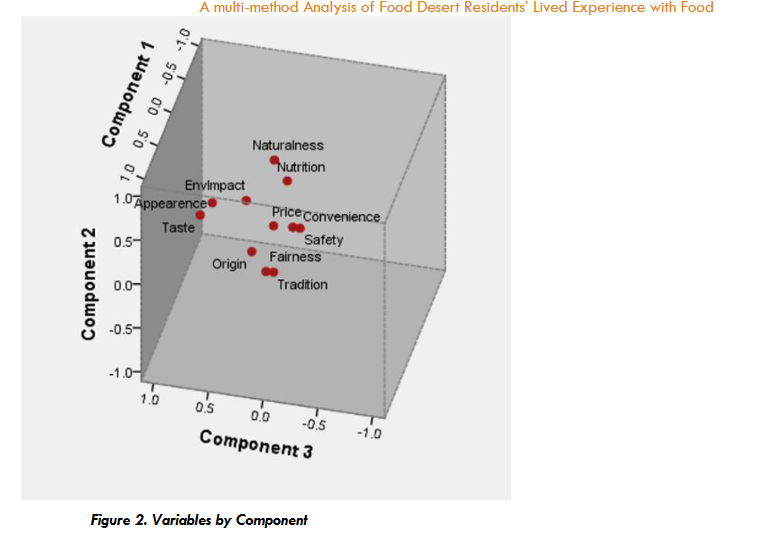
In this research, we used factor analysis to identify the dimensions of the target group food value. Our main purpose in conducting this analysis is to determine the dimensions used by the study population when evaluating food products. To determine these dimensions, we used food values such as taste, appearance, safety, price, naturalness, nutrition, environmental impact, convenience, tradition, fairness, that are widely employed in the literature and our previous work.
In the first factor analysis attempt, 3 factor groups were obtained. However, when the loading plot was examined, it was seen that the groups did not gain stability with 3 components. We know from previous papers that a strict application of the eigenvalue criterion will in some cases miss factors with eigenvalues below 1 that are significant in the research context. It is emphasized that factors with an eigenvalue below 1 may also be important in the research, especially if they have a theoretical basis. In some cases where the eigenvalue is less than 1, factors can be considered, depending on the significance and explanatory power of the factors. For this reason, the eigen value constraint was reduced from 1 to 0.9. When reanalyzed, the literature cited above confirmed the results.
As a result of the analysis, the dimensions were identified as ethical, environmental & social, economic, emotional, and safety. These were the main dimensions summarizing the food values of the residents in the sample in the study area as shown in Table 2. We will use these dimensions in further analysis. Identifying safety as “stands alone” or a dimension with a single variable improved the quality of the current model when compared with the results of the previous model that excluded safety. Currently safety is a unique variable compared to the others, it has a high factor loading, so it is natural to separate it. When we look at the mean of safety, it is a food value that respondents care about deeply. For these reasons, and considering previous publications, the researchers decided to keep safety in the model and use it in further analysis. The Kaiser-Meyer-Olkin (KMO) measure of sampling adequacy was 0.814, indicating factor analysis was appropriate. Bartlett’s test of sphericity was significant (p < 0.001), meaning that the correlation matrix is significantly different from identity matrix. The reliability test conducted to assess the internal consistency among the set of values on the dimension produced a Cronbach’s alpha of 0.74.
| Food Value Dimensions | Factor Loading | Mean | Std Deviation | Group Mean |
|---|---|---|---|---|
| Emotional | Taste 0.849 | 6.75 | 0.69 | 6.66 |
| Environmental & Social | Naturalness 0.798 | 5.91 | 1.58 | 5.99 |
| Nutrition 0.725 | 6.03 | 1.34 | ||
| Env. Impact 0.503 | 5.82 | 1.58 | ||
| Economical | Price 0.897 | 6.19 | 1.35 | 5.83 |
| Convenience 0.604 | 5.46 | 1.63 | ||
| Ethical | Tradition 0.815 | 4.43 | 2.06 | 4.70 |
| Fairness 0.799 | 4.86 | 2.01 | ||
| Origin 0.702 | 4.81 | 1.91 | ||
| Safety | 0.982 | 5.90 | 1.41 | 5.90 |
* 1: Not at all important, 7: Very important. KMO Measure of Sampling Adequacy..814; Bartlett’s Test of Sphericity Chi-Square 1024.622, p<0.01
3.2. SEGMENTATION (STAGE 2 OF ISAC)
Once the key components were identified, the data were then segmented into distinct groups or clusters based on shared characteristics or behaviors. Segmentation allows for the grouping of similar entities, making it easier to analyze patterns and relationships within these groups. Personas are characters reflecting the needs, behaviors, and preferences of each segment. They play a critical role in making strategic decisions and developing targeted marketing or service strategies, and in the case of this study policy strategies. The segmentation process makes it possible to better understand the target audience, develop more effective strategies for them, and implement these strategies consistently across the community. Because it is commonly known and used, we chose to use cluster analysis as the method of segmentation in this research.
3.2.1. Cluster Analysis
Cluster Analysis is a statistical method used to classify individuals or objects in a data set into groups (clusters) based on their similarities. Members within clusters are more like each other in terms of the focal characteristics, while there are differences between members in different clusters on the focal characteristics. Cluster analysis can be classified as an exploratory data analysis technique because it is used to reveal natural groups or structures in data.
Using the dimensions identified in Table 2 above as clustering variable, cluster analysis produced three segments shown in Table 3 below.
| Food Value Dimensions | Segment I | Segment II | Segment III |
|---|---|---|---|
| Emotional | 6.86a | 6.82a | 4.95b |
| Environmental & Social | 6.15a | 5.83a | 4.83b |
| Ethical | 4.93a | 4.51b | 3.92c |
| Economic | 5.89 | 5.77 | 5.67 |
| Safety | 6.90a | 4.01b | 6.20c |
| N | 192 | 141 | 203 |
| % | 36% | 26% | 38% |
* 1: Not at all important, 7: Very important; Null hypothesis was rejected under Friedman Test for p < 0.01.
Table 4 presents factor loadings of food values in each segment. In factor analysis, the factor loadings represent the correlation between the observed variables and the underlying factors. A positive factor loading indicates that the variable is positively correlated with the factor, meaning that as the factor increases, the variable also tends to increase. Conversely, a negative factor loading means that the variable is negatively correlated with the factor, so that as the factor increases, the variable tends to decrease. These loadings help in interpreting the factors and understanding the relationship between the variables and the latent constructs they represent.
As a result of the cluster analysis, 3 segments were obtained. When the factor scores of these segments are observed, the structure of the segments becomes clear and meaningful. Accordingly, Segment I was labeled “value positive;” Segment II “hedonic;” Segment III as “value negative.”
| Food Values | Segment I (Value-Positive) | Segment II (Hedonic) | Segment III (Value-Negative) | Kruskal-Wallis H | Asymp. Sig. |
|---|---|---|---|---|---|
| Emotional | 0.2733 | 0.2318 | -2.4591 | 4.99 | 0.082 |
| Environmental & Social | 0.104 | -0.0599 | -0.4364 | 7.76 | 0.021 |
| Ethical | 0.0786 | -0.0833 | -0.2016 | 129.57 | 0.000 |
| Economical | -0.0106 | 0.0183 | 0.0029 | 4.70 | 0.095 |
| Safety | 0.6959 | -1.329 | 0.2115 | 341.86 | 0.000 |
* Null hypothesis was rejected under Kruskal Wallis test for p < 0.10 that is between groups difference is statistically significant.
3.3. CHARACTERIZATION (STAGE 3 OF ISAC)
Characterization is the final stage in the ISAC analysis procedure. It involves an in-depth examination of the segments identified in the segmentation phase, with the goal of defining the distinctive characteristics. The researchers used both demographics, behavioral variables and the segments obtained from cluster analysis for characterization in this study.
| Food Value Dimensions | Ethical | Environmental | Emotional | Economic | Safety |
|---|---|---|---|---|---|
| Gender | Male -0.106 | -0.138 | -0.289 | 0.039 | 0.116 |
| Female 0.048 | 0.063 | 0.132 | -0.018 | -0.053 | |
| Age | 18-40 years old -0.099 | -0.172 | -0.216 | 0.019 | 0.400 |
| 41-65 years old 0.036 | -0.024 | 0.114 | 0.054 | 0.142 | |
| 65+ years old 0.039 | 0.158 | 0.050 | -0.071 | -0.460 | |
| Race | White -0.157 | -0.246 | -0.221 | 0.041 | -0.351 |
| Black/African American 0.049 | 0.094 | 0.104 | -0.019 | 0.108 | |
| Others 0.023 | -0.334 | -0.706 | 0.129 | 0.046 | |
| Education | Middle school & below 0.381 | -0.314 | 0.142 | 0.190 | -0.272 |
| High school degree 0.278 | -0.094 | -0.059 | 0.113 | 0.089 | |
| Associate & Bachelor -0.100 | 0.046 | 0.075 | -0.036 | -0.026 | |
| Master & Doctorate -0.474 | 0.154 | -0.103 | -0.215 | -0.098 | |
| Work | Full time -0.084 | -0.065 | 0.007 | 0.046 | 0.268 |
| Part time -0.196 | -0.268 | -0.204 | -0.130 | 0.369 | |
| Unemployed 0.096 | 0.083 | 0.010 | -0.033 | -0.286 | |
| Income | 36000 and lower -0.791 | 0.011 | 0.397 | 0.106 | -0.883 |
| 36001-70000 -0.840 | -0.234 | -0.053 | 0.039 | -0.639 | |
| 70001 and higher -0.451 | 0.152 | -0.014 | 0.087 | 0.511 | |
| Visiting Food Facility | 0 0.184 | -0.166 | -0.094 | 0.049 | -0.603 |
| 1 -0.011 | 0.010 | 0.006 | -0.003 | 0.037 | |
| Remote Ordering | 0 -0.003 | 0.039 | -0.012 | -0.016 | -0.026 |
| 1 0.034 | -0.180 | 0.098 | 0.070 | 0.156 |
One of the behavior variables is visiting food related facilities. Participants were asked whether they visit food related facilities for eating out. Those who visited food facilities generally show an average score on environmental dimension, while the group who never visited food facilities show lower score on environmental dimension, and high score on safety dimension. One of the underlying reasons for this group not visiting outside food outlets, apart from lack of transportation, may be that they place too much emphasis on safety.
3.4. FINDING FROM QUALITATIVE COMPONENT
The In-Depth Interviews (IDIs) and observations of participants brought to the conscious attention of participants insights that existed just out of reach of their everyday consciousness. For example:
- Even though surveys revealed significant numbers of individuals read labels, participants were purchasing items that had an expired sell-by date or whose sell-by date would soon expire. They paid no attention to the unit price of the product because the need to take advantage of a sale has such an elevated level of significance. The revelation of inattention to all the information on the label prompted participants to reevaluate what they look for on labels.
- When considering the role that varied factors play in determining their quality of life, the IDIs revealed that participants ranked spirituality and mental wellbeing above food security.
- Observation revealed residents purchase mostly packaged and processed goods even when fresh vegetables are available, which is counter to widespread belief that access, and affordability are the key drivers of consumption of fresh fruits and vegetables. The fact is that shelf-life, ease of handling and storage, knowledge about how to prepare and include vegetables and fruits in their diet are also important considerations for individuals living in food deserts.
- Convenience, perceived role in physical well-being and know-how for selecting and preparing food to meet certain nutrition and health goals play important roles in everyday decision making about food.
- There is the recognition among participants that good nutrition is an important aspect of achieving and maintaining a desirable level of physical activity. However, motivation to adjust eating habits to improve nutritional status is low.
4. Discussions
Given that the research was conducted in food deserts and that residents are typically of lower education and income, it is not surprising that residents place higher value on taste, appearance, and price, and lower value on origin, tradition, fairness, respectively. Other research results, for example Pérez-Villarreal et al. in 2020, Yang and Panjaitan in 2021, and Thomas et al. in 2023 confirm our findings. In addition, it is not surprising that food price is the most important dimension for food desert residents due to their lower income level. Factor analysis revealed that five dimensions, namely ethical, environmental, and social, economic, emotional and safety, are the main dimensions of the food values for the sample of food deserts in the study area. This result confirms and supports previous studies.
The following five groups or dimensions were identified. Taste and appearance variables formed a separate group, and this group was labelled ‘emotional/sensory’ group. Similarly, naturalness, nutrition and environmental impact group was labelled ‘environmental and social’ group; price and convenience as ‘economic’ group; and tradition, fairness, and origin as ‘ethical’ group. Safety remained as a stand-alone dimension.
Food desert residents recording a positive score on a dimension indicate a positive perception of that food value dimension, while the residents with a negative score have a negative perception of that dimension. Segment I represent 36% of residents, and they have a positive perception of all food values except economical value. Therefore, it is labelled as the “positive value” segment. Segment II represents 26% of the respondents, and they have a favorable view of sensory and economic values, but unfavorable views of ethical, social, and environmental values. That is why this segment is labelled “hedonic.” Segment III represents 38% of the food desert residents, and they have a negative perception of most dimensions of food values, which is labelled as “negative value” segment as in our previous work and the literature.
We used characterization analysis to identify personas. The factor scores indicate the influence of demographic and behavioral variables on the food values dimensions and the degree of importance these groups attach to different dimensions. The results obtained showed that females gave higher value ratings to ethical, emotional, and environmental dimensions while they gave lower value ratings to economic and safety dimensions when compared with males. While the elderly gave higher importance ratings to ethical, environmental, and emotional dimensions, young people gave higher importance ratings to economic and safety dimensions. The findings of previous scientific articles are similar. Since the segments represent personas, segments can be described in terms of their demographic features. For example, the Value-Positive persona (segment) is generally full-time employed, middle-aged, African Americans, living in one-person households. The Hedonic persona consists mostly of women, full-time workers, and young adults. Older, unemployed, and low-income individuals represent the Value-Negative persona. These results clearly demonstrate how each persona differs according to its demographic and behavioral characteristics. This information can be used to develop targeted strategies. For example, using value positive personas as exemplars to inspire changes in value negative personas. The social learning produced from the interaction between exemplars and peers is a powerful driver of behavior change.
Additionally, policymakers and program planners can formulate digital representations of personas that facilitates visualization making key attributes and their implications for food-related behavior real, personal, and human that generates a powerful motivating force for the individual. Policymakers can use program scenarios to model and visualize changes in personas relationship with food over the short or long run. As a result of this digital modeling, policymakers can visualize the impact of their policies before implementation and the community can see themselves represented in personas (their digital twins) and grasp the consequences of attributes and action represented in personas for their own life.
Our qualitative analysis provides another vantage point from which to view the relationship of food desert residence with food. For example, low-income underserved residents of food deserts are not alone in not attending to all the details that may be important or relevant to their decision-making. For example, using all the information available on food labels. Watts points out that the frame problem in science, and social science in particular, limits our ability to consider all the information that may be relevant to decision making. Furthermore, he notes that our mental capacity and psychological disposition make it likely that we will ignore salient or key features of a thing or situation. Recognizing this problem, policymakers and program planners can devise strategies to assist individuals identify and use relevant information. The paradox evident in recognition of the value of good nutrition and the lack of motivation to act accordingly can be understood by considering that the impact of good nutrition is not immediately obvious, and humans are not good at responding to slow changing phenomenon. Additionally, low-income people evaluate and use different priority frameworks to guide their decision making. Banerjee recounts a story in which a poor food insecure Moroccan defied received logic when he used scarce cash to purchase a widescreen television instead of prioritizing food purchase. Further, our application of Best-worst analysis revealed that food desert residents rated spiritual wellbeing as more important than food security. Armed with these insights policymakers and program planners are in a better position to deliver more effective programs that help food desert residents address food security issues.
Conclusion
This study conducted an in-depth investigation of the food experience of food desert residents in Guilford County. ISAC Analysis Procedure as first published in this study was employed to systematically identify, segment, and characterize distinct groups within the population. The study’s findings offer valuable insights into the complex interplay of social, economic, and environmental factors that influence food desert residents’ relationship with food.
The characterization stage revealed three distinct segments: the value-positive segment, which is generally composed of full-time employed, middle-aged Black/African Americans living in one-person households; the hedonic segment, which consists mostly of women, full-time workers, and young adults who prioritize pleasure and convenience in their food choices; and the value-negative segment, represented by older, unemployed, and low-income individuals who show a negative perception of and less engagement with food values.
Each segment with its unique demographic and behavioral characteristics, demonstrates the diversity of food value perceptions within the population. The qualitative findings further enriched these insights, revealing that while many residents recognize the importance of good nutrition, factors such as know-how, convenience, shelf life, the preference of young children and ease of preparation often override nutritional considerations in making their food choices. Additionally, the qualitative data highlighted a paradox that residents acknowledge the value of good nutrition but lack the motivation to adjust their eating habits accordingly, which underscores the need for strategies that address both awareness and behavioral change, social learning, and exposure as defined by Pentland. Thus, underserved food desert residents and possibly other resource challenged groups have a relationship with food and food security that does not fit neatly into mainstream way of thinking, modeling, and acting regarding food.
The personas developed from the segments provide a deeper understanding of the target audience, enabling the creation of more tailored and effective strategies. For instance, strategies for the Value-Positive segment could focus on enhancing the quality and reliability of food options and using them as exemplars to inspire positive changes in behavior of their value negative peers. In the case of the Hedonic segment, strategies might emphasize convenience and pleasure in food choices-making healthy food tastier. For the value-negative segment, interventions might need to focus on addressing fundamental barriers such as affordability and access to safe and nutritious food and provide positive experience through exposure and social learning opportunities.
As a final point, the ISAC Analysis Procedure, as applied in this study, is a more robust framework for analyzing complex social phenomena like food choice behavior in food deserts. The integration of both quantitative and qualitative data has allowed for a more comprehensive understanding of the diverse factors influencing food choices. The insights gained from this research can guide policymakers and stakeholders in designing targeted interventions that not only meet the immediate needs of these communities but also contribute to long-term health improvements and social equity.
Conflicts of Interest:
The authors declare no conflict of interest. The funders had no role in the design of the study; in the collection, analyses, or interpretation of data; in the writing of the manuscript, or in the decision to publish the results.
Funding:
This work was supported by the USDA National Institute of Food and Agriculture, Evans- Allen project.
IRB determination:
The determination was made that Study #19-0236 did not require IRB review; 06/17/2020.
Data availability:
Data is available upon request.
References
- Guilford County DHHS. State of Guilford County Health Report. Guilford County Department of Health and Human Services. Available at: https://www.guilfordcountync.gov/our-county/human-services/health-department/health-statistics/2017-state-of-guilford-county-s-health-report 2017. Accessed June12, 2024.
- Guilford County Department of Public Health. Health concern access to healthy food. Community Health Assessment Report; 2012-2013. Available at: https://www.guilfordcountync.gov/our-county/human-services/health-department/health-statistics/2012-2013-community-health-assessment . Accessed June 12, 2024.
- Brown C, Dukas S. A national study of the association between food environments and county-level health outcomes. J Rural Health. 2011; 27:367-379.
- Wrigley N, Warm D, Margetts B, Whelan A. Assessing the impact of improved retail access on diet in a ‘food desert’: A preliminary report. Urban Stud. 2002; 39:2061-2082.
- Partnership To Fight Chronic Disease North Carolina Report. Available at: https://www.fightchronicdisease.org/sites/default/files/download/PFCD_NC_FactSheet_FINAL1.pdf Published 2024. Accessed August 1, 2024.
- Thomas TW. Food Security, Food Desert, and Common-Sense Solutions. Open Access J Biogeneric Sci Res. 2021;1-3. doi:10.46718/JBGSR.2021.07.000167.
- Caspi CE, Sorensen G, Subramanian SV, Kawachi I. The local food environment and diet: A systematic review. Health Place. 2012;18(5):1172-1187.
- Walker RE, Keane CR, Burke JG. Disparities in access to healthy food in the United States: A review of food deserts literature. Health Place. 2010;16(5):876-884.
- Glanz K, Bader MDM, Iyer S. Retail grocery store marketing strategies and obesity. Am J Prev Med. 2012; 42:503-512.
- Becker GS. The Economic Approach to Human Behavior. University of Chicago Press; 1976.
- Shove E, Pantzar M, Watson M. The Dynamics of Social Practice: Everyday Life and How it Changes. SAGE Publications; 2012.
- Pentland A. Social Physics: How Good Ideas Spread-The Lessons from a New Science. Scribe Publications; 2015.
- Watts DJ. Everything is Obvious: Once You Know the Answer. Crown Business; 2011.
- Kuijer L. Implications of Social Practice Theory for Sustainable Design. [Doctoral Thesis]. Technische Universiteit Delft; 2014. ISBN: 978-94-6186-246-4.
- Reckwitz A. The status of the ‘material’ in theories of culture: From ‘social structure’ to ‘artefacts’. J Theory Soc Behav. 2002; 32:195-217.
- Shove E, Watson M, Hand M, Ingram J. The Design of Everyday Life. Berg Oxford; 2007.
- Centola, D. Change: How to Make Big Things Happen. Little, Brown Spark; 2021.
- Christakis NA, Fowler JH. The Surprising Power of Our Social Networks and How They Shape Our Lives: How Your Friends’ Friends’ Friends Affect Everything You Feel, Think, and Do. Little, Brown; 2011.
- Jackson MO. The Human Network. Atlantic Books; 2020.
- Denzin NK, Lincoln YS, eds. Handbook of Qualitative Research. 2nd ed. Sage; 2000.
- Dillman DA, Smyth JD, Christian LM. Internet, Mail, and Mixed-Mode Surveys: The Total Design Method. 3rd ed. John Wiley & Sons; 2009.
- Cochran WG. Sampling Techniques. 3rd ed. Wiley; 1977.
- Rubin DB, Little RJ. Statistical Analysis with Missing Data. John Wiley & Sons; 2002.
- Thompson B. The future of test validity. Educ Res. 2009;38(6):545-556. doi:10.3102/0013189X09346117.
- Thomas TW, Cankurt M. Influence of Food Environments on Dietary Habits: Insights from Quasi-Experimental Research. Foods. 2024;13(13):2013. https://doi.org/10.3390/foods13132013.
- Cankurt M. A Study on the Determination of Farmers’ Demand for Tractor Satisfaction of Tractor Use and Purchasing Attitudes Towards Tractor: The Case of Aydın. [Doctoral Thesis]. Ege University; 2009. https://tez.yok.gov.tr/UlusalTezMerkezi/tezDetay.jsp?id=MINo0CjC2iJewLbypTyrWA&no=52JdzBZ5zimkwRKg5bptJw
- Cankurt M, Thomas T, Gunden C, Miran B. Consumer decision-making styles: Investigation of food shopping behavior. J Food Agric Environ. 2013;11(2):224-227.
- Cankurt M, Miran B, Sahin A. Determining of the Effective Factors on Cattle Meat Preferences: The Case of Izmir. Journal of Animal Production. 2010;51(2):16-22.
- Tabachnick BG, Fidell LS. Using Multivariate Statistics. 5th ed. Pearson; 2007.
- Hair JF, Black WC, Babin BJ, Anderson RE. Multivariate Data Analysis. 7th ed. Pearson Prentice Hall; 2010.
- Tan PN, Steinbach M, Kumar V. Introduction to Data Mining. Pearson; 2006.
- Jain AK, Murty MN, Flynn PJ. Data Clustering: A Review. ACM Comput Surv. 1999;31(3):264-323.
- Kaufman L, Rousseeuw PJ. Finding Groups in Data: An Introduction to Cluster Analysis. Wiley; 2009.
- Creswell JW. Research Design: Qualitative, Quantitative, and Mixed Methods Approaches. 4th ed. SAGE Publications; 2014.
- Kotler P, Keller KL. Marketing Management. 15th ed. Pearson; 2016.
- Solomon MR. Consumer Behavior: Buying, Having, and Being. 12th ed. Pearson; 2018.
- Wedel M, Kamakura WA. Market Segmentation: Conceptual and Methodological Foundations. Kluwer Academic Publishers; 2000.
- Kotler P, Roberto N, Lee N. Social Marketing: Improving the Quality of Life. 2nd ed. SAGE Publications; 2002.
- Lanza ST, Tan X, Bray BC. Latent Class Analysis with Distal Outcomes: A Flexible Model-Based Approach. Struct Equ Model. 2013;20(1):1-26.
- Muthén LK, Muthén BO. Mplus User’s Guide. 8th ed. Los Angeles, CA; 2017.
- Dolnicar S, Grün B. Challenging ‘factor-cluster segmentation.’ J Travel Res. 2008;47(1):63-71.
- Bhatnagar A, Gopalaswamy AK. A Persona-Based Approach for Customer Segmentation and Marketing. Int J Inf Manage. 2017;37(1):13-20.
- Saarijärvi H, Sutinen UM, Harris LC. Uncovering Consumer Value Formation: A Study of Employee-Customer Interactions in Mobile Banking. Int J Bank Mark. 2017;35(1):90-102.
- Dibb S, Simkin L. Targeting Segments and Positioning. Int J Mark Res. 2016;58(6):781-804.
- González-Rodríguez M, Díaz-Fernández MC, Hernández-Fernández A. Profiling Consumers in the Sharing Economy: Motivations and Barriers for Participation. J Bus Res. 2020; 112:208-218.
- Anagnostopoulos A, Skourlas C. Segmenting Consumers Based on Their Shopping Behaviour Patterns in the Retail Sector. J Retail Consum Serv. 2020; 55:102120.
- Tavakol M, Dennick R. Making sense of Cronbach’s alpha. Int J Med Educ. 2011; 2:53-55.
- Costello AB, Osborne JW. Best practices in exploratory factor analysis: Four recommendations for getting the most from your analysis. Pract Assess Res Eval. 2005;10(7):1-9.
- Fabrigar LR, Wegener DT, MacCallum RC, Strahan EJ. Evaluating the use of exploratory factor analysis in psychological research. Psychol Methods. 1999;4(3):272-299.
- Zwick WR, Velicer WF. Comparison of five rules for determining the number of components to retain. Psychol Bull. 1986;99(3):432-442.
- Kaiser HF. An index of factorial simplicity. Psychometrika. 1974;39(1):31-36.
- Yong AG, Pearce S. A beginner’s guide to factor analysis: Focusing on exploratory factor analysis. Tutorial Quant Methods Psychol. 2013;9(2):79-94.
- Mazzocchi M. Statistics for Marketing and Consumer Research. SAGE Publications; 2008.
- Wedel M, Kamakura WA. Introduction to the Special Issue on Market Segmentation. Int J Res Mark. 2002;19(3):181-183.
- Osterwalder A, Pigneur Y. Business Model Generation: A Handbook for Visionaries, Game Changers, and Challengers. Wiley; 2010.
- Salinas EM, Perez JMP. Modeling the Brand Extensions’ Influence on Brand Image. J Bus Res. 2009;62(1):50-60.
- Dibb S, Simkin L. Targeting Segments and Positioning. Int J Mark Res. 2016;58(6):781-804.
- González-Rodríguez M, Díaz-Fernández MC, Hernández-Fernández A. Profiling Consumers in the Sharing Economy: Motivations and Barriers for Participation. J Bus Res. 2020; 112:208-218.
- Anagnostopoulos A, Skourlas C. Segmenting Consumers Based on Their Shopping Behaviour Patterns in the Retail Sector. J Retail Consum Serv. 2020; 55:102120.
- Tavakol M, Dennick R. Making sense of Cronbach’s alpha. Int J Med Educ. 2011; 2:53-55.
- Costello AB, Osborne JW. Best practices in exploratory factor analysis: Four recommendations for getting the most from your analysis. Pract Assess Res Eval. 2005;10(7):1-9.
- Fabrigar LR, Wegener DT, MacCallum RC, Strahan EJ. Evaluating the use of exploratory factor analysis in psychological research. Psychol Methods. 1999;4(3):272-299.
- Zwick WR, Velicer WF. Comparison of five rules for determining the number of components to retain. Psychol Bull. 1986;99(3):432-442.
- Kaiser HF. An index of factorial simplicity. Psychometrika. 1974;39(1):31-36.
- Yong AG, Pearce S. A beginner’s guide to factor analysis: Focusing on exploratory factor analysis. Tutorial Quant Methods Psychol. 2013;9(2):79-94.
- Mazzocchi M. Statistics for Marketing and Consumer Research. SAGE Publications; 2008.