


Optimized SUV Values in FDG PET-CT for Lung Cancer
The use of the optimized standard uptake value – SUVopt – in the interpretation of FDG PET-CT IN Adrenal Gland and Pleural Based Malignancy
Richard R. Black, D.O.1*, Ryan Misseldine ARSO, MBA, BS, RT (N) (MR)2, Andrew Prideaux, PhD3, Michael Culley, CNMT, MS4, Gary Onik M.D.5, David Howell M.D.6
- Accuquan P.O. Box 89, Chagrin Falls, OH 44022, USA
- CNMT 10701 East Blvd, VA Northeast Ohio Healthcare System, Cleveland, Ohio 44106, USA
- Medical Science Liaison Hermes Medical, 3462 E Wilson St, Farmville, NC 27828, USA
- 19368 Cruise Drive, Venice, Florida 34292, USA
- Adjunct Professor of Mechanical Engineering, Carnegie Mellon University, 401 East Las Olas Blvd, Suite 130-407, Fort Lauderdale, FL, 33301, USA
- Department of Radiation Oncology, Ohio Health Cancer Center, 75 Hospital Drive, Athens, OH 45701, USA
OPEN ACCESS
PUBLISHED: 30 November 2025
CITATION: Black, RR.,Misseldine, R.,et al., 2025. The use of the optimized standard uptake value – SUVopt – in the interpretation of FDG PET-CT IN Adrenal Gland and Pleural Based Malignancy. Medical Research Archives, [online] 13(11). https://doi.org/10.18103/mra.v13i11.7054
COPYRIGHT: © 2025 European Society of Medicine. This is an open-access article distributed under the terms of the Creative Commons Attribution License, which permits unrestricted use, distribution, and reproduction in any medium, provided the original author and source are credited.
DOI https://doi.org/10.18103/mra.v13i11.7054
ISSN 2375-1924
ABSTRACT
Goal: The purpose of this study was to demonstrate that standard uptake value (SUV) calculations standardized to normal liver parenchyma, and utilizing previously defined thresholds for differentiating benign and malignant disease, yield results superior to non-standardized SUVs. This methodology can be applied to all fluorodeoxyglucose positron emission tomography (FDG PET) interpretations.
Methods: Patients (n=132) with a history of primary lung carcinoma were studied with FDG PET to determine the presence or absence of metastatic disease. Images were assessed using semi-quantitative analysis with SUVmax generation. All SUVs were calculated with and without individualized correction for normal liver parenchymal uptake and the standard uptake value optimized (SUVopt) was derived. Results of corrected and un-corrected SUVs were compared with the pathologic results in two clinical disease categories: 1. pleural metastases (n= 87), and 2. adrenal metastases (n= 45).
Results: The sensitivity and specificity for corrected versus uncorrected SUVs for pleural metastases were: 95.6% versus 93.8%, and 77.0% versus 42.1%, respectively. For adrenal metastases the results were: 94.5% versus 91.6%, and 88.9% versus 45.0%, respectively.
Conclusions: In patients with primary lung cancer, the utilization of SUVs corrected for the normal liver parenchyma provide more accurate results in defining the presence or absence of metastatic disease to pleura and adrenal glands.
Keywords
FDG PET, SUV, SUVopt, adrenal gland, pleural malignancy, lung carcinoma, metastatic disease
INTRODUCTION
Since cancer is currently amongst the leading causes of death worldwide(1), it seems intuitive that the early diagnosis, appropriate staging and restaging of the various malignancies and the accurate assessment of treatment intervention would assume the highest priority for practicing clinicians and their respective patient populations. With the advent of the discipline of medical imaging techniques, the development of various technologies has been developed in an effort to assist in the overall management of malignant disease. The imaging evaluation of patients with suspected malignancy includes identification of abnormalities, their characterization and final disposition of their content. These considerations are at the core of proper treatment of prospective cancerous maladies to include the initial diagnosis of suspected malignancy, staging of known disease, restaging of the disorder and of equal importance the evaluation of prescribed treatment regimens. At the most fundamental level, the clinician seeks to determine the presence or absence of malignancy. The pursuit to correctly identify malignant disease has led to the introduction of a variety of sophisticated imaging modalities to include FDG PET, PET-CT imaging. The preference of malignant cells for anaerobic consumption of glucose-pyruvate was initially proposed by Warburg in 1956(2). Glucose has been shown to be the primary energy source for cancer cells to fuel cancer cell division, growth and the dissemination and maintenance of metastases. The use of FDG PET provides the capability to assess the status of glucose metabolism at the cellular level. The premise of utilizing labeled glucose to distinguish between benign and malignant processes is the inherent metabolic aberrances related to malignant disease with facilitated rates of glucose metabolism that may exceed 200 times the glycolytic rates of normal non-neoplastic cells(3). Consequently, the implementation of FDG PET has expanded significantly to include a variety of neoplastic disorders in the initial diagnosis, staging, restaging of the specific malignancies as well as assessment of therapeutic intervention(4-5). The objectives of FDG PET-CT in the evaluation of the patient with known or suspected malignant disease is to identify abnormal FDG uptake and discern malignant from nonmalignant disease(5). The key to correct interpretation of the presented FDG PET-CT image data sets is to consistently be able to define normal uptake, abnormal-nonmalignant uptake and abnormal-malignant uptake of the radiopharmaceutical FDG. This can be accomplished with visual-qualitative analysis of the metabolic (FDG PET) images with typical comparison to visceral uptake; mediastinal blood pool or liver parenchyma(6). Invariably this approach will be associated with a significant degree of subjectivity and resulting variability associated with diminished specificity. Readily applicable semi-quantitative evaluation is possible with FDG PET secondary to the inherent nature of this nuclear medicine examination since the generation of count statistics can be utilized in the widely utilized Standard Uptake Value (SUV) for potentially differentiating malignant and non-malignant disease(7). The generally accepted SUV cutoff for the categorization of neoplastic and non-neoplastic disease has been reported to be 2.5(8). However, multiple additional works have refuted the use of this guideline(9). Moreover, the use of different thresholds for the designation of malignant disease based on the location of involvement(10-11) have been reported which likely contribute to decreased specificity associated with the use of a single value of 2.5 as a distinguishing characteristic for defining the presence of cancer involvement. The reproducibility of semi-quantitative analysis of the FDG PET study is frequently compromised due to the variability in the values obtained between and within individuals on the same imaging device. Additionally, the acquisition of examinations on the same patient on different devices further increases the inconsistency and reduces the accuracy of the examination. Standardization of semi-quantitative uptake of glucose metabolism has become a frequently discussed peer-reviewed literature topic in the effort to increase the accuracy, objectivity, and acceptance of the FDG PET examination(12-14). Non-standardization and heterogeneity of the individually derived standard uptake values has led to a lack of application in the differentiation of malignant and non-malignant disease. Therefore, the generated SUV has little relevance for accomplishing the task of discriminating between malignant and benign disease status. Standardization may be achieved through the use of a constant visceral reference. In turn this could be employed to discern a corrected SUV to the patient and not to hardware acquisition device. The normal liver parenchyma generated SUV may be used for comparison to areas of suspected malignant involvement due to its unique stability over time(15-17). The normal liver has been assigned values of approximately 2.0 in properly calibrated hardware and dosing procedures, and consequently this value may be used as a constant in the computation of corrected SUV values(18-19). To complete the objective of enhancing accuracy, the application of different thresholds for differentiating malignant and non-malignant processes, based on location specific SUVs may be applied in the effort to maximize the capability of the FDG PET examination. Our group recently published a series comparing standardized SUVs accuracies for liver parenchymal, peripheral and thoracic centralized lymph nodes compared to non-standardized calculations. We demonstrated the clear superiority of the derivation of optimized compared to non-optimized standard uptake values in terms of sensitivity and specificity(20). The introduction of sophisticated analytical tools in the field of imaging to include machine and deep learning, as well as the vast array of radiomics are poised to assist and potentially augment the landscape of diagnostic imaging interpretation. The list of characteristics analyzed with robust radiographic features number in the thousands and can be used to predict disease behavior, overall survival, and clinical outcome. Currently these modalities are beyond the scope of practice of typical community-based medicine. These developments are proposed to facilitate the data made available to the practicing clinician and to provide more precise information in the hope of optimizing patient care(20). However, the use of the optimized standard uptake value SUVopt allows for the consistent, precise differentiation of malignant and non-malignant disease and additionally, for accurately determining the response to therapeutic endeavors by investigating and establishing the biochemical and molecular status of the FDG PET scan abnormality. The entire field of technological advance regardless of the nomenclature utilized or applied does not standardize the SUV metric, which serves as the foundation for the very problem with failure to produce accurate FDG PET imaging, the application of the SUV metric. The rationale and purpose of this work is to demonstrate the readily available accentuated ability of FDG PET imaging in the prediction of malignant and non-malignant involvement in areas of increased glucose metabolism suspected of harboring neoplastic disease based on corrected and standardized SUV calculations in pathologically confirmed adrenal gland and pleural neoplastic disease, expanding on the principles previously demonstrated. This deals with the exclusive metabolic and biochemical knowledge that is obtainable only through the optimization and standardization of the FDG quantitative metric, the optimized standard uptake value, SUVopt previously discussed and presented(20).
MATERIALS AND METHODS
PATIENTS
The results of FDG PET-CT imaging and histopathologic reports were available for a total of 132 patients with known primary lung carcinoma, who had FDG PET-CT scans based upon available correlated pathologic data and were completed in the timeframe between 2005 and 2012 for investigation of potential malignant metastatic disease. These images were retrospectively analyzed for the presence or absence of malignancy based on site specific liver corrected SUV calculations and the results were compared with pathologic findings. Pathology reports were made available to the interpreting physician at the time of initial FDG PET scan interpretation. This information was saved for future analysis and correlation to the results of the corrected calculated SUVs in several different locations to include the(1) thoracic pleura in patients with known lung carcinoma at staging or restaging of the disease (n=87, 63 initial staging and 24 restaging)(2), Adrenal glands (n=45, 31 initial staging and 14 restaging). Acquisition devices included: GE Discovery 600 PET-CT scanner (n=65), Philips Gemini GXL PET-CT scanner (n=34) and Siemens Biograph 16 slice high resolution PET-CT scanner (n=33). The following data for each patient were recorded at the time of presentation for scan acquisition: age in years, weight in kg, patient gender, and the type of malignancy. Scan related data were also recorded and included the serum glucose at time of FDG, total injected FDG injection, time from FDG injection to initiation of image-bed position acquisition on the individual PET-CT scanner, SUV generation in normal liver parenchyma. None of the patients had received cytotoxic systemic chemotherapy or radiation therapy within 6 months of the examination. All patients received pre-scanning instructions as part of the normal protocol and included avoiding strenuous exercise up to 24 hours prior to the scheduled injection time, preferred overnight fasting for patients with acquisitions scheduled for the morning or at least a 6 hour fast if examinations were scheduled for the afternoon and pre-injection hydration with non-flavored water. Preferably the intravenous injection of the FDG radiopharmaceutical via venous access was accomplished apart from indwelling port placement when accessible. To ensure relatively constant liver activity, scan acquisition was begun at approximately 55 to 100 minutes post glucose administration(16). No patients received oral or intravenous contrast for the CT portion of the examination to avoid potential artifact(21). The administered dose of FDG was calculated in each patient by the measurement of initial FDG activity in the syringe prior to introduction of the labeled glucose and then after injection. A low dose CT scan for the purposes of anatomic correlation and attenuation correction of the PET data set was obtained in all patients. CT dose reduction was performed on the individual scanners. Following the CT portion of the examination, the PET acquisitions were initiated immediately thereafter with all patients undergoing image acquisition from the skull base to the mid thigh. Calibration procedures were followed for the PET scanner and a dose calibrator with the compliance to standard sequential check values performed weekly(19). The corrected residual dose based on the decay factor of F18 was accomplished in all patients. Quality control procedures were followed with regard to individual PET scanning device utilizing a 68 Ge source which was adherent to the individual manufacturer protocols. Vendor recommended processing was followed for each examination with general parameters including CT scans being processed utilizing filtered back-projection and PET emission data subjected to iterative reconstruction processing. All FDG PET-CT studies were interpreted using a HERMES Nuclear Diagnostics workstation utilizing the Volume Display software. The calculated standard uptake values (Y) were obtained with the following methodology including the patient’s body weight (kg), concentration of glucose within the specified region of interest and the injected dose of FDG based on the following calculation method: with: R (c)-trepresenting radioactivity concentration in the region-volume of interest at time t, d = injected dose of the radiopharmaceutical and w = the patient’s body weight. The reference normal liver parenchymal SUV was obtained by placing a circular region of interest in the hepatic parenchyma with three successive measurements in the coronal plane, with the mean of the three maximum SUV representations in the specific location of the hepatic parenchyma recorded. Any area of increased or decreased uptake within the liver (metastases or primary liver malignancy) were avoided. No patient had significant liver parenchymal abnormalities precluding the generation of the reference hepatic parenchymal quantitative reference value. Tumor site SUV under evaluation was compared to the maximal normal liver parenchymal SUV. In order to avoid intra-lesion variability, the selected region of interest included the entire area of abnormal uptake for eventual comparison to the normal liver SUV. The final calculated standard uptake value (X) assigned to the selected metabolic abnormality was obtained by correcting the value derived from the defined area of interest to the liver constant with the unchanging value of LC. The conversion of the uncorrected SUV to corrected SUV is based on the following principle: where x = the unknown corrected standard uptake value in the area of interest, a = uncorrected SUV in the specified area of interest, l = the generated liver SUV in the patient based on three ROIs in non-diseased liver parenchyma and LC refers to the normal liver constant value which is proprietary, and patent protected.
STATISTICAL METHODS
There were two separate sets of SUVs generated based on previously reported threshold cutoff values for two locations to include the thoracic pleura and the adrenal gland(s). A composed derivation data set consisted of uncorrected and non-standardized SUV thresholds as described previously(10-11). The classification of the SUVs included a value that was considered positive for neoplastic involvement if it exceeded the threshold value reported defined for thoracic pleural or adrenal gland malignancy(10-11). Additionally, the designation of ‘borderline consistent with neoplasm’ was applied to those abnormalities that demonstrated a 20% decrease from the threshold cutoff value. Finally, a characterization of ‘negative for malignancy’ was issued if the SUV was greater than a 20% decrease from the prior defined threshold value. This approach was based upon data published on 68 patients with known lung carcinoma in the evaluation of 690 mediastinal lymph node stations(21) 22. A similar approach was applied in categorizing our corrected-standardized SUV to the two separate groups of patients. Threshold values of corrected SUVs at each site were: 1.Thoracic pleura thresholds: SUV > 3.0 for defining the presence of malignancy, 2.4-2.94 for borderline classification, and < 2.39 for classification of non-malignant. 2.Adrenal gland thresholds: quantified SUV > 2.5 for defining presence of malignancy, 2.1-2.45 for borderline classification, and < 2.05 as negative for neoplastic involvement. Individual SUV data were analyzed for the impact of the corrected SUV compared to the uncorrected SUV.
ETHICAL CONSIDERATIONS
The data on each individual patient utilized for selective scan analysis was collected from provided information for the purposes of scan interpretation. Only a small percentage of cases interpreted had pathologic correlative records available for evaluation and subsequent relation to scan interpretative results. All pertinent subject statistics and records were reviewed retrospectively with no consequent risk to the patient or alteration in patient management effected by the retrospective review. Informed consent for each subject included in the analysis was obtained by the facility performing the FDG PET-CT examination. The intent of the provided information was provision of all associated information to the interpreting physician at the time of initial scan examination and report generation. Fully aware that the source materials are protected health information (PHI), data appraisal was conducted following de-identification according to the HIPAA Privacy Rule Standard defined in 45 CFR 164.514b. Hence an application for an exemption to IRB review was submitted to an independent institutional review board, Western Institutional Review Board with a waiver for HIPAA Authorization exemption status granted.
RESULTS
PATIENT CHARACTERISTICS
A total of 132 patients with were included in the analysis based on the peer reviewed literature’s reported thresholds for definition of malignant disease. (references: pleura and adrenal gland) Group 1 included 87 patients with known primary lung carcinoma evaluated for the presence of pleural metastases. 45 individuals with lung carcinoma and suspected adrenal gland metastatic disease comprised Group 2. A total of 73 males and 59 females were included in the investigation. Subject age range was 38-82 years. The mean age of the entire cohort of patients was 58.76 years. Only those subjects with confirmed histology for the presence or absence of malignant disease were included in the analysis. The patient population characteristics are summarized in Table 1 for both groups of patients.
| Group | N (M/F) | Age Range (y) | Presenting indication | Non-disease liver parenchymal SUV | Within-person coefficient of variation for normal liver parenchymal SUVs |
|---|---|---|---|---|---|
| Thoracic pleura | 87 (45/42) | 38-82 | 63 initial staging & 24 restaging | 2.50 + 1.05 (0.9-6.1) | 0.036 (0.0-0.20) |
| Adrenal gland | 45 (28/17) | 40-79 | 31 initial staging & 14 restaging | 2.425 + 0.47 (1.4-3.8) | 0.030 (0.0-0.09) |
| Total Group | 132 (73/59) | 38-82 | 2.48 + 0.70 (0.9-6.1) | 0.033 (0.0-0.20) |
NORMAL REFERENCE LIVER-HEPATIC PARENCHYMAL GROUP SUV
The range of calculated normal liver parenchymal standard uptake values was 0.9 to 6.1 for both groups. The mean generated normal-non-diseased liver parenchymal SUV for all cohorts was calculated to be 2.48 with a generated SD of +0.70. The range and mean normal liver parenchyma SUV for the individual groups was as follows: Thoracic pleura: range 0.9-6.1 with a mean of 2.50 + 1.05, and adrenal gland: range 1.4-3.8 with the mean noted to be 2.45, SD + 0.47. Regarding the coefficient of variation for the three derived normal liver parenchymal SUVs, the range combining both the pleura and adrenal gland groupings was 0.0-0.20 with a mean value of 0.033. The individual group ranges and mean values were calculated to be 0.0 – 0.20 and 0.036 respectively for the thoracic pleura group, and 0.0 – 0.09 with a mean value of 0.030 for the adrenal gland category. No subject in this series had diffuse liver disease (metastatic or cystic) that would preclude localization of normal tissue for the generation of the liver reference value. All patient population characteristics are summarized in Table 1.
Group 1: Thoracic Pleura Cohort
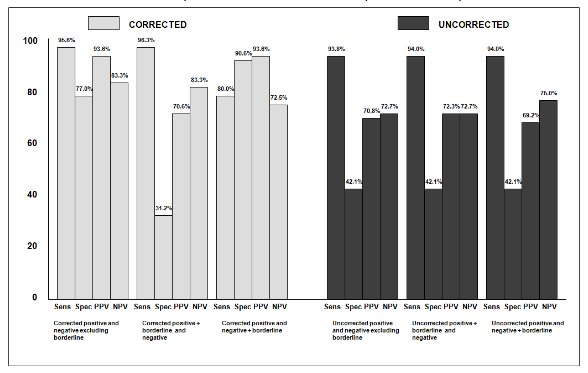
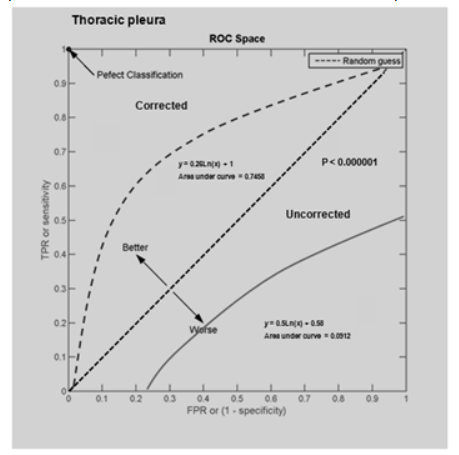
A total of 87 patients were evaluated in this group. A total of 47 patients had calculated corrected standard uptake values of > 3.0 of which 44/47 had positive histopathological results consistent with malignancy. 28 patients had SUVs of 2.4-2.9 with 9 having pathologic confirmation of neoplasm. Finally, 12 patients demonstrated SUVs of < 2.35. Two of these patients had defined histologic neoplastic involvement. The corresponding sensitivity and specificity for corrected SUVs were 95.6% and 77.0% respectively. The positive predictive value (PPV) was 93.6% with a negative predictive value (NPV) of 83.3%. The sensitivity, specificity, PPV, and NPV for both the corrected and uncorrected SUVs and in addition to the corrected borderline value when added to either the negative or positive categories are shown in Figure 1. The calculated kappa value is 0.746, a standard error of the kappa of 0.107, with a 95% confidence interval from 0.536 to 0.956. Receiver Operator Curves for the corrected and uncorrected data sets are defined in Figure 2 with the respective Area Under the Curves (AUC) of 0.7458 for the corrected data set and 0.0912 for the uncorrected set, P<0.000001.
Group 2: Adrenal Gland Cohort
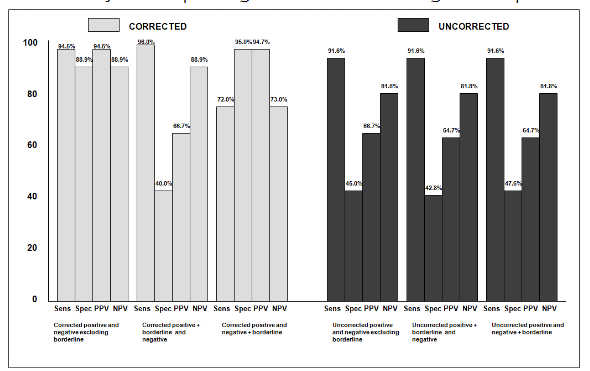
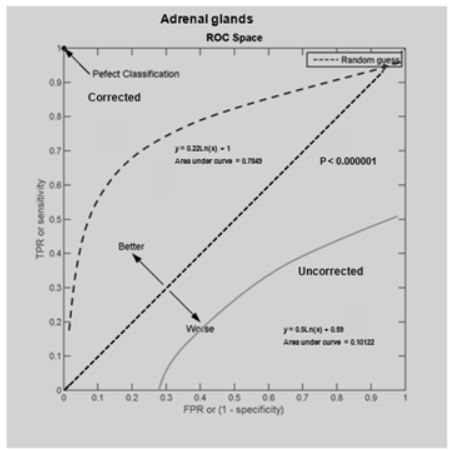
45 patients with suspected adrenal gland metastases were included in this grouping. 18 of the 19 individuals with corrected calculated standard uptake values > 2.5 had positive findings on tissue pathologic analysis whereas only 2/18 revealed neoplasm on histologic sampling if the corrected SUV was < 3.1 and the corresponding ratio < 2.0. 10/26 enrollees with corrected SUVs of 3.2-3.9 had pathologic confirmation of malignancy. The sensitivity and specificity of the corrected positive and negative categories were 94.5% and 88.9%. PPV and NPV were calculated to be 94.5% and 88.9% respectively. Figure 3 demonstrates the sensitivity, specificity, PPV and NPV for corrected and uncorrected SUVs, in addition to the impact of corrected borderline classifications into either positive or negative assignments. Calculated kappa value was 0.836 with a SE kappa of 0.111. The 95% confidence interval is 0.618 to 1.000. The AUC for the corrected SUV data for the adrenal glands is 0.7849 versus 0.10122 for the uncorrected calculated SUVs, P<0.000001 demonstrated in Figure 4.
Total Cohort
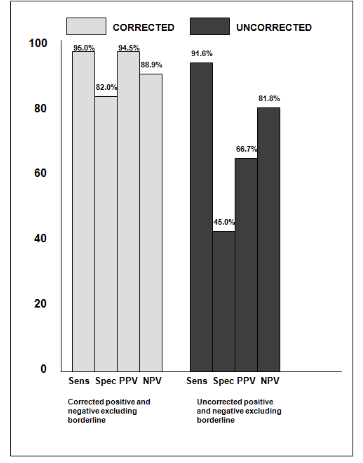
48 of the total 132 patients (36%) had a change in classification based on the results of corrected SUVs. One hundred percent of the patients who had uncorrected negative threshold SUV classifications converted to correct positive assignments had pathologic confirmation of malignant disease. Eighty three percent of the patients with positive uncorrected threshold SUVs reassigned to negative corrected SUV categorization had negative pathologic results. The sensitivity and specificity for the corrected SUV positive and negative categories was 95% and 82% respectively with a PPV of 94.5% and NPV of 88.9%, contrasting to uncorrected SUV designations demonstrating a sensitivity of 91.6%, specificity of 45% and PPV, NPV of 66.7% and 81.8%. For the total cohort the calculated kappa value is 0.784 with a standard error of 0.078. The 95% confidence interval is 0.618 to 1.000. The overall statistical performance in both groups is defined in Figure 5.
DISCUSSION
As stated previously, the need for standardization regarding quantitative assessment of glucose uptake with FDG PET imaging has been repeatedly addressed(12-14). This has contributed to the pursuit and development of other venues to increase the diagnostic capability of imaging procedures in the evaluation of patients suffering from malignant disease. The era of artificial intelligence is upon us and includes the catch all term used in imaging of, Radiomics. Further descriptions invoke the terms of machine learning, deep learning to name a few(23-28). The introduction of this terminology and adoption of the inherent characteristics however do not accomplish what is so urgently needed in the application of FDG PET imaging and that is standardization of the count statistics which are part and parcel of the SUV metric. The lack of reproducible, accurate and consistent quantification whether performed on the same device at the same institution, the same vendor but different devices at the same or variable facilities or lastly completely different locations with differing acquisition hardware has lead to the continued observation and conclusion that significant variability exists in the delivery of the FDG PET interpretation(29-30). Potential sources of error when implementing the SUV as a semi-quantitative indicator of the degree of glucose metabolism within a specific region of interest have been described(31-32). Defined potential errors for the SUV computation have been reported and may further diminish confidence in the reliability of the generated value(33). Biologic factors include the blood glucose level, the uptake period, potentially patient motion. As discussed in detail by Adams et al, the technical factors errors are known to affect the potential accuracy and overall measurement of the calculated standard uptake value. These include the variability of the particular scanner to include the different crystal dimensions, random correction options, TOF capability. Additionally, the reconstruction profiles used may account for at least a 12% difference in phantom studies due to the chosen matrix size, FOV and again Time of Flight technology. 10% changes in the SUV may be attributed to calibration errors relating the scanner and the dose calibrator with a 5% error potentially encountered with timing issues regarding the scanner and the dose calibrator(33). The use of contrast material in the CT portion of the PET-CT examination may induce an approximate 6% error in the calculated SUV(34). Interobserver variability may also play a significant role in the possibility for inaccurate semiquantitative description of glucose uptake with a nearly 20% variation seen for SUV measurements(35). Harmonization which employs the implantation and utilization of a specific phantom to accomplish similar count rates between different scanners regardless of the manufacturer, however clearly does nothing to correctly alter subsequent SUV values and therefore does not standardize the final calculable result(36). Hepatic uptake has been shown to be consistently high and uniform with a low coefficient of variation between sequential subsequent scan acquisitions(37). The normal liver parenchymal SUVs are generally between 2.0-3.0 and have been reported to be approximately 2.0 in a study published from the Sloan Kettering Medical Center(18-19). The accuracy and reproducibility of the normal liver is not altered with correction for the serum glucose levels, normalizing for the body surface area or lean body mass(38). The PERCIST guidelines(15) emphasize the need for the application of the SUL (standard uptake value corrected for lean body mass). Consequently, the application of the SUV in FDG PET reporting is fraught with significant variation and minimal consistency, thereby translating into a value without significant validity that is reported by some interpreters of PET studies and not by others and results in minimal acceptance by the referral community(9,12). No additional effort on behalf of the patient is required for the use of the SUV to derive semi-quantitative data relating to the individual’s PET scan. The calculations are generally available on acquisition-processing stations for the utilization by both the technologist and the interpreting physician. Furthermore, the generation of the SUVopt requires no effort on the part of the patient. The SUV to background ratios have supplanted tumor to background ratios in most instances (32), and may include comparisons to blood pool activity, cerebellum, muscle, mediastinal blood pool, the lung and normal liver(30,39-40). The normal liver parenchymal SUV can be expected to be relatively constant (+/- 2.5%) over the course of the initial 50-110 minutes following FDG injection, which after 110 minutes may demonstrate variability(16). Since the liver SUV remains relatively stable over time as opposed to other tissues(17), the use of the liver SUV may be used for comparison to suspected areas of malignant involvement has been advocated(15). The mean liver SUV has been promoted as opposed to the maximal SUV for the purposes of comparative analysis when compared to other tissues(15). Due to technical considerations and patient convenience, more demanding quantitative methods have limited applicability outside of the academic center environment including compartmental modeling, spectral analysis and graphical methodology(12). The maximal SUV for both the normal liver parenchyma and the identified target lesion was implemented in this series due to the potential variation with the mean value obtained when either drawing a ROI within the abnormality or around the entire metabolic aberration. The degree of variation of a ROI drawn within normal hepatic parenchyma will obviously define significantly less variation between the mean and maximal values. However, considerable variability may be encountered in the target lesion. Therefore, to achieve the maximal SUV within the suspected lesion, the ROI was drawn encompassing the entire metabolic finding which maintained consistency in the use of the specified SUV calculations both from the liver and the object metabolic abnormality. No subject in this series had diffuse liver disease (metastatic or cystic) precluding localization of normal tissue for the generation of the liver reference value. As related by Boktor and associates(41) in their seminal work regarding the establishment of a value for intra-patient variability of the liver reference value SUV in patients being studied with FDG PET imaging for the purposes of assessing the impact of particular treatment regimens, the occurrence of liver variable SUV values would be cause for affecting all SUV calculations. However, when this is encountered and the SUV is corrected for the constant normal liver value, this potential problem is avoided. The defined metabolic abnormality area of interest specific generated SUV can be effectively expressed relative to the variation that is expressed within the patient’s exclusive liver normal parenchymal value. Moreover, their reported caveat of the demonstrated intra-patient variability of the liver SUV potentially not applying to other oncological patient populations would not be expected to be encountered utilizing our method. The implementation of a normal liver parenchymal constant for specific patients would make each calculated value specific for that patient at that timeframe and would apply to subsequent evaluations. The importance of this concept should be clear in the current imaging environment where patients may have sequential FDG PET studies performed at the same location with service provided by coach carriers that may bring different devices to the same location, a change in the coach carrier with a different vendor machine or those patients who procure studies from more than one site with the expected variance in manufacturer scanners. The liver SUV is used implementing relative values in the appraisal of patients undergoing therapeutic intervention being followed sequentially for the purposes of defining the metabolic response to a prescribed treatment regimen. No work to date has utilized the stated constant normal liver value, followed by correcting for the actual liver SUV to derive a standardized SUV value that can then be used for the purposes of differentiating malignant and non-malignant disease and defining the quantitative response to patient specific treatment. The function of site-specific threshold utilization further enhances the specificity of the quantified value. Significant differences in the reliability of the SUV to accurately portray malignant disease and effectively distinguish it from areas of non-cancerous increased glucose metabolism has been the goal of the quantitative approach to FDG PET imaging in an effort to facilitate the specificity of the modality and consequently objectively answer the clinicians’ questions regarding the management of their patient with known or suspected malignant disease. Similar sensitivities defined in this work would be expected for the corrected and uncorrected metabolic data sets, since all patients in the series had some degree of abnormal glucose metabolism in the area of question. What correcting for the liver parenchyma utilizing both a normal liver constant and threshold location specific values accomplished in this investigation, is the capacity to more confidently express the presence or absence of malignant disease shown by the facilitated specificities, positive and negative predicative values accorded with this approach. Looking forward, the diagnostic tactic may be applied to other location specific threshold values. Furthermore, to achieve quantifiable, consistent and reproducible analysis of therapeutic intervention, these factors may be incorporated into defining: (1) the response in terms of differentiating residual malignant disease from post therapeutic change and (2) the accurate quantitative characterization of metabolic stability, metabolic progression or complete or partial metabolic response in those individuals with residual uptake in the specific region of interest utilizing either EORTC Criteria(41) or the PERCIST Criteria(15,36,43).
CONCLUSION
The information analyzed in this study was based on retrospective analysis and could be conceived as derivation data which could negatively impact the capability of application of the results to a wider patient population outside the confines of this analysis. However, the fact that the used thresholds were based on previously reported site-specific values, the data presented is consistent with a validation data set(44), which may be expected to achieve similar results in the general community based scenarios. A prospective study employing the same site-specific threshold values would serve to further substantiate the validated data presented in this report. Rather than abandoning the semiquantitative analysis of the FDG PET examination and its accompanying SUV metric, we propose the modification of the generated standard uptake value SUVopt (20). This is a simple uncomplicated maneuver, is readily assessable and produces superior results when contrasted with current utilized and potential future diagnostic undertaking. By providing a consistent denomination for normalization of metabolic aberrations defined on FDG PET scanning through the utilization of a constant normal reference liver value. The application of location specific thresholds for use in the differentiation and separation of findings of malignant and non-malignant disease, the FDG PET examination can be accurately and consistently accomplished on any vendor hardware imaging device using currently available software configurations that allow for generation of the SUV, without including corrections for lean body mass, serum glucose levels and standard deviations of sequential normal liver reference values. With the provision of objective data, the clinician’s questions can be effectively answered, serving to augment the confidence in the procedure for both the interpreting and referring physicians. This will serve to facilitate patient management and improve clinical patient outcomes. Therefore, in patients with primary lung cancer, the utilization of SUVs corrected for the normal liver parenchyma have been shown to provide more accurate results in defining the presence or absence of metastatic disease to thoracic pleura and the adrenal glands.
Conflict of Interest Statement:
None.
Funding Statement:
None.
Acknowledgements:
None.
REFERENCES
- World Health Organization. Cancer fact sheet N0 297. Available from URL: http://www.who.int/mediacentre/factsheets/fs297/en/
- Warburg, O. On the origin of cancer cells. Science. 1956; 1234: 309-314.
- Bustamante, E. and Pedersen, P. High aerobic glycolysis of rat hepatoma cells in culture: role of mitochondrial hexokinase. Proc. Natl. Aca. Science USA. 1977; 74: 3735-3739.
- Hillner, B.E.; Siegel, B.A.; Shields, A.F.; Liu, D.; Gareen, I.F.; Hunt E.; Coleman, R.E. Relationship between cancer type and impact of PET and PET/CT on intended management: findings of the National Oncologic PET Registry. J. Nucl. Med. 2008; 49: 1928-1935.
- Fletcher, J.W.; Djulbegovic, B.; Soares, H.P.; Siegel, B.A.; Lowe, V.J.; Lyman, G.H.; Coleman, R.E.; Wahl, R,; Paschold, J.C.; Avril, N. Recommendations on the use of 18F-FDG PET in oncology. J. Nucl. Med. 2008; 49: 480-508.
- Lowe, V.J.; Fletcher, J.W.; Gobar, L.; Lawson, M.; Kirchner, P.; Valk, P.; Karis, J.; Hubner, K.; Delbeke, D.; Heiberg, E.V. Prospective investigation of positron emission tomography in lung nodules. J. Clin. Oncol. 1998; 16: 1075-1084.
- Keyes, J.W. SUV: Standard uptake of silly useless value? J Nucl Med. 1995; 36: 1836-1839.
- Turkington, T.G.; Coleman, R.E. Clinical oncologic Positron Emission Tomography: An Introduction. Semin Roentgenol. 2002; 37: 102-109.
- Kinahan, P.E.; Fletcher, J.W. Positron emission tomography-computed tomography standardized uptake values (SUVs) in clinical practice and assessing response to therapy. Semin Ultrasound CT MR. 2010; 31: 496-505.
- Gupta, N.C.; Rogers, J.S.; Graber, G.M.; Gregory, J.L.; Waheed, U.; Mullet, D.; Atkins, M. Clinical role of F-18 fluorodeoxyglucose positron emission tomography imaging in patients with lung cancer and suspected malignant pleural effusion. Chest. 2002; 122: 1918-1924.
- Bagheri, B.; Maurer, A.H.; Cone, L.; Doss, M.; Adler, L. Characterization of the normal adrenal gland with 18F-FDG PET/CT. J. Nucl. Med.; 2004; 45: 1340-1343.
- Tomasi, G.; Turkheimer, F.; Aboagye, E. Importance of quantification for the analysis of PET data in oncology: review of current methods and trends for the future. Mol Imaging Biol. 2012; 14: 131-146.
- Boellaard, R.; O’Doherty, M.J.; Weber, W.A.; Mottaghy, F.M.; L:onsdale, M.N.; FDG PET and PET/CT: EANM procedural guidelines for tumor PET imaging: version 1.0. European Journal of Nuclear Medicine and Molecular Imaging. 2010; 37: 662- 671.
- Boellaard, R. Need for standardization of 18F-FDG PET/CT for treatment response assessments. J. Nucl. Med. 2011; 52: 93S-100S.
- Wahl, R.L.; Jacene, H.; Kasamon, Y.; Lodge, M. A. From RECIST to PERCIST: evolving considerations for PET response criteria in solid tumors. J. Nucl. Med. 2009; 50: 122S-150S.
- Laffon, E.; Adhoute, X.; de Clermont, H.; Marthon, R. Is liver SUV stable over time in 18F-FDG PET imaging? Journal of Nuclear Medicine Technology. 2011; 39: 258-263.
- Boellaard, R. Standards for PET image acquisition and quantitative data analysis. J Nucl Med. 2009; 50: 11S-20S.
- Ramos, C.D.; Erdi, Y.E.; Gonen, M.; Riedel, E.; Yeung, H.W.D.; Macapinlac, H.A.; Chisin, R.; Larson, S.M. FDG-PET standardized uptake values in normal anatomical structures using iterative reconstruction attenuation correction and filtered back projection. Eur J Nucl Med. 2001; 28: 155-164.
- Delbeke, D.; Coleman, R.E.; Guiberteau, M.J.; Brown, M.L.; Royal, H.D.; Siegel, B.; Townsend, D.W.; Berland, L.L.; Parker, J.A.; Hubner, K. Procedural guidelines for tumor imaging with 18F-FDG PET/CT 1.0. J. Nucl. Med. 2006, 47, 885.
- Black, R.R.; Barentz, J.; Howell, D.; Bostwick, D.; Strum, S. Optimized 18F-FDG PET-CT method to improve accuracy of diagnosis of metastatic cancer. Diagnostics. 2023; 13: 1580-1595.
- Otsuka, H.; Graham, N.M.; Kubo, A.; Nishitani, H. The effect of oral contrast on large bowel activity in FDG-PET/CT. Ann. Nucl. Med. 2005; 19: 101-108.
- Vansteenkiste, J.F.; Stroobants, S.G.; De Leyn, P.R.; Dupont, P.; Maes, A.; Deneffe, G.J.; Nackerts, K.L.; Verschakelen, J.; Lerut, T. Lymph node staging in non small cell lung cancer with FDG PET scan: a prospective study on 690 lymph node stations from 68 patients. J Clin Oncol. 1998; 16: 2142-2149.
- Parmar, C.; Grossmann, P.; Bussink, J.; Lambin, P.; Aerts, H. Machine learning methods for quantitative biomarkers. Scientific Reports. 2015 Aug 17; 5:13087.
- Hawn Lee, S.; Choi, C.W.; Gab-Jung, K.; Park, C.S.; Han, Y.; Park, S.W.; Yoo, S.J. Radiomics in oncology: method and clinical applications. Journal of Magnetics. 2020; 25: 110-116.
- Jha, A.K.; Mithun, S.; Purandare, N.C.; Kumar, R.; Rangarajan,V.; Wee, L.; Dekker,A. Radiomics: A quantitative imaging biomarker in precision oncology. Nuclear Medicine Communications. 2022; 43: 483-493.
- Vial, A.; Stirling, D.; Field, M.; Ros, M.; Ritz, C.; Carolan, M.; Holloway, L.; Miller, A.A. The role of deep learning and radiomic feature extraction in cancer-specific Predictive modelling: a review. Translational Cancer Research. 2018; 7: 803-816.
- Sepehri, S.; Tankyeyvch, O.; Upadhaya, T.; Visvikis, D.; Hatt, M.; Cheze Le Rest, C. Comparison and fusion of machine learning algorithms for prospective validation of PET/CT radiomic feature prognostic value in stage II-III non-small cell lung cancer. Diagnostics. 2021. 11, 675.
- Borrelli, P.; Gongora, J.; Kaboteh, R.; Ulen, J.; Enqvist, O.; Tragardh, E.; Edenbrandt, L. AI-based Quantification of PET/CT lesions is associated with survival in patients with lung cancer. Research Square. 2021. Doi.org/10.21203/rs.3.rs:305562/v1.
- Graham, M.M.; Badawi, R.D.; Wahl, R.L. Variations in PET/CT methodology for oncologic imaging at U.S. academic centers: an imaging response assessment team survey. J. Nucl. Med. 2011; 52: 311-317.
- Patel, K.; Hadar, N.; Lee, J.; Siegel, B.A.; Hillner,B.E.; Lau J. The lack of evidence for PET or PET/CT surveillance of patients with treated lymphoma, colorectal cancer, and head and neck cancer: a systematic review. J. Nucl. Med. 2013; 54: 1-10.
- Boellaard, R.; Oyen, W.J.; Hoekstra, .C.J.; Hoekstra, O.S.; Visser, E.P.; Willemsen, A.T.; Arends, B.; Verziilbergen, F.J.; Zijlstra, J.; Paans, A.M. The Netherlands protocol for standardization and quantification of FDG whole body PET studies in multicenter trials. Eur J Nucl Med Mol Imaging. 2008; 35: 2320-2333.
- Adams, M.C.; Turkington, T.G.; Wilson, J.M.; Wong, T.Z. A systematic review of the factors affecting accuracy of SUV measurements. Am. J. Roentgenol. 2010; 195: 310-320.
- Geworski, L.; Knoop, B.O.; de Wit, M.; Ivancevic, V.; Bares, R.; Munz, D.L. Multicenter comparison of calibration and cross calibration of PET scanners. J. Nucl. Med. 2002; 43: 635-639.
- Bunyaviroch, T.; Turkinton, T.G.; Wong, T.Z.; Wilson, J.W.; Colsher, J.G.; Coleman RE. Quantitative effects of contrast enhanced CT attenuation correction on PET SUV measurements. Mole Imaging Biol. 2008; 10: 107-113.
- Benz, M.R.; Evilevitch, V.; Allen-Auerbach, M.S.; Eilber, F.C.; Phelps, M.E.; Czernin, J.; Weber, W.A. Treatment monitoring by 18F-FDG PET/CT in patients with sarcomas: Interobserver variability of quantitative parameters in treatment induced changes in histopathologically responding and nonresponding tumors. J. Nucl. Med. 2008; 49: 1038-1046.
- Kelly, M. EQ-PET: Achieving NEMA-referenced SUV Across Technologies. White paper. Siemens Healthcare Sector. 2015, 1-16. Available from: https://usa.healthcare.siemens.com/molecularima
ging/eq-pet - Kanstrup, I.L.; Klausen, T.L.; Bojsen-Moller, J.; Magnusson, P.; Zerahn, B. Variability and reproducibility of hepatic FDG uptake measured as SUV as well as tissue-to-blood background ratio using positron emission tomography in healthy humans. Clin Physiol Funct Imaging. 2009; 29: 108-113.
- Paquet, N.; Albert, A.; Foldart, J.; Hustinix, R. Within-patient variability of 18 (F)-FDG standardized uptake values in normal tissues. J. Nucl. Med. 2004; 45: 784-788.
- Boktor, R. R.; Walker, G.; Stacey, R.; Gledhill, S.; Pitman, A. G. Reference range for intra-patient variability in blood pool and liver SUV for 18F-FDG PET. J Nucl Med. 2013; 54: 677-682.
- Cherry, S.R.; Sorenson, J.A.; Phelps, M.E. Physics in Nuclear Medicine Philadelphia, PA Saunders/Elsevier Science; 2003: 423-490.
- Tylski, P.; Stute, S.; Grotus, N.; Doyeux, K.; Hapdey, S.; Gardin, I.; Vanderlinden, B.; Buvat, I.Comparative assessment of methods for estimating tumor volume and standardized uptake value in 18F-FDG PET. J. Nucl, Med. 2010; 51: 268-276.
- Young, H.; Baum, R.; Cremerius, U.; Herholz, K.; Hoekstra, O.; Lammerstsma, A.; Pruim, J.; Price Measurement of clinical and subclinical tumor response using [18 F] -fluorodeoxyglucose and positron emission tomography: review and 1999 recommendations. European Organization for Research and Treatment of Cancer (EORTC). European J Cancer. 1999; 35: 1773-1782.
- Skougaard, K.; Nielsen, D.; Jensen, B.V.; Hendel, H.W. Comparison of EORTC criteria and PERCIST for PET/CT response evaluation of patients with metastatic colorectal cancer treated with irinotecan and cetuximab. J. Nucl. Med. 2013; 54: 1026-1031.
- Wade, A. Derivation versus validation. Arch. Dis. Child. 2000; 83: 459-460.