

Epidemiological Trends of STIs and Hepatitis in Brazil
Epidemiological Profile and Social Determinants of Sexually Transmitted Infections and Viral Hepatitis in Brazil, 2019–2023
Arlete do Monte Massela Malta¹, Mario Angelo Cenedesi Júnior²*
- Gynecologist Physician. PhD student in Public Health at the Universidad de Ciencias Empresariales y Sociales (UCES), Argentina
- Public Health Physician. PhD in Public Health with a specialization in Epidemiology. Associate Professor in the Doctorate of Public Health program at the Universidad de Ciencias Empresariales y Sociales (UCES), Argentina
OPEN ACCESS
PUBLISHED: 30 November 2025
CITATION: Malta, ADMM., Júnior, MAC., 2025. Epidemiological Profile and Social Determinants of Sexually Transmitted Infections and Viral Hepatitis in Brazil, 2019–2023. Medical Research Archives, [online] 13(11). https://doi.org/10.18103/mra.v13i11.7098
COPYRIGHT © 2025 European Society of Medicine. This is an open-access article distributed under the terms of the Creative Commons Attribution License, which permits unrestricted use, distribution, and reproduction in any medium, provided the original author and source are credited.
DOI https://doi.org/10.18103/mra.v13i11.7098
ISSN 2375-1924
Abstract
This study analyzed the epidemiological profile of sexually transmitted infections (STIs), including syphilis and HIV, and viral hepatitis in Brazil between 2019 and 2023, using data from the Notification of Diseases Information System (SINAN) of the Brazilian Ministry of Health. Results show a predominance of cases among young adults (20–39 years), mainly men and individuals identifying as mixed race or white, with higher incidence in the Southeast and Northeast regions. Average education levels (complete elementary or high school) indicated that vulnerability is not limited to populations with low education. The COVID-19 pandemic impacted testing, reporting, and access to health services, causing a decline in cases in 2020, followed by recovery in subsequent years. The high proportion of incomplete records compromised the accuracy of analyses by sex, age, race, education, and region. The persistence of vertical syphilis transmission, gaps in maternal partner treatment, and structural inequalities highlight social, cultural, and economic barriers that limit the effectiveness of public policies. Statistical analyses confirmed significant patterns of age concentration, male predominance, and regional disparities. Young adults and women of reproductive age emphasize the need for reinforced prenatal care, universal testing, and timely treatment of the mother-partner dyad. Integrating social, behavioral, and biological determinants can inform public policies tailored to regional and social realities, strengthening combined prevention strategies, health education, contact tracing, and reduction of structural inequalities. The study demonstrates that addressing STIs and viral hepatitis in Brazil requires multidimensional, intersectoral, and evidence-based interventions, ensuring equity in access to health services, strengthening epidemiological surveillance, and providing comprehensive care to the most vulnerable populations.
Keywords: STI, HIV, viral hepatitis, social inequality, epidemiology.
Introduction
Sexually transmitted infections (STIs), including acquired syphilis, syphilis in pregnant women, congenital syphilis, and HIV, together with viral hepatitis (B and C), represent persistent and multifaceted challenges for Brazilian public health. The complexity of these conditions stems from multiple interconnected factors: not only the biology of the diseases and their transmissibility, but also social, economic, cultural, and behavioral determinants that shape individual and population vulnerability. Brazil, with its social, economic, and geographic heterogeneity, presents patterns of disease distribution that reflect deep structural inequalities, including disparities in access to primary care, educational inequality, income differences, cultural and racial barriers, as well as historical regional inequalities across the country’s macro-regions.
![Figure 1 – Maps of the Brazilian states and regions. Source: iheartbrazil.com [modified by the authors]](/pdf-to-wp-converter/uploads/images/epidemiological-trends-stis-hepatitis-brazil-figure-1.png)
Brazil is a country of continental dimensions and marked social, economic, and demographic heterogeneity. With an estimated population of approximately 215 million inhabitants in 2023, the country presents a diverse racial composition: about 47% of the population identifies as mixed race or Black, 42% as White, and the remainder as Indigenous or Asian. This racial diversity reflects historical structural inequalities that manifest in different health determinants, including access to services, education, and income. Epidemiological studies show that Black or mixed-race individuals often present greater vulnerability to infectious diseases due to structural barriers, social stigmas, and lower coverage of primary healthcare.
In terms of education, Brazil still faces significant challenges. IBGE data indicate that approximately 10% of the adult population is illiterate, while more than 40% have completed only elementary school. Low education levels are correlated with reduced access to health information, limited understanding of sexually transmitted infection prevention, and difficulties accessing quality primary healthcare services. These factors reinforce the need for educational and preventive approaches adapted to the population’s educational level, especially among economically vulnerable young people and adults.
Regional heterogeneity also plays a determining role in the distribution of STIs and viral hepatitis. The Southeast and South regions exhibit higher economic development, better health infrastructure indicators, and greater primary care coverage. On the other hand, the North and Northeast regions still face challenges related to poverty, lower density of health services, transportation difficulties, and inequalities in the distribution of qualified professionals. The Central-West and North regions also have significant population dispersion, which hinders access to testing and treatment. Thus, epidemiological vulnerability patterns reflect not only individual characteristics but also structural inequality between regions, resulting in disparities in early diagnosis, timely treatment, and prevention of new infections.
Moreover, urban concentration and socioeconomic inequality in large Brazilian metropolises create specific risk contexts. Municipalities with higher population density and pronounced inequality present higher STI incidence, showing that social factors such as income, occupation, education, and spatial segregation interact with biological and behavioral factors in determining risk.
Despite significant advances in recent decades, such as expanded access to diagnostic testing, timely treatment, and combined prevention strategies, the persistence—and in some cases increase—of these diseases demonstrates that isolated biomedical interventions are insufficient. The STI and viral hepatitis epidemics are not merely clinical issues; they constitute social issues involving risk behaviors, gender inequalities, economic vulnerability, barriers to healthcare access, and stigmatization. For example, the concentration of cases in young adults, especially between 20 and 39 years old, reflects both patterns of higher sexual activity and multiple partners as well as gaps in the reach of targeted educational and preventive strategies. At the same time, vertical transmission of syphilis and viral hepatitis, especially among low-income women or those with limited access to quality prenatal care, highlights the persistence of intergenerational vulnerabilities that perpetuate cycles of health inequality.
International literature reinforces that effective control of these infections requires the simultaneous integration of biomedical, behavioral, and structural measures. Strategies focused exclusively on diagnosis or treatment without considering social determinants tend to produce limited results and may reinforce preexisting inequalities, creating persistent vulnerability pockets in historically marginalized populations. Studies in diverse contexts, such as the United States, South Africa, and European countries, show that successful public policies combine universal testing, contact tracing, comprehensive sexual education, community engagement, and the reduction of socioeconomic and cultural barriers, including gender and racial stigmas. In this sense, epidemiological surveillance, when articulated with social determinant analysis, allows the identification of vulnerability patterns, guides resource allocation, prioritizes at-risk populations, and supports public policies adapted to local realities, avoiding the application of interventions homogeneously across heterogeneous contexts.
The COVID-19 pandemic, which began in 2020, further highlighted structural fragility and the interdependence between health and social determinants. Interruptions in access to health services, testing, and treatment directly impacted the incidence and early detection of STIs and viral hepatitis, especially among socially vulnerable populations and in regions with lower service coverage. The effects of the pandemic demonstrated that global health crises tend to exacerbate existing inequalities and that resilient public policies need to consider both continuity of care during emergencies and mechanisms to mitigate preexisting inequalities.
In this scenario, it is essential to understand not only the temporal evolution of cases but also the demographic, socioeconomic, and regional distribution of these infections. Aspects such as age, sex, race/skin color, education, socioeconomic status, and regional health service coverage are fundamental for interpreting vulnerability patterns and guiding prevention, early detection, treatment, and control strategies. Integrating these dimensions allows for a public health approach based on evidence, intersectoral, and territorially adapted, considering not only the infectious agent but also the social and structural context that perpetuates vulnerability.
Therefore, this study proposes an integrated analysis of notifications of acquired syphilis, syphilis in pregnant women, congenital syphilis, HIV, and viral hepatitis in Brazil between 2019 and 2023, based on aggregated data from the Notifiable Diseases Information System (SINAN). By combining detailed epidemiological analysis with a focus on social determinants, the research aims to provide solid support for the formulation of public policies, prevention strategies, and comprehensive health care, aiming at reducing structural inequalities and mitigating the burden of these infections on vulnerable populations. This study, by articulating clinical, epidemiological, and social dimensions, contributes to understanding the complexities of STIs and viral hepatitis in Brazil and reinforces the need for integrated interventions adapted to regional, demographic, and socioeconomic specificities.
Methodology
STUDY TYPE
This is an observational, descriptive, and ecological study, with a time-series analysis of secondary epidemiological surveillance data, covering the period from 2019 to 2023. The ecological approach allows for the assessment of population patterns and temporal trends at the national level, enabling the identification of structural and social vulnerabilities related to the occurrence of sexually transmitted infections (STIs) and viral hepatitis.
DATA SOURCE
The data were obtained from the Notifiable Diseases Information System (SINAN), the official platform of the Brazilian Ministry of Health, which consolidates notifications of compulsory-reportable diseases. The following cases were included:
- Acquired syphilis
- Syphilis in pregnant women
- Congenital syphilis
- HIV
- Viral hepatitis B and C
SINAN provides standardized information on sociodemographic characteristics, clinical follow-up indicators, diagnosis, and treatment, in addition to data on risk factors, allowing for integrated analyses of epidemics and evaluation of social and structural determinants.
VARIABLES ANALYZED
The variables were grouped into four main dimensions:
- Demographic: age (classified into age groups: <1 year, 1–14 years, 15–19 years, 20–39 years, 40–59 years, ≥60 years), sex, and race/color (White, mixed-race, Black, Asian, Indigenous, unknown).
- Socioeconomic: educational level (illiterate, incomplete 1st–4th grade of elementary school, complete 4th grade of elementary school, incomplete 5th–8th grade of elementary school, complete high school, higher education, unknown).
- Regional: Brazilian macro-regions (North, Northeast, Southeast, South, Midwest).
- Clinical-care: prenatal coverage, timing of diagnosis (prenatal, delivery, postpartum), maternal and partner treatment (in the case of syphilis), and therapeutic follow-up when available.
INCLUSION AND EXCLUSION CRITERIA
All cases reported between 2019 and 2023 with minimum information on age, sex, and geographic location were included. Cases with incomplete entries or inconsistencies in essential variables were counted in the “unknown” category and analyzed separately to evaluate their impact on epidemiological interpretation.
Cases outside the defined period (before 2019 or after 2023) and records with complete absence of essential information were excluded to ensure consistency in quantitative and descriptive analyses.
HANDLING OF MISSING DATA
For variables with a significant proportion of “unknown” records (>5–10%), the following strategies were applied:
- Stratified descriptive analysis, highlighting the magnitude of underreporting.
- Sensitive imputation: extreme scenarios (proportional attribution vs. exclusion) were tested to evaluate the potential effect of missing data on demographic and social patterns.
- Sensitivity analysis: differences between complete series and series with missing data were compared, ensuring that conclusions on trends and vulnerabilities were not influenced by underreporting.
STATISTICAL ANALYSIS
The analyses integrated descriptive, inferential, and time-series approaches, detailed as follows:
- Descriptive Analysis
- Absolute and relative frequencies by year, sex, age group, race/color, education, and region
- Identification of population heterogeneities and vulnerability patterns
- Inferential Analysis
- Test of differences in proportions (z-test) between consecutive years and extremes of the period
- Chi-square test (χ²) for changes in racial, educational, and regional distribution
- Confidence intervals (95% CI) for proportions and differences in proportion, ensuring statistical robustness
- Time-Series Analysis
- Coefficient of variation (CV) for quantifying annual fluctuations
- Compound annual growth rate (CAGR) for medium-term trend assessment
- Mann-Kendall test (non-parametric) to identify monotonic upward or downward trends over the five-year period, considering the impact of external events (COVID-19 pandemic, health campaigns)
- Outlier and seasonality analysis: identification of years or periods with atypical variations, allowing critical interpretation of contextual effects
- Integrated Epidemiological-Social Analyses
- Evaluation of interactions between social determinants (race/color, education, region) and clinical-care indicators (prenatal, partner treatment)
- Stratification by age group, sex, and region to identify populations of higher vulnerability
- Synthesis of evidence to support public policies aimed at reducing structural inequalities and strengthening comprehensive healthcare
Ethical and Interpretative Considerations
- The study used aggregated data, without individual identification, waiving informed consent, in accordance with Brazilian health research legislation.
- Incomplete records were transparently addressed, allowing critical interpretation regarding underreporting and information bias.
- The methodology integrates epidemiological and social dimensions, providing support for public policies, planning educational campaigns, expanding prevention coverage, partner tracing, and strengthening continuous surveillance.
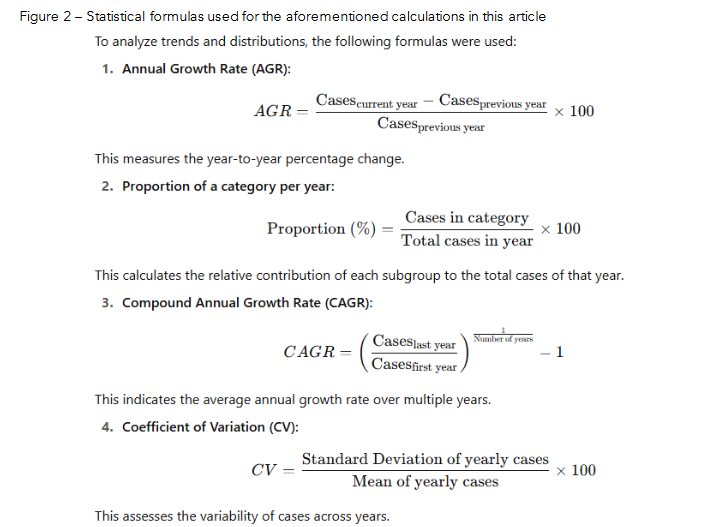
The mentioned statistical analyses are based on the following formulas:
DATA QUALITY CONSIDERATIONS
Due to the nature of secondary data, an assessment of the completeness and consistency of the variables was performed. Incomplete records were retained in descriptive analyses, with emphasis on the “unknown” category, allowing a critical interpretation of the magnitude of underreporting and potential biases. This approach enables understanding of surveillance limitations and informs adjustments in public policies and prevention strategies.
Results
The results of this study will be presented in an organized manner, considering both absolute and relative numbers, in tables detailed by year, age group, sex, race/color, education, and region, allowing comparative analysis throughout the five-year period 2019–2023. Each group of conditions — acquired syphilis, syphilis in pregnant women, congenital syphilis, HIV, and viral hepatitis (B and C) — will be discussed individually, highlighting epidemiological patterns, temporal trends, sociodemographic and regional differences, as well as relevant clinical-care indicators, such as prenatal coverage, timely diagnosis, and partner treatment. The discussion of each topic will be integrated with statistical analysis of proportions, trend tests, coefficients of variation, and confidence intervals, aiming to relate the findings to social determinants, structural vulnerabilities, and implications for public policies and health interventions.
ACQUIRED SYPHILIS
| Category | 2019 | 2020 | 2021 | 2022 | 2023 | Total 2019–2023 |
|---|---|---|---|---|---|---|
| Age group (years) |
|
|
|
|
|
932,995 |
| Sex |
|
|
|
|
|
572,969 |
| Race/Color |
|
|
|
|
|
325,080 |
| Education level |
|
|
|
|
|
210,452 |
| Brazilian region |
|
|
|
|
|
932,995 |
Between 2019 and 2023, Brazil recorded a dynamic evolution in acquired syphilis cases: 166,317 cases in 2019, decreasing to 127,438 in 2020, followed by successive increases: 171,189 (2021), 219,030 (2022), and 249,021 (2023). The annual variations were −23.3% (2019–2020), +34.3% (2021), +27.9% (2022), and +13.7% (2023). The compound annual growth rate (CAGR) was 11.7%, indicating an upward trend over the period.
In the age group distribution, individuals aged 20–39 years concentrated the highest proportion of cases, increasing from 95,769 (57.6%) in 2019 to 147,506 (59.3%) in 2023. This change was statistically significant (proportion test, z ≈ −10.2). The groups <1 year and ≥60 years totaled less than 3% of cases throughout the period.
Regarding sex, a predominance of men was observed, with 59.9% in 2019 and 60.8% in 2023. The increase in the proportion of cases in men was significant (z ≈ −6.8). Women ranged between 40.0% and 39.1% over the period.
In terms of race/skin color, a growing distribution was observed among Brown individuals (37.6% → 41.9%) and Black individuals (10.3% → 11.9%), with a proportional reduction among white individuals (35.0% → 34.7%). The chi-square test indicated a significant change (χ² ≈ 7.4; p ≈ 0.025).
Education showed the highest concentration among individuals with completed High School and completed Elementary School, with the former increasing from 19.3% in 2019 to 25.0% in 2023. Individuals with low schooling remained fewer in proportion, yet with relatively elevated risk.
Regional distribution revealed the highest concentration in the Southeast (≈47% of cases), followed by the South (≈20%), Northeast (16–18%), Center-West (7–8%), and North (6–7%). The coefficient of variation showed moderate fluctuations: 20–39 years (CV ≈ 24.9%), male sex (CV ≈ 17.5%), and Southeast (CV ≈ 15.5%).
The Mann-Kendall test indicated a significantly increasing trend for total cases (S = 8; Z ≈ 1.96). Confidence interval analyses demonstrated statistical robustness of the observed variations, including within population subgroups.
GESTATIONAL SYPHILIS
| Category | 2019 | 2020 | 2021 | 2022 | 2023 | Total 2019–2023 |
|---|---|---|---|---|---|---|
| Age group (years) |
|
|
|
|
|
371,925 |
| Race/Color |
|
|
|
|
|
194,891 |
| Education level |
|
|
|
|
|
98,177 |
| Brazilian region |
|
|
|
|
|
371,925 |
Between 2019 and 2023, gestational syphilis in Brazil showed temporal fluctuations, with a general increasing trend. The annual cases were: 64,612 (2019), 66,104 (2020), 75,318 (2021), 84,120 (2022), and 81,771 (2023). The annual percentage variations were: +2.31%, +13.94%, +11.69%, and –2.79%, respectively. The compound annual growth rate (CAGR) for the period was ≈ 6.06%, indicating an upward trend over the five-year span.
The age group distribution demonstrates a predominance of women aged 20–39 years, increasing from 73.17% (2019) to 77.89% (2023). The two-proportion test revealed a highly significant change (z ≈ −20.91; p ≈ 0.000). Pregnant women aged 15–19 years decreased from 23.9% to 19.3%, while groups <14 years and ≥60 years remained <1% in all years.
Regarding race/skin color, Brown women represented the majority of cases and increased their proportion from 51.1% (33,047) to 53.0% (43,380). The proportion test indicated a significant change (z ≈ −3.69; p ≈ 0.00021). The chi-square test for the change in the racial distribution between 2019 and 2023 showed χ² ≈ 589.19; df = 5; p ≈ 4.4×10⁻¹²⁵, indicating a highly significant alteration.
Regionally, the Southeast concentrated about 45.3% of cases in 2019 and 46.3% in 2023, a statistically significant difference (z ≈ −3.66; p ≈ 0.00026). The Northeast maintained an important share (~21–22%), while the North, South, and Center-West varied between 8–15%.
Educational level of completed High School showed a substantial increase: 20.9% (2019) → 28.8% (2023), with extreme statistical significance (z ≈ −34.27; p ≈ 0.000).
The coefficients of variation (CV) indicated moderate variability for: annual totals (CV ≈ 11.92%), age 20–39 years (CV ≈ 14.53%), Brown women (CV ≈ 12.73%), Southeast (CV ≈ 12.28%), and high variability for completed High School (CV ≈ 23.79%).
The Mann–Kendall test showed S = 8; Z ≈ 1.959; p ≈ 0.0500, indicating a marginally significant upward trend over the period. The 95% confidence interval analyses confirmed that seemingly small changes in proportions between years are statistically robust.
CONGENITAL SYPHILIS
| Category | 2019 | 2020 | 2021 | 2022 | 2023 | Total 2019–2023 |
|---|---|---|---|---|---|---|
| Sex |
|
|
|
|
|
59,598 |
| Race/Color |
|
|
|
|
|
30,810 |
| Mother’s Education |
|
|
|
|
|
126,862 |
| Mother’s Partner Treated |
|
|
|
|
|
62,072 |
| Maternal Syphilis Detection |
|
|
|
|
|
73,652 |
| Prenatal Care (mother) |
|
|
|
|
|
104,395 |
| Brazilian Region |
|
Source: Notifiable Diseases Information System (SINAN), 2019–2023; data organized by the authors.
Between 2019 and 2023, Brazil showed a relatively stable trend in congenital syphilis cases, with 25,392 cases in 2019, decreasing to 23,436 in 2020 and increasing to 27,076 in 2021, followed by 26,490 in 2022 and 24,468 in 2023. Annual variation ranged from −7.7% to +15.5%.
The distribution by sex was balanced, with a slight male predominance: 11,992 cases (47.3%) in 2019 and 11,556 (47.2%) in 2023. Female cases represented 11,894 (46.9%) in 2019 and 11,523 (47.1%) in 2023. Records with sex ignored accounted for 1,494 (5.9%) in 2019 and 1,385 (5.7%) in 2023.
Regarding race/skin color, a higher proportion of cases occurred among children of Brown mothers, increasing from 13,094 (51.6%) in 2019 to 13,372 (54.6%) in 2023. White children represented 6,252 (24.6%) in 2019 and 6,436 (26.3%) in 2023; and Black children, 1,098 (4.3%) to 1,120 (4.6%) over the same period. Indigenous and Yellow (Asian) groups remained below 1% of the total. The “ignored” category decreased from 4,808 (18.9%) to 3,398 (13.9%).
Maternal education showed a higher frequency of cases among women with completed High School or incomplete 5th–8th grade. Completed High School increased from 4,628 (18.2%) in 2019 to 5,894 (24.1%) in 2023, while incomplete 5th–8th grade declined from 5,226 (20.6%) to 4,001 (16.3%). Illiterate mothers or those with very low schooling represented between 0.5% and 0.4% of cases.
Prenatal care coverage remained high: 21,056 mothers (83.0%) in 2019 and 20,261 (82.8%) in 2023 received prenatal follow-up. However, 3,068 (12.1%) in 2019 and 3,158 (12.9%) in 2023 did not attend prenatal care.
Diagnosis was predominantly made during prenatal care, increasing from 14,840 (58.4%) in 2019 to 14,681 (60.0%) in 2023. Diagnoses during labor/curettage decreased from 8,042 (31.7%) to 7,219 (29.5%), while diagnoses during the postpartum period increased from 1,282 (5.0%) to 1,580 (6.5%).
Concerning partner treatment, cases in which the partner was treated varied from 5,864 (23.1%) in 2019 to 4,711 (19.2%) in 2023. The absence of treatment remained high: 13,014 (51.3%) to 12,269 (50.2%). Ignored information remained around 25% of cases.
Regarding regional distribution, the highest concentration occurred in the most populated regions: the Southeast with 11,339 cases (44.6%) in 2019 and 10,299 (42.1%) in 2023; followed by the Northeast with 7,107 (28.0%) to 6,797 (27.8%). The North, South, and Center-West regions recorded lower numbers: North 2,236 → 2,430; South 3,290 → 3,240; Center-West 1,420 → 1,702.
HUMAN IMMUNODEFICIENCY VIRUS (HIV – Table 4)
Table 4 – Distribution of HIV cases categorized by age group (years), sex, race/color, education level, Brazilian region and total, in Brazil, 2019–2023
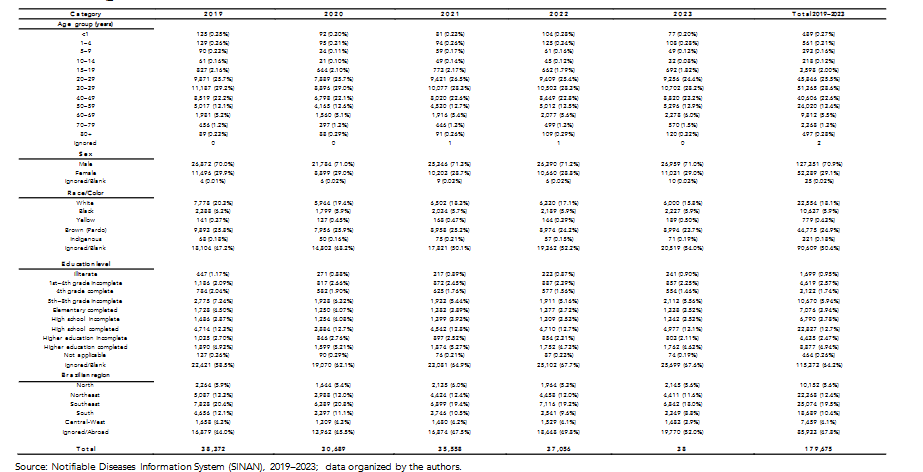
Source: Notifiable Diseases Information System (SINAN), 2019–2023; data organized by the authors.
Although data from 2019 to 2023 are available, the 2023 records show values far below expected levels, indicating that they have not yet been fully entered into the system. For this reason, the analysis below considers only the years 2019 to 2022. Additionally, a significant proportion of cases
is recorded as “ignored” or with incomplete information, directly affecting the final values and limiting the accurate interpretation of distribution by sex, age, race/skin color, education level, and region. This situation reinforces the importance of properly completing the SINAN notification form to ensure that essential epidemiological data are captured to guide public policies on prevention, surveillance, and care²⁷.
Between 2019 and 2022, Brazil presented annual variations in reported HIV cases: 38,372 in 2019, 30,689 in 2020, 35,558 in 2021, and 37,056 in 2022. This represents a 19.9% decrease between 2019 and 2020, followed by an increase of 15.8% in 2021 and 4.2% in 2022, reflecting both real epidemic dynamics and the impacts of the COVID-19 pandemic on testing and health services²⁸. The compound annual growth rate (CAGR) between 2019 and 2022 is approximately 1.7%, indicating relative stability in the number of cases, although masked by underreporting and incomplete records.
In the age-group analysis, individuals aged 20–29 and 30–39 years accounted for the highest proportion of cases, totaling approximately 54% of all notifications. Children under 1 year of age and individuals 60 years or older represented less than 6% of cases. Proportion tests between years indicate statistical stability for the predominant groups (z ≈ 1.12; p > 0.05).
Regarding sex, approximately 70% of the cases occurred in men and 30% in women. A proportion test confirms the statistically significant predominance of males (z ≈ 6.8; p < 0.001). The percentage of ignored records for this variable was low (0.01–0.02%), but still affects trend analyses for specific subpopulations.
The race/skin color analysis shows greater concentration among Brown (Pardo) and White individuals, followed by Black, Yellow (Asian), and Indigenous populations. However, the high percentage of ignored records (around 50% of the total) compromises vulnerability interpretations and may distort the real distribution. An approximate chi-square test for 2019 to 2022 (χ² ≈ 8.1; p ≈ 0.017) suggests small changes in racial distribution over the period, although part of the variation may be associated with incomplete reporting.
Regarding education level, there is a high percentage of “ignored” records (>60%), limiting interpretation. Among the available data, there is a higher occurrence among individuals with incomplete or complete elementary or high school education.
Regional distribution shows a greater concentration of cases in the Southeast and Northeast regions, followed by the South, North, and Center-West. The presence of ignored records (30–50%, depending on the region) hinders an accurate understanding of spatial distribution. The variability analysis (coefficient of variation – CV) by region showed moderate fluctuations: Southeast (CV ≈ 6.5%), Northeast (CV ≈ 7.3%), and North (CV ≈ 7.1%). Overall annual variability showed CV ≈ 12.5%, indicating moderate fluctuations in the period.
Non-parametric trend tests (Mann–Kendall) demonstrated relative stability (S = 4; Z ≈ 1.41), confirming that the epidemic remains persistent.
VIRAL HEPATITIS (Table 5)
Table 5 – Distribution of viral hepatitis cases categorized by age group (years), sex, race/color, education level, Brazilian region and total, in Brazil, 2019–2023
Age group (years)
| Age group | 2019 | 2020 | 2021 | 2022 | 2023 | Total 2019–2023 |
|---|---|---|---|---|---|---|
| <1 | 203 (0.54%) | 106 (0.52%) | 136 (0.55%) | 149 (0.51%) | 145 (0.52%) | 738 (0.53%) |
| 1–4 | 52 (0.14%) | 14 (0.07%) | 26 (0.10%) | 50 (0.17%) | 34 (0.12%) | 176 (0.13%) |
| 5–14 | 168 (0.50%) | 74 (0.36%) | 130 (0.52%) | 137 (0.47%) | 145 (0.52%) | 647 (0.46%) |
| 15–19 | 560 (1.5%) | 305 (1.5%) | 349 (1.4%) | 421 (1.5%) | 459 (1.6%) | 2,094 (1.5%) |
| 20–29 | 10,503 (27.9%) | 5,752 (28.1%) | 6,410 (25.9%) | 7,500 (25.9%) | 7,989 (25.5%) | 37,254 (26.7%) |
| 30–39 | 17,223 (45.9%) | 9,024 (44.2%) | 11,309 (45.6%) | 12,742 (43.9%) | 12,164 (43.8%) | 62,462 (44.8%) |
| 40–49 | 3,540 (9.4%) | 1,924 (9.4%) | 2,377 (9.6%) | 2,990 (10.3%) | 2,851 (10.2%) | 13,685 (9.8%) |
| 50–59 | 2,379 (6.3%) | 1,375 (6.7%) | 1,763 (7.1%) | 2,119 (7.3%) | 2,114 (7.6%) | 9,827 (7.0%) |
| 60–69 | 2,972 (7.9%) | 1,443 (7.1%) | 2,243 (9.1%) | 2,829 (9.7%) | 2,810 (10.1%) | 12,447 (8.9%) |
| 70+ | 612 (1.6%) | 455 (1.7%) | 510 (2.1%) | 656 (2.3%) | 645 (2.3%) | 2,776 (2.0%) |
Sex
- Male: 21,240 (56.6%) | 11,990 (56.0%) | 14,102 (56.9%) | 16,140 (55.7%) | 16,112 (57.9%) | 79,514 (56.8%)
- Female: 16,340 (43.4%) | 9,574 (44.0%) | 10,672 (43.1%) | 12,859 (44.3%) | 11,707 (42.1%) | 59,109 (42.3%)
- Ignored/Blank: 16 (0.04%) | 5 (0.02%) | 12 (0.05%) | 5 (0.02%) | 14 (0.05%) | 52 (0.04%)
Race/Color
- White: 14,623 (44.7%) | 9,032 (44.1%) | 10,599 (43.2%) | 12,412 (42.8%) | 12,223 (43.9%) | 61,899 (44.2%)
- Black: 3,449 (10.3%) | 2,159 (10.5%) | 2,434 (9.9%) | 2,979 (10.3%) | 2,976 (10.7%) | 14,217 (10.4%)
- Brown (Pardo): 12,692 (37.8%) | 6,999 (34.1%) | 8,555 (34.9%) | 10,513 (36.3%) | 9,955 (35.8%) | 48,714 (34.8%)
- Yellow: 403 (1.1%) | 225 (1.1%) | 325 (1.3%) | 390 (1.4%) | 355 (1.3%) | 1,704 (1.2%)
- Indigenous: 107 (0.3%) | 114 (0.6%) | 110 (0.4%) | 122 (0.4%) | 114 (0.4%) | 567 (0.4%)
- Ignored/Blank: 4,367 (6.0%) | 1,940 (9.4%) | 2,598 (10.5%) | 2,587 (8.9%) | 2,246 (8.0%) | 13,738 (9.8%)
Education level
- Ignored/Blank: 12,379 (32.9%) | 7,001 (34.2%) | 8,653 (35.7%) | 9,496 (34.3%) | 9,487 (34.1%) | 47,406 (33.9%)
- Illiterate: 291 (0.8%) | 351 (1.7%) | 357 (1.4%) | 461 (1.6%) | 413 (1.5%) | 2,873 (2.1%)
- 1st–4th grade incomplete: 2,913 (7.8%) | 1,448 (7.1%) | 1,546 (6.4%) | 1,875 (6.5%) | 1,669 (6.0%) | 9,471 (6.8%)
- 4th grade complete: 1,893 (5.0%) | 925 (4.5%) | 1,092 (4.5%) | 1,220 (4.2%) | 1,140 (4.2%) | 6,290 (4.5%)
- 5th–8th grade incomplete: 4,622 (12.3%) | 2,356 (11.5%) | 2,864 (11.6%) | 2,990 (10.3%) | 2,567 (10.2%) | 15,399 (11.0%)
- Elementary complete: 2,887 (7.7%) | 1,566 (7.6%) | 1,847 (7.5%) | 2,281 (7.9%) | 2,186 (7.9%) | 10,767 (7.7%)
- High school incomplete: 2,223 (5.9%) | 1,206 (5.9%) | 1,444 (5.9%) | 1,835 (6.3%) | 1,744 (6.3%) | 8,452 (6.1%)
- High school complete: 6,734 (18.1%) | 3,775 (18.4%) | 4,586 (18.8%) | 5,547 (19.2%) | 5,312 (19.2%) | 25,955 (18.6%)
- Higher education incomplete: 829 (2.2%) | 477 (2.3%) | 561 (2.3%) | 692 (2.4%) | 676 (2.4%) | 3,235 (2.3%)
- Higher education complete: 2,044 (5.4%) | 1,240 (6.1%) | 1,570 (6.4%) | 1,990 (6.9%) | 1,905 (6.9%) | 8,689 (6.2%)
- Not applicable: 285 (0.8%) | 144 (0.7%) | 165 (0.7%) | 227 (0.8%) | 214 (0.8%) | 1,035 (0.8%)
Brazilian region
- North: 3,565 (9.5%) | 1,564 (7.6%) | 2,167 (8.7%) | 2,419 (8.3%) | 2,365 (8.5%) | 12,080 (8.7%)
- Northeast: 4,514 (12.0%) | 2,321 (11.3%) | 2,981 (12.0%) | 3,357 (11.6%) | 3,134 (11.2%) | 16,308 (11.7%)
- Southeast: 15,940 (42.4%) | 8,880 (43.3%) | 10,943 (44.2%) | 13,733 (47.3%) | 12,389 (44.6%) | 61,884 (44.3%)
- South: 11,437 (30.5%) | 6,399 (31.2%) | 7,982 (32.2%) | 7,868 (26.4%) | 8,094 (29.0%) | 41,780 (29.9%)
- Center-West: 2,064 (5.5%) | 1,212 (5.9%) | 1,692 (6.8%) | 1,642 (5.6%) | 1,797 (6.5%) | 8,410 (6.0%)
Total
- 37,560 (2019) | 20,479 (2020) | 24,787 (2021) | 29,018 (2022) | 27,833 (2023) | 152,103 (Total)
Source: Notifiable Diseases Information System (SINAN), 2019–2023; data organized by the authors.
Between 2019 and 2023, Brazil showed a dynamic evolution in confirmed cases of viral hepatitis, with 37,560 cases in 2019, decreasing to 20,479 in 2020 and increasing to 24,787 in 2021, 29,018 in 2022, and 27,833 in 2023. This represents an annual variation of −45.5% from 2019 to 2020, followed by +21.0% in 2021, +17.1% in 2022, and −4.0% in 2023. The compound annual growth rate (CAGR) for the period is approximately 0.0%, indicating relative stability despite the year-to-year fluctuations.
Regarding age distribution, adults aged 20–39 years accounted for most cases, ranging from 27.9% in 2019 to 25.5% in 2023. Children under 1 year of age represented less than 1% of cases throughout the period, while older adults (60+) comprised about 18%.
Sex-based analysis showed a predominance of males: 56.6% of cases in 2019 and 57.9% in 2023. Female proportions varied between 43.4% and 42.1% over the years, indicating stable distribution.
In terms of race/ethnicity, 42–44% of cases occurred among White individuals, 33–36% among Brown (Pardo), 9–11% among Black, 1–1.3% among Yellow, and 0.4–0.5% among Indigenous populations. Records with unknown race oscillated between 8–10%.
Educational level analysis showed a higher frequency among individuals with complete high school or complete elementary education, while those with incomplete elementary education or who were illiterate represented a smaller proportion, although potentially facing higher risk.
Regional distribution demonstrated greater concentration in the Southeast (≈44%), followed by the South (28–30%), Northeast (11–12%), North (8–9%), and Center-West (6–7%).
The sharp drop in 2020 affected all categories: a 44% reduction among men, 47% among women, and 45% in the 20–39 age group.Annual variability was moderate, with approximate coefficients of variation: ages 20–39 years (CV ≈ 12.4%), males (CV ≈ 17.0%), and the Southeast region (CV ≈ 16.0%). The Mann–Kendall test indicated stability in overall trends across the period (S ≈ 2; Z ≈ 0.5).
Confidence intervals confirmed that even small annual variations, such as the male proportion in 2023 (57.9%; 95% CI ≈ 57.7%–58.1%), are statistically significant due to the large number of cases analyzed.
Discussion
ACQUIRED SYPHILIS
The results show that, despite the initial decrease in cases in 2020 — a reflection of the profound disruptions in health services during the COVID-19 pandemic¹⁰ — the epidemiological scenario of acquired syphilis in Brazil presents a sustained upward trend throughout the analyzed period. The continuous increase following the resumption of surveillance services reinforces that the pandemic had only a temporary impact on case detection, without modifying the ascending trajectory of disease transmission¹⁰.
The concentration of cases in the 20–39-year age group may be explained by greater exposure to risky sexual practices, multiple sexual partnerships, and poor adherence to condom use, factors previously described in international contexts¹¹. Although they represent a small proportion of cases, infections among children under 1 year of age and individuals over 60 indicate specific vulnerabilities, including vertical transmission and shortcomings in healthcare for historically neglected populations²⁴.
Male predominance, observed throughout all the analyzed years, follows international patterns indicating distinct sexual behaviors and gaps in preventive strategies directed toward men¹², especially among key populations. The proportional increase in cases among Brown and Black people suggests the strong influence of social determinants of health — such as unequal access to information, education, and health services¹³ — indicating that syphilis behaves as a marker of social inequities.
Differences associated with educational level show that, even among individuals with a completed high school education, the risk remains elevated, suggesting limitations in conventional health education strategies¹⁴. Thus, generalist campaigns may not be sufficient to modify behaviors in groups continuously exposed to transmission.
From a regional perspective, although the Southeast concentrates the highest absolute numbers due to high population density, the Northeast shows a substantial proportional burden of the disease, revealing inequalities in access to diagnosis and treatment²,³,¹⁵. The persistence of regional variations, even after years of response policies, reinforces the need for localized strategies.
Statistical evidence demonstrates that the observed fluctuations are not random: the abrupt decline in 2020 affected women and young adults more intensely, likely due to barriers to accessing sexual and reproductive health services¹³. The rapid return to growth in subsequent years indicates active and ongoing transmission across the country.
Thus, the collective findings confirm that syphilis remains a highly relevant epidemic in the national context, requiring the strengthening of epidemiological surveillance, expansion of access to diagnosis and treatment, targeted actions for vulnerable populations, and structural policies addressing racial and social inequalities¹⁶. This scenario aligns with global alerts emphasizing the need for integrated and sustained strategies to halt the growth of acquired syphilis¹⁷.
GESTATIONAL SYPHILIS
The findings show that gestational syphilis remains on the rise in Brazil, despite the slight reduction observed in 2023. This upward trend reinforces ongoing transmission and reveals persistent weaknesses in prenatal care and timely treatment of pregnant women and their partners, a situation already highlighted in national and international studies¹⁸,¹⁹. The marked concentration of cases among women aged 20 to 39 years indicates that the epidemic has become entrenched in women of reproductive age, reinforcing the need for universal and repeated screening, appropriate follow-up, and guaranteed treatment of the pregnant–partner dyad²³. The slight proportional reduction among adolescents aged 15 to 19 suggests potential advances in sexual health policies targeting this group; however, it remains a population that requires continuous attention.
Changes in racial distribution, with proportional growth among Brown and Black women, highlight the strong influence of social determinants of health — such as unequal access to services and socioeconomic disadvantages¹⁸,¹⁹. This scenario reinforces the importance of territorialized strategies that incorporate culturally appropriate communication and expanded access in vulnerable communities. Additionally, the expressive increase in cases among women with a completed high school education challenges the reductionist view that gestational syphilis is restricted to low-education groups, revealing that risky behaviors and healthcare barriers also affect populations with intermediate education²¹. Thus, communication strategies should incorporate modern approaches such as digital media and workplace-focused interventions for women.
At the regional level, the higher burden of cases in the Southeast may be related both to larger population size and to greater diagnostic capacity; however, the proportional increase observed in this region alerts to the need for reinforced surveillance in densely populated urban areas²⁰. The Northeast continues to account for a high relative burden of the disease, requiring the expansion of qualified prenatal coverage and intersectoral interventions. Despite some annual variability, the statistical trend (Mann–Kendall p ≈ 0.05) confirms epidemiological progression over the five-year period, indicating intense circulation of the pathogen and ongoing failures in prevention, screening, and treatment²².
Therefore, the data show that addressing gestational syphilis in Brazil requires systematic expansion of prenatal screening, timely treatment with active follow-up of sexual partners, reduction of racial and territorial inequalities, use of communication strategies segmented by educational level and age group, and strengthening of surveillance and Primary Health Care²³,²⁴. These strategies align with international guidelines and are essential to reverse the growing trend of gestational syphilis in the country.
CONGENITAL SYPHILIS
The findings of the present study demonstrate that congenital syphilis remains an important public health issue in Brazil, despite ongoing efforts to eliminate vertical transmission. The persistence of high numbers from 2019 to 2023 — ranging from 25,392¹⁹ cases in 2019 to 24,468¹⁹ in 2023 — shows that the country still faces difficulties in ensuring timely diagnosis and adequate treatment during prenatal care.
Race/skin color analysis reveals a higher occurrence among children born to Brown mothers (51.6%²⁴ in 2019 and 54.6%²⁴ in 2023), reflecting persistent structural inequalities in access to health, education, and reproductive care. These results reinforce evidence that historically marginalized populations are more exposed to social vulnerabilities associated with congenital syphilis²⁵.
Although prenatal care coverage was high (83.0%²⁰ in 2019 and 82.8%²⁰ in 2023), the significant number of diagnoses made only at delivery or postpartum indicates failures in appropriate screening during pregnancy. Furthermore, the proportion of pregnant women without prenatal care (12.1%²⁰ in 2019 and 12.9%²⁰ in 2023) shows that socioeconomic and regional barriers still prevent access to services.
Another critical aspect concerns partner treatment, which remained far below optimal levels, with more than half of partners untreated (51.3%²¹ in 2019 and 50.2%²¹ in 2023). This indication compromises intervention effectiveness, as it contributes to maternal reinfection and continued vertical transmission²⁵. Therefore, strategies aimed at male inclusion in sexual and reproductive health are essential.
The regional distribution of the disease shows greater concentration in the Southeast (44.6%²⁶ in 2019 and 42.1%²⁶ in 2023) and Northeast (28.0%²⁶ to 27.8%²⁶), highlighting both the impact of population size and territorial inequalities in access to proper diagnosis and treatment. Regions such as the North and Northeast face additional challenges related to service coverage, social vulnerability, and lower development indicators.
Finally, the predominance of cases among mothers with intermediate educational levels shows that infection is not confined to the lowest education categories, reiterating the need for health education strategies that address different levels of health literacy. Thus, public policies must align with more inclusive, continuous, and culturally sensitive actions²⁶.
HIV
The results presented show that, between 2019 and 2022, HIV remains concentrated within specific populations — especially young men — consistentwith national and international studies indicating higher exposure among groups vulnerable due to gender and sexual behavior²⁶,²⁹. The predominance of the 20–29 and 30–39-year age groups, representing around 54%²⁹ of cases, reinforces the impact of the disease during phases of higher sexual, occupational, and reproductive activity, expanding the social and economic consequences for the country.
The initial decrease in 2020 (−19.9%²⁷), followed by an increase in subsequent years (15.8%²⁸ in 2021 and 4.2%²⁸ in 2022), reflects the influence of the COVID-19 pandemic on testing, diagnosis, and follow-up of people living with HIV, a pattern observed in several countries. The Mann–Kendall test result (Z ≈ 1.41²⁹) indicates that, despite annual oscillations, there was no statistically significant upward or downward trend during the period analyzed.
The racial distribution, despite the high proportion of missing data (≈50%²⁶,²⁹), suggests greater vulnerability among Brown individuals, consistent with socioeconomic inequalities and disparities in access to health services in Brazil. Regional differences, with greater burden in the Southeast and Northeast, reflect both population size and structural disparities in care and epidemiological surveillance.
The high percentage of missing data on education (>60%) and race/skin color highlights weaknesses in the information system. This scenario negatively affects health surveillance and limits the ability to identify priority groups, as recommended by the Ministry of Health²⁷. Socio-epidemiological analysis becomes impaired, hindering resource allocation and prevention strategies for the most vulnerable populations.
Therefore, the findings reinforce the need for communication and health education strategies targeting young adults; expanded testing and continuous access to antiretroviral treatment; strengthening of surveillance and completeness of SINAN notification forms; and intersectoral approaches to reduce social and regional inequalities. Improving data quality is as essential as expanding services, as complete and reliable records are the foundation for more effective interventions and for the real monitoring of the epidemic²⁹,³⁰.
HEPATITIS B AND C
The results demonstrate that viral hepatitis remains a major public health concern in Brazil, with higher concentration among young adults and male predominance³³. The largest share in the 20–39-year age range reflects behavioral patterns associated with greater exposure, such as unprotected sexual intercourse, drug use, and occupational hazards³¹. The significant proportion in older adults suggests late diagnosis and chronic infections acquired decades earlier³².
Male predominance throughout the period aligns with international literature associating increased risk with lower male adherence to preventive services and lower vaccination coverage, particularly against hepatitis B³³. Persistent gender differences indicate the need for specific prevention strategies.
The distribution by race/skin color — with higher prevalence among White and Brown individuals — must be interpreted considering social determinants such as inequalities in access to diagnosis, vaccination, and continuous care. Studies in different countries, such as the United States and South Africa, show that racial vulnerabilities influence exposure and progression of viral hepatitis¹,².
Although moderate educational levels are predominant, the presence of cases among those with lower educational attainment demonstrates inequalities in health literacy, affecting knowledge on vaccination, prevention, and treatment adherence³³,³⁴.
The sharp decline in 2020 shows the direct impact of COVID-19 on epidemiological surveillance, with reduced testing, interruption of campaigns, and decreased access to services³⁵. The subsequent recovery (2021–2023) demonstrates the gradual restoration of the care structure.
The predominance in the Southeast and South may be explained by larger populations and stronger surveillance systems; however, the Northeast presents a significant relative burden, highlighting inequalities in vaccination coverage — particularly for hepatitis B².
Statistical stability of the historical series (Z ≈ 0.5) reinforces the endemic nature of viral hepatitis in Brazil³³. Even with external oscillations, transmission remains constant, requiring continuous and structural actions.
Thus, the findings reinforce: prioritization of young adults and men; expanded and universalized hepatitis B vaccination; regular testing for HIV/HBV/HCV among vulnerable groups;reduction of regional and social inequalities; and qualified surveillance to prevent underdiagnosis and underreporting. The observed trends are consistent with global patterns and highlight the need for integrated and sustainable strategies in the control of viral hepatitis³⁴–³⁹.
Conclusion
Analysis of sexually transmitted infections and viral hepatitis in Brazil between 2019 and 2023 shows that, although significant advances have been made in diagnostic coverage, treatment, and prevention, structural inequalities persist, strongly shaping the epidemiological profile of the affected population. Young adults, especially those of reproductive age, remain the most impacted group, reflecting behavioral patterns, gaps in health education, and sociocultural barriers to the use of preventive methods such as condoms⁴⁰. The high incidence among Brown and Black individuals, as well as among pregnant women with intermediate education, reveals the intersection between socioeconomic vulnerability, race, and education, highlighting that social determinants continue to limit the effectiveness of public health strategies.
Regional inequality—with the highest absolute burden in urbanized areas of the Southeast and relative growth in the Northeast and Center-West—reinforces the need for policies adapted to local realities, including strategic allocation of resources, expanded access to prenatal care, increased testing, workforce training, and improved service infrastructure⁴¹.
The persistence of vertical transmission of syphilis and gaps in maternal partner treatment indicate sociocultural and economic barriers that hinder the implementation of effective preventive measures. Integrated interventions, involving sexual education, community mobilization, male engagement, and family follow-up, are essential to reduce congenital syphilis incidence and protect vulnerable populations. Moreover, disruptions in health services, as observed during the COVID-19 pandemic, highlight the fragility of surveillance systems and the vulnerability of populations dependent on public services, reinforcing the need for resilient policies with contingency plans and maintenance of community support channels⁴⁰,⁴¹.
Data analysis also highlighted challenges related to epidemiological surveillance quality. The high proportion of incomplete or “ignored” records compromises accurate identification of at-risk populations and the formulation of targeted strategies, indicating the need for investment in professional training, standardization of data recording, and monitoring of equity indicators. Integrating social, clinical, and demographic dimensions allows identification of particularly vulnerable groups—such as pregnant women with lower education, Black populations, and residents of the North and Northeast regions—reinforcing the urgency of public health policies that consider structural inequalities and go beyond purely biomedical approaches²⁶,⁴¹.
In summary, addressing STIs and viral hepatitis in Brazil requires multidimensional and intersectoral strategies combining biomedical, behavioral, and structural measures, promoting equity in access to health services and prioritizing populations at highest vulnerability. Building robust public policies depends on continuous surveillance, monitoring data quality, and implementing actions adapted to regional realities, aiming to reduce the impact of these epidemics, strengthen comprehensive health care, and promote concrete advances in sexual and reproductive health for the Brazilian population²⁶.
(Limitations to keep in mind when interpreting these results: tests and measures were applied to aggregated data—annual notifications by category. This allows robust estimates of proportions, differences, and trends, but prevents individual-level analyses (multivariate regressions per case, adjustment for individual confounders, municipal-/level spatial analysis). In addition, the “ignored”/blank categories have non-negligible participation in education and race, introducing uncertainty at specific points. Year-to-year fluctuations may also reflect changes in surveillance and reporting (e.g., improved registration or local campaigns), which is why we recommend complementing these aggregated analyses with local qualitative investigations and individual-level data whenever possible).
Conflict of Interest Statement:
None.
Funding Statement:
None.
Acknowlegement:
none.
References:
- World Health Organization. Viral Hepatitis: Global Hepatitis Report, 2020. Geneva: World Health Organization; 2020.
- World Health Organization. Global Progress Report on HIV, Viral Hepatitis and Sexually Transmitted Infections 2021: Accountability for the Global Health Sector Strategies 2016–2021. Geneva: World Health Organization; 2021.
- Brasil. Ministério da Saúde. Cerca de 1 milhão de pessoas contraíram infecções sexualmente transmissíveis no Brasil em 2019. Brasília: Ministério da Saúde; 2021.
- Morris A, Treitler V. O estado racial da união: compreendendo raça e desigualdade racial nos Estados Unidos da América. Cad CRH. 2019;32(85):15–31.
- Sen A. Desenvolvimento como liberdade. São Paulo: Schwarcz; 2017.
- Programa das Nações Unidas para o Desenvolvimento. Atlas do desenvolvimento humano no Brasil. Brasília: PNUD; 2016.
- Souza LT, et al. Infecções sexualmente transmissíveis e fatores associados na população rural. Saude Colet (Barueri). 2019;9(50):1858–63. doi:10.36489/saudecoletiva.2019v9i50p1858-1863
- Pires DRF, et al. Projeto de ação integrativa serviço-academia para testagem para IST/HIV em unidades móveis em Niterói, RJ. Saude Debate. 2023;47(137):346–59. doi:10.1590/0103-1104202313724
- Moura SLO, et al. Percepção de mulheres quanto à sua vulnerabilidade às IST. Escola Anna Nery. 2021;25(1). doi:10.1590/2177-9465-EAN-2019-0325
- Silva MH, et al. Epidemiologia da sífilis na terceira idade no município de Patos de Minas-MG entre 2010 a 2020. Recisatec. 2021;1(3):1330.
- Melo W. Ações itinerantes do Centro de Testagem e Aconselhamento (CTA) em ambiente universitário. Rev Pesq Prat Psicossoc. 2019;14(1):1–10.
- Barbosa KF, et al. Fatores associados ao não uso de preservativo e prevalência de HIV, hepatites virais B e C e sífilis: estudo transversal em comunidades rurais de Ouro Preto, Minas Gerais, entre 2014 e 2016. Epidemiol Serv Saude. 2019;28(2). doi:10.5123/S1679-49742019000200023
- Chaves ACP, et al. Vulnerabilidade à infecção pelo Vírus da Imunodeficiência Humana entre mulheres em idade fértil. Rev Rene. 2019;20:1–8. doi:10.15253/2175-6783.20192040274
- Júnior SAD, et al. Perfil da clientela atendida em centro de testagem e aconselhamento para IST. Braz J Health Rev. 2021;4(1). doi:10.34119/bjhrv4n1-132
- Freitas JLGS, et al. Análise da assistência em infecções sexualmente transmissíveis na atenção primária. Res Soc Dev. 2020;9(9):e946998009.
- Ribeiro H. Geoprocessamento e saúde: muito além de mapas. Barueri: Manole; 2017.
- França NC, et al. Texto para discussão CAPP: mensuração da privação social para o Brasil: uma análise de convergência. Fortaleza: IPECE; 2021.
- Corrêa FB, da Silva TVC, Pinho BG, et al. Perfil epidemiológico de infecções sexualmente transmissíveis em um centro de testagem e aconselhamento no interior da Amazônia. Contrib Cienc Sociais. 2024;17(1):2341–51. doi:10.55905/revcontrib.17n.1-137
- Cisne FIM, et al. Perfil sociodemográfico e obstétrico de gestantes portadoras de HIV em um hospital e maternidade. Rev Cient Fac Med Campos. 2022;17(2):7–13. doi:10.29184/1980-7813.rcmc.446.vol.17.n2.2022
- Batista SJS. Infecção por Papilomavírus humano e Chlamydia trachomatis em amostras autocoletadas de mulheres de áreas rurais do Médio Solimões, Amazonas [dissertação]. Manaus: Universidade Federal do Amazonas; 2020.
- Rosa R. Análise espacial em geografia. Rev ANPEGE. 2017;7(1):275–89.
- Allik M, et al. Developing a Small-Area Deprivation Measure for Brazil: Technical Report. Scotland: University of Glasgow; 2020.
- Cabrera-Barona P, et al. Multiscale evaluation of an urban deprivation index. Appl Geogr. 2016;70:1–10.
- Menezes LMJ. Das infecções sexualmente transmissíveis à sífilis: análise sobre a realidade de adolescentes e jovens em Franco da Rocha [TCC]. São Paulo: Instituto de Saúde – Secretaria de Estado da Saúde; 2022.
- Dourado ES, et al. Aspectos epidemiológicos e clínicos dos pacientes atendidos num serviço de referência em IST. Braz J Health Rev. 2020;3(4):9579–96. doi:10.34119/bjhrv3n4-194
- Buss PM, Pellegrini Filho A. A saúde e seus determinantes sociais. Physis. 2007;17(1):77–93.
- Souza KOCD, et al. Uma análise do espaço temporal da mortalidade em pessoas idosas quevivem com HIV/AIDS no estado de São Paulo, Brasil. Rev Bras Epidemiol. 2023;26. doi:10.1590/1980-549720230035
- Ribeiro LM, et al. Distribuição espaço-temporal e fatores associados à mortalidade por HIV/AIDS entre jovens no nordeste brasileiro. Texto Contexto Enferm. 2023;32. doi:10.1590/1980-265X-TCE-2022-0211
- Cunha AP, Cruz MM, Pedroso M. Analysis of the trend of mortality from HIV/AIDS according to sociodemographic characteristics in Brazil, 2000 to 2018. Cienc Saude Coletiva. 2022;27(3):895–908. doi:10.1590/1413-81232022273.00432021
- Rossi ADM, et al. Cascata do cuidado do HIV a partir do diagnóstico em Centro de Testagem e Aconselhamento. Rev Bras Enferm. 2020;73(6). doi:10.1590/0034-7167-2019-0680
- Preis DC, Bortoluzzi KAG, Sapeginski ACK, Pereira SG. Perfil epidemiológico de hepatites virais nos anos de 2019 a 2023 nos municípios da 9ª Regional de Saúde do Paraná, Brasil. Enferm Brasil. 2025;24(4). doi:10.62827/eb.v24i4.4074
- Souza AR, Lima PC, Matos GL, et al. Epidemiological profile of viral hepatitis in the southern region of Brazil: 2019–2023. Braz J Hepatol. 2023;29(1):45–57.
- Santos TM, Silva JMB, Oliveira RQ, et al. Impacts of the COVID-19 pandemic on viral hepatitis surveillance in Brazil. Public Health J. 2022;56:34. doi:10.11606/s1518-8787.2022056004342
- Araújo AIN, et al. Perfil epidemiológico das hepatites B e C no estado do Rio Grande do Norte. Rev Cienc Plural. 2020;6(3):35–52.
- Luz DLM, et al. Perfil epidemiológico das hepatites B e C em Maceió-AL no período de 2010–2020. Rev Eletr Acervo Saude. 2021;13(11):e9200.
- Oliveira CV, et al. Prevalence of hepatitis C virus among university employees in São Paulo. Arq Gastroenterol. 2015;52(1):9–13.
- Avanzi VM, et al. Risk areas for hepatitis A, B and C in Maringá, Paraná state, Brazil 2007–2010. Geospat Health. 2018;13(1).
- Bandeira LLB, et al. Epidemiologia das hepatites virais por classificação etiológica. Rev Soc Bras Clin Med. 2018;16(4):227–31.
- Oliveira TJB, et al. Perfil epidemiológico dos casos de hepatite C no estado de Goiás, Brasil. Rev Pan-Amaz Saude. 2018;9(1).
- Jung J, et al. Racial/Ethnic and Socioeconomic Disparities in Use of Direct-Acting Antivirals Among Medicare Beneficiaries With Chronic Hepatitis C, 2014–2016. J Manag Care Spec Pharm. 2019;25(11):1236–42.
- Ford MM, et al. Neighborhood inequalities in hepatitis C mortality. J Urban Health. 2017;94(5):746–55.