


AI-Enhanced Non-Invasive Blood Pressure Waveform Analysis
Use of AI and a non-invasively obtained estimate of the total blood pressure waveform for cardiovascular disorder screening
David A. Hullender1 and Olen R. Brown2
- Professor of Mechanical and Aerospace Engineering at the University of Texas at Arlington
- Professor Emeritus of Biomedical Sciences, Dalton Cardiovascular Research Center, University of Missouri- Columbia
OPEN ACCESS
PUBLISHED 31 August 2025
CITATION Hullender, DA. and Brown, OR., 2025. Use of AI and a non-invasively obtained estimate of the total blood pressure waveform for cardiovascular disorder screening. Medical Research Archives, [online] 13(8). https://doi.org/10.18103/mra.v13i8.6849
COPYRIGHT © 2025 European Society of Medicine. This is an open-access article distributed under the terms of the Creative Commons Attribution License, which permits unrestricted use, distribution, and reproduction in any medium, provided the original author and source are credited.
DOI https://doi.org/10.18103/mra.v13i8.6849
ISSN 2375-1924
ABSTRACT
Accurate assessment of cardiovascular pathologies is essential for routine and specific patient diagnoses. Because heart disease is prevalent worldwide, an inexpensive, reliable, and non-invasive screening method that evaluates blood pressure, arterial stiffness, atrial fibrillation and other very specific pathologies in the cardiovascular system would improve diagnoses and potentially save many lives. We propose that technology is available for the diagnostic interpretation of patient data acquired from simple oscillometric blood pressure cuffs. Specifically, a model-based identification algorithm has been used successfully to estimate the coefficients in a Fourier series equation for the waveform while simultaneously estimating the coefficients in an empirical model for arterial stiffness. Thus, the continuous waveform with all its peaks and valleys including the dicrotic notch, can be displayed on an oscilloscope and/or plotted on a graph for visual examination. More importantly, the mathematical format for the waveform and arterial stiffness can be accessed by machine learning algorithms to diagnose and identify appropriate treatments. Research has revealed correlations of the waveform features and arterial properties with cardiovascular disorders. We propose the creation of a brachial artery database with cuff pressure time histories for specific cuff designs and patient medical histories. Machine learning algorithms can use this database to enhance the accuracy of diagnoses and treatments as well as be available for testing and validating more robust identification algorithms proposed in the future.
Keywords: arterial stiffness, artificial intelligence (AI), atrial fibrillation, machine learning (ML), blood pressure waveform, system identification, extended Kalman filter, oscillometric pulsations, arteriosclerosis, dicrotic notch
1. Introduction
Imagine it is the year 2030 and a man is sitting in a chair at home using a standard blood pressure cuff to automatically compress and decompress the brachial artery in his arm. Assume the instrumentation with the cuff contains a computer chip for storing the time history of the pressure in the cuff as it inflates and deflates. Imagine the cuff pressure data uploaded to the cloud along with functional details and design parameters of the cuff and along with the man’s medical history; all of this information is stored in a database. Imagine the application of system identification algorithms to information in the database to determine the shape of the blood pressure waveform at that location in the brachial artery and identify the degree of arteriosclerosis at that specific location. Imagine the potential benefits of being able to display the total blood pressure waveform on a computer screen and/or print a graph for visual examination. Then imagine machine learning (ML), an application of artificial intelligence (AI), being applied to all information from many participants in the database to diagnose beginning stages of cardiovascular disorders and suggest treatments. Imagine this process, starting with the use of the cuff in his home, being repeated at a weekly or monthly frequency to monitor changes in his cardiovascular conditions over time.
Current technology has not been utilized to accomplish these tasks. However, the focus of this paper is on available technology that would enable this database to be created, enable the identification of the total blood pressure waveform and the degree of arteriosclerosis, and enable the application of ML to diagnose specific patient pathological conditions and suggest potential treatments if needed. According to the World Health Organization, cardiovascular diseases are the leading cause of death worldwide. Technology for non-invasive data collection for screening and monitoring patients to diagnose beginning stages of cardiovascular disorders is a primary area of research. In this paper, we briefly review a previously documented non-invasive technique for estimating the total shape and features of the arterial blood pressure waveform and the degree of arteriosclerosis (arterial stiffness) using only the air pressure data in an oscillometric cuff as it inflates and deflates during blood pressure measurement.
Automated non-blood pressure measuring devices were developed in the 1970s to replace manual auscultatory blood pressure measurement by the mercury sphygmomanometer. Automated blood pressure instruments by various manufacturers have passed accuracy testing against reference auscultatory sphygmomanometers using scientifically accepted validation protocols. For example, Ntineri et al. concluded that an automated auscultatory upper arm-cuff blood pressure monitor (InBody BPBIO480KV) comfortably fulfilled the AAMI/ESH/ISO United Standard requirements in general populations and can be recommended for clinical use. More specifically, it achieved a mean +/- SD difference vs. paired reference readings of 0.3 +/- 5.5 mm Hg for SBP and 0.6 +/- 4.7 mmHg for DBP.
These devices are recommended for clinical use globally for estimating systolic and diastolic pressure levels and pulse rate; a microprocessor with empirically formulated proprietary algorithms is used to analyze the time history of the air pressure in the cuff. The previously documented non-invasive technique referenced in this paper uses the same cuff air pressure time history; however, in this case, a system identification algorithm is used to extract information from the pressure time history to mathematically define the total shape of the arterial blood pressure waveform, such as shown in Figure 1, and the stiffness properties of the brachial artery. Thus, the waveform can be viewed on an oscilloscope and/or plotted on a graph revealing the systolic and diastolic levels, pulse rate, and specific details such as the shape of the dicrotic notch and other potentially critical features.
The primary objective in the referenced studies is to demonstrate that critical information associated with the total shape of the brachial artery blood pressure waveform and arterial stiffness, in addition to the standard estimates of systolic and diastolic pressure levels and pulse rate, can be extracted from the time history of the air pressure in a cuff. The cuff pressure time history is recorded and represents the input to an extended Kalman filter algorithm. The model-based algorithm utilizes empirical equations with unknown coefficients for the stiffness of the brachial artery, utilizes a fluid capacitance model with unknown coefficients for the time derivative of the transmural pressure, and utilizes a Fourier series equation with unknown coefficients for modeling the harmonics of the periodic blood pressure waveform. The objective of the Kalman filter algorithm is to extract details from the time history of the cuff pressure to identify the unknown coefficients in the equations. These equations will be used with AI to identify pathological conditions.
In this paper, we review the previously published results demonstrating success of this particular algorithm to identify the unknown coefficients. Considering the mathematical complexities associated with the model-based extended Kalman filter algorithm, the extensive details are not repeated here. Most important is the realization that identification details can be extracted from simply the cuff pressure time history using any model-based robust and accurate identification algorithm currently in existence or yet to be formulated in the future.
Realizing that the shape of the blood pressure waveform is different at different locations in a patient’s vascular tree, we propose a procedure for establishing a database, applicable to data obtained with a cuff at the brachial artery, that can also be used with other identification algorithms formulated in the future that may prove to be more robust and accurate. We address correlations of brachial artery blood pressure waveform features with cardiovascular disorders. We propose that the overall goal is to have a database that can be used with machine learning to diagnose cardiovascular disorders during screenings and suggest potential treatments.
![Complex features of the pressure waveform [taken from (Yartsev, 2023)]](/pdf-to-wp-converter/uploads/images/ai-enhanced-non-invasive-blood-pressure-waveform-analysis-figure-1.png)
2. Blood Pressure Waveform-Shape Characteristics
As shown in Figure 1, the total blood pressure waveform can be separated into three distinct phases. The systolic phase is characterized by a rapid systolic upstroke to the systolic peak pressure. This first phase begins with the opening of the aortic valve and it corresponds to the ejection of blood by the left ventricle. The second phase is a rapid systolic decline containing the dicrotic notch believed to correspond to the closure of the aortic valve. The diastolic runoff phase continues to the end-diastolic pressure; this phase corresponds to the movement of the blood into the peripheral circulation.
Specific waveform slopes, durations, and levels associated with the systolic upstroke, the systolic decline, the dicrotic notch, the dicrotic runoff, the peak systolic pressure, and the end-dicrotic pressure are known to be correlated with pathological conditions. The total shape of the waveform will also reveal the pulse rate, mean arterial pressure, and conditions of atrial fibrillation and flutter. Being able to identify these features and conditions with only the non-invasively obtained cuff pressure time history will likely lower screening costs since data collection can be obtained without the needs of highly skilled technicians and expensive instrumentation.
Historically, the total shape of the blood pressure waveform and its specific features have been obtained intravenously with a catheter and/or tube connected to a pressure transducer. This process requires a skilled technician and the use of complex instrumentation elevating the cost of the process. In addition, the pressure/flow dynamics in a catheter and/or tube is known to distort the pressure-transducer-observed features of the waveform especially with blood, a non-Newtonian fluid.
The Yartsev review addresses information relevant to the information extractable from an intravenously obtained blood pressure waveform. It states: The arterial pressure wave (which is what you see there) is a pressure wave; it travels much faster than the actual blood which is ejected. It represents the impulse of left ventricle contraction, conducted through the aortic valve and vessels along a fluid column (of blood), then up a catheter, then up another fluid column (of hard tubing) and finally into your Wheatstone bridge transducer… one really gets to understand the human arterial pulse when one is trying to simulate it mechanically for the purpose of teaching arterial line insertion.
The systolic peak derives its shape from the influence of reflected waves returned from the vascular tree (see Figure 2).
![Peak systolic and Augmented pressure [taken from Yartsev, 2023]](/pdf-to-wp-converter/uploads/images/ai-enhanced-non-invasive-blood-pressure-waveform-analysis-figure-2.png)
Yartsev analyzed the timing of the arterial pulse and associated it with the electrocardiogram (ECG) (see Figure 3). The systolic upstroke does not occur immediately following contraction of the heart. On the ECG, the electrophysiological phenomenon which signals the beginning of systole is the R wave, which does not appear on the monitors until a 160-180 millisecond delay.
![Timing correlation of the arterial pulse and the Electrocardiogram [taken from Yartsev, 2023]](/pdf-to-wp-converter/uploads/images/ai-enhanced-non-invasive-blood-pressure-waveform-analysis-figure-3.png)
Understanding that the features of the total waveform and the degree of arteriosclerosis are known to be correlated with a patient’s pathological conditions, means of automatically identifying and diagnosing these conditions would be most beneficial.
3. Correlation of Waveform Features to Cardiovascular Disorders
3.1 FEATURES OF THE WAVEFORM
Significant information can be derived from the arterial pressure waveform. From measurements, the following can be determined: heart rate, systolic pressure, diastolic pressure (coronary filling), mean arterial pressure (systemic perfusion), pulse pressure, changes in amplitude associated with respiration (pulse pressure variation), and the slope of the anacrotic limb associated with aortic stenosis. More specifically, Esper et al. in the paper titled Arterial waveform analysis stated: The bedside measurement of continuous arterial pressure values from waveform analysis has been routinely available via indwelling arterial catheterization for more than 50 years… minimally invasive techniques to estimate cardiac output (CO) have gained increasing appeal. This has led to the increased interest in arterial waveform analysis to provide this important information, as it is measured continuously in many operating rooms and intensive care units. Arterial waveform analysis also allows for the calculation of many so-called derived parameters intrinsically created by this pulse pressure profile.
Stouffer in chapter 4 in Arterial pressure provided many detailed diagrams of wave forms. He stated: Arterial blood pressure is one of the most fundamental measurements in hemodynamics. Because of the need to quantify pressure levels, emphasis is placed on mean, systolic, or diastolic values. These values, while tremendously useful, do not provide complete information to characterize the composite pressure wave, either within the aorta or as it undergoes significant changes during propagation within the arterial system. His detailed interpretations of the clinical significances of wave forms is highly detailed and very useful.
A recent publication by Alastruey et al. (in 2023) addressed aspects of arterial pulse wave modeling and analysis. They stated: Arterial pulse waves (PWs) such as blood pressure and photoplethysmogram (PPG) signals contain a wealth of information on the cardiovascular (CV) system that can be exploited to assess vascular age and identify individuals at elevated CV risk. From the waveform shape, the following can be assessed: the slope of the anacrotic limb represents the aortic valve and the LVOT (passageway through which blood flows from the left ventricle into the aortic valve and then into the aorta); slurred wave in AS (arteriosclerosis); collapsing wave in AS; rapid systolic decline in LVOTO (obstruction or narrowing of the LVOT as caused by hypertrophic cardiomyopathy) which impedes blood flow from the left ventricle to the aorta; bisferiens wave in HOCM (obstructive hypertrophic cardiomyopathy); a low dicrotic notch which indicates poor peripheral resistance; and position and quality of the dicrotic notch which is a reflection of the damping coefficient.
Yartsev states: The peak correlates with the systolic blood pressure as measured by a normal non-invasive cuff. The trough (i.e., the lowest reading before the next pressure wave) is the diastolic pressure. The mean arterial pressure (MAP) is calculated from the area under the pressure curve, which is a more accurate way of doing it than the old diastolic plus one-third times the pulse pressure method. That old method can get you into trouble. Consider the arterial pressure waveforms below. Though with identical systolic and diastolic pressures, the area under the curve for one waveform is substantially smaller, leading to a lower MAP than would be calculated using the old method (as shown in Figure 4).
![Analysis of the blood pressure waveform [taken from Yartsev, 2023]](/pdf-to-wp-converter/uploads/images/ai-enhanced-non-invasive-blood-pressure-waveform-analysis-figure-4.png)
Yartsev states: The peak systolic pressure will be low in patients with highly compliant vessels, because there is little wave reflection and because the central arteries will distend gladly in response to LV systolic flow… As you move further down the vascular tree, the reflected wave becomes more and more prominent, and moves further into systole.
3.2 ARTERIAL IMPEDANCE
Murgo et al. in Aortic Input Impedance in Normal Man: Relationship to Pressure Wave Forms, stated: The character of the arterial pulse as palpated by the physician at the bedside or displayed by laboratory pulse recording techniques has long been an important part of the clinical evaluation of the patient with heart disease. Arterial pressure is the result of an interaction between the heart and the arterial system, so that the magnitude and shape of the pressure pulse will be affected by changes in the peripheral circulation or alterations in cardiac function. Recurrent improvements in intravascular pressure measurement techniques have revealed major differences in the configuration of aortic pressure waves among patients, even in the absence of cardiovascular disease. One way to determine whether these observations are secondary to differences in cardiac function or differences in the periphery is to use methods that selectively describe the arterial system… The best known of these relationships is the input impedance… impedance is calculated from the ratio of the pressure differences across the system under study and the total flow through the system. The description of the arterial system found by only taking the ratio between mean pressure difference and mean flow rate and deriving their respective sinusoidal components by Fourier analysis.
3.3 PULSE PRESSURE & WAVE REFLECTIONS
The Windkessel effect and augmentation are useful hemodynamic effects that can be helpful in understanding the shape of the arterial pressure waveform and the behavior of blood flow in the arteries. The term Windkessel derives from German, meaning air chamber. It originally described how old fire pumps smoothed pulsing water flow. In the cardiovascular system, the Windkessel effect explains how large elastic arteries (especially the aorta) buffer the pulsatile output of the heart. During systole, the right heart chamber ejects blood into the aorta which expands due to its elasticity and the blood pressure. During diastole, the aorta recoils, which helps to maintain continuous blood flow even when the heart is not actively pumping. This dampens the pulse pressure, lowers systolic peaks, and works to maintain diastolic pressure which ensures a steady flow of blood to the tissues. Augmentation is the term used for the increased pressure in late systole that is caused by reflected waves from peripheral arteries (when the pulse wave travels from the heart through arteries it reflects back from branch points and resistance sites in arterioles). When this reflected wave returns during systole, it adds to the pressure; specifically, it augments the late systolic peak. This is detected and measured as the augmentation index (Aix). A higher Aix is associated with increased arterial stiffness and higher cardiovascular risk. This means that in young, elastic arteries, reflected waves return during diastole which helps to boost coronary perfusion. With aging and increased stiffness, the reflected waves return earlier, during systole, and increase cardiac workload and systolic blood pressure.
3.4 DICROTIC NOTCH
In the blood pressure waveform, there is a deviation called a notch, that is the transition from systole to diastole and it reflects aortic valve closure. Before measurements with human patients, the dicrotic notch (incisura) was first identified through direct intra-arterial pressure measurements by inserting catheters into animals. The notch was not discovered using external blood pressure cuffs or algorithmic analyses. The dicrotic notch was recognized as a feature of the aortic pressure waveform which typically appears after the systolic peak and was associated with aortic valve closure which causes a brief flow reversal. Gamrah et al. published the paper Mechanics of the dicrotic notch: An acceleration hypothesis. They stated: The dicrotic notch is a prominent and distinctive feature of the pressure waveform in the central arteries. It is universally used to demarcate the end of systole and the beginning of diastole in these arteries. Despite its importance clinically, no physical mechanism for the formation of the dicrotic notch has been demonstrated convincingly… A new hypothesis is presented involving the acceleration of the aortic valve apparatus at the time of valve closure. This hypothesis is supported by new calculations of the acceleration of the aortic valve apparatus during the cardiac cycle based on computed tomography scans in man. We have not found in the literature a definitive conclusion regarding their hypothesis and conclude that it remains unconfirmed, and widely accepted, and that more rigorous experimental validation is required.
The shape of the waveform and location of the notch are known to be associated with valve and structural disorders. For example, Pulsus parvus et tardus is a diminished, delayed upstroke that is a classic indication of aortic stenosis due to obstructed outflow. It is a weak, late pulse, relative to heart contraction and it is commonly felt during a physical examination of an individual with aortic valve stenosis. Pulsus bisferiens is a double-peaked waveform. It has a single central pulse wave with two peaks separated by a distinct mid-systolic dip. It is associated with conditions including aortic regurgitation, severe aortic stenosis, or hypertrophic cardiomyopathy. Machine learning applied to waveform features including the notch and other elements, can be expected to be especially useful in identifying heritable traits in future studies.
3.5 ADVANCED WAVEFORM AND HARMONICS ANALYSIS
An important detail in the equations formulated by the extended Kalman filter algorithm is a Fourier series defining the harmonic components of the waveform. Harmonic decomposition of the waveform can reveal changes in vascular compliance and in ventricular-vascular coupling. These can provide insight beyond the information found by measuring the height of simple peaks and notches. Milkovich et al. in 2023 reported results of a study that introduced the concept of a harmonic distortion (HD) index. HD correlated robustly with arterial stiffness. Milkovich and his associates state that a major determinant of blood pressure waveform (BPW) morphology is vascular impedance, governed by material properties of the arterial wall and hemodynamics of blood flow. Analysis of BPW morphology can be an effective means of assessing cardiovascular health. Our study provides a mechanistic understanding of the determinants of AI and HD, with the latter being a promising measure of cardiovascular risk due to its ease of calculation and access, meeting key limitations set by AI and PWV. Thus, it has potential to be better than the augmentation index (AI) and pulse-wave velocity (PWV) and it provides a mechanistic understanding based on harmonic waveform analysis.
Therefore, shapes and waveform patterns within blood pressure waves, including PWV, notch characteristics, and specific waveforms, carry valuable diagnostic and prognostic information for a variety of heart diseases. To be interpreted, clinical data must be correlated in studies with actual patients who receive a comprehensive diagnosis by other, traditional means. Such a correlation is summarized in Table 1.
| Condition/Feature | Pathophysiology & Associated Conditions |
|---|---|
| ↑ Pulse Wave Velocity (PWV) | Atherosclerosis, hypertension, heart failure |
| Widened Pulse Pressure / AIx↑ | Arterial stiffness, age-related changes |
| Dicrotic notch alterations | Valve disease, microvascular dysfunction |
| Pulsus parvus et tardus | Aortic stenosis |
| Pulsus bisferiens | Aortic regurgitation, hypertrophic cardiomyopathy |
4. Model-Based Extended Kalman Filter Algorithm
4.1 MATHEMATICAL MODELS FOR THE BLOOD PRESSURE WAVEFORM AND ARTERIAL STIFFNESS
The extended Kalman filter has been used extensively for more than 60 years to extract information from input data sources and identify mathematical models for physical systems. Years of experience in the aerospace industry by the first author of this paper has verified the successful use of the filter for system identification. This section of the paper provides a brief review of previous publications detailing how the filter extracts information from the pressure measurements in a cuff to identify the harmonic properties of the waveform and identify the stiffness properties of the brachial artery. The algorithm is model-based which means that empirically formulated equations with unknown coefficients are used and the objective of the identification algorithm is to generate estimates of these coefficients. For the test cases in the previous publications, there are 15-unknown coefficients in the 4-equations modeling the system.
Equations (1), (2) and (3) represent a fluid capacitance model for estimating the time derivative of the pressure pulsations, y(t), in the cuff associated with artery volume changes, i.e.
ẏ(t) = 1.4Pc(t) / Vc(t) * Pt(t)Vaof(Pt)
f(Pt) = ae^(-bPt(t)) for Pt(t) ≥ 0
f(Pt) = ae^(aPt(t)) for Pt(t) < 0
The gage air pressure in the cuff, Pc(t), is recorded as the cuff inflates and deflates. The Kalman filter algorithm provides estimates of the true y(t) and estimates of the unknown parameters a and b associated with the stiffness of the artery and an estimate of Vaof associated with the size of the artery. Equation (4) is a Fourier series defining the harmonics of the arterial blood pressure waveform.
P(t) = A0 + A1 sin(ωt) + A2 sin(2ωt) + A3 sin(3ωt) + A4 sin(4ωt) + A5 sin(5ωt) + B1 cos(ωt) + B2 cos(2ωt) + B3 cos(3ωt) + B4 cos(4ωt) + B5 cos(5ωt)
There are 12-unknown coefficients in Equation (4), (A0 … A5 and B1 … B5 and ω) that must be estimated by the extended Kalman filter algorithm. Considering the 12-coefficients for the Fourier series, the 3-coefficients for the artery, and y(t), the total number of estimates to be generated by the Kalman algorithm totals to 16.
4.2 TESTING THE ALGORITHM USING SIMULATION
The input to the algorithm is the time history of the air pressure in the cuff which is reflective of the blood pressure pulse in the artery. Success of the algorithm is achieved when the estimates for the coefficients converge to constant values representing the best set of values for the patient’s arterial blood pressure waveform and degree of arterial stiffness. The algorithm requires initial values for the 15-unknown coefficients; in this study, for first time analysis of a particular patient, initial values consistent with normal arterial stiffness and a normal blood pressure waveform are used. To enhance the accuracy and speed of convergence with the algorithm for repeat analyses for the same patient, results from the last application should be used for initial values to expedite convergence.
As documented in previous studies, to test the algorithm, the algorithm was simulated using a set of coefficients assumed for a simulated patient: 180 beats/minute with systolic/diastolic pressures of 160/100 and relatively stiff arteries. Algorithm success was achieved when the coefficients converged from the initial values to those assigned to the equations for the simulated patient. Typical simulation results are shown in Figures 5-8.
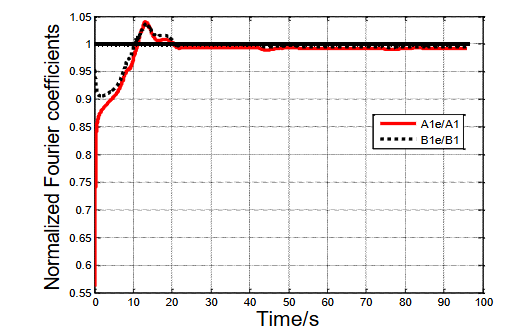
Figure 5 shows a 20 s convergence for coefficients A1 and B1; these convergence results are typical for all 15-unknown coefficients. The plots in Figure 5 have been normalized by the correct coefficients for the patient. Thus, convergence is successful if the plots converge to approximately 1; this is shown to have happened in Figure 5.
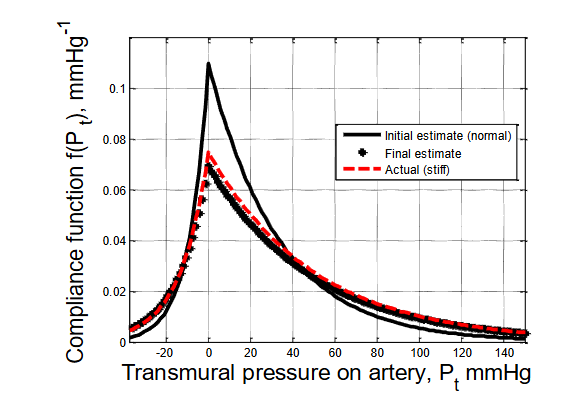
Figure 6 shows the convergence of the arterial stiffness model. It has been assumed that the simulated patient has stiff arteries. Thus, coefficient values of a, b, and Vaof for a stiff artery have been used to generate the red dashed line on the graph. The initial estimates of a, b, and Vaof for normal arteries were used to generate the black solid line on the graph. Note that the estimate of the equation and plot for arterial stiffness have converged (approximately) from the initial solid black line to the red dashed line corresponding to the coefficients assigned to the simulated patient.
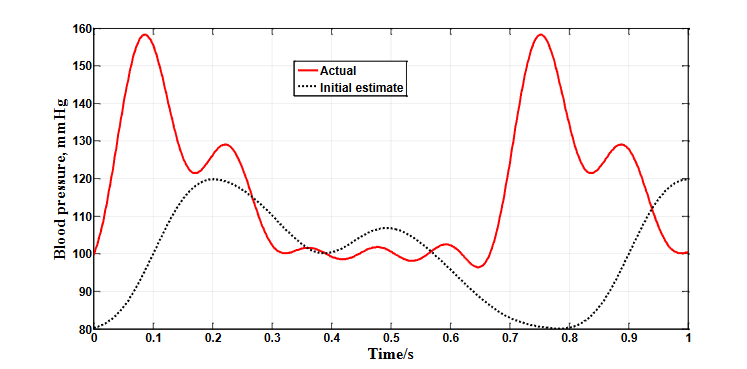
Figure 7 compares the initial assumed normal waveform (black dots) with the actual waveform of the simulated patient (solid red line) which has an elevated pressure and higher pulse rate. Note the significant differences in the shapes and pulse rates at the start of the identification process.
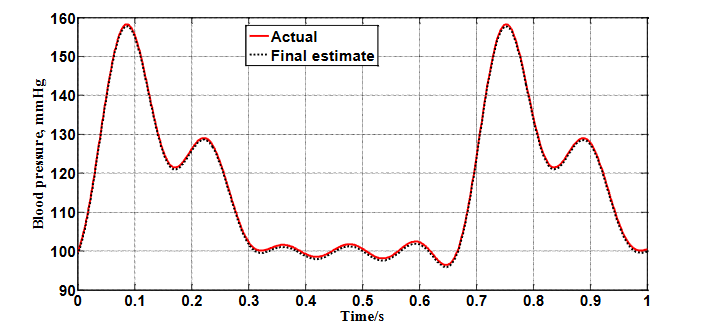
As shown in Figure 8, following convergence of the coefficient estimates, the corresponding model for the waveform is shown to have converged from the initially assumed waveform in Figure 7 to the actual waveform of the simulated patient.
The simulation results in these papers prove that the features of the blood pressure waveform and levels of arterial stiffness can be extracted from oscillometric cuff pulsations which is very encouraging. We have demonstrated that this can be accomplished with an extended Kalman filter algorithm; however, technological advances with system identification algorithms are likely to lead to more robust and accurate techniques for extraction in future studies if a database, independent of the identification algorithm to be used, is available for validation.
4.3. PROPOSED USE OF MACHINE LEARNING WITH AN OSCILLOMETRIC DATABASE
Current instrumentation, in existing automated cuff system designs, records the time history of the cuff air pressure and applies proprietary algorithms to this time history for estimating systolic and diastolic levels and pulse rate. It is proposed that this time history be uploaded to the cloud, along with the physical design parameters of the cuff, to create a database for future studies with the extended Kalman filter algorithm or with other algorithms that prove to be more robust and accurate for extracting the necessary information for model identification. By also uploading and supplementing the database with as much information as possible about the medical history of the patient, machine learning algorithms can be applied to the database to diagnose pathological conditions and suggest treatments when warranted.
5. Conclusions
Low-cost non-invasive methods for diagnosing cardiovascular disorders and prescribing treatments are being researched globally. Machine learning and artificial intelligence algorithms are exploding into relevance on many fronts associated with this research and are poised to revolutionize non-invasive cardiovascular diagnostics. As discussed in this paper, machine learning algorithms can be applied to blood pressure waveform equations extracted from oscillatory signals obtained non-invasively via blood pressure cuffs during inflation and deflation. This is relatively inexpensive and can be widely applied. Such signals encode more information than just systolic and diastolic pressures and heart rate. Waveform morphology, timing and amplitude variations correlate with vascular stiffness, stroke volume and other cardiac functions. These signals are noisy but they contain valuable information about blood pressure pulse amplitudes, inter-beat intervals and pathological states including arterial compliance, peripheral resistance, arrhythmias, and left ventricular dysfunctions.
As we have shown, the extended Kalman filter is an estimator that is particularly suited to remove noise and accurately define equations for the shape of the arterial blood pressure waveform and equations for levels of arteriosclerosis. These equations are a prime source of reference data that can be used with machine learning algorithms to diagnose the existence and change in pathological conditions and offer suggestions for treatment of identified disorders.
The success of this technique to extract critical information from the cuff pressure data is most encouraging. We are proposing that this success justifies the creation of a database of cuff pressure data. As long as the cuff is applied to the brachial artery and the specific design details of the cuff used to generate the data are included with the data, different system identification algorithms, other than the extended Kalman filter, can also be utilized to extract the shape of the waveform and the degree of arteriosclerosis using the database. Thus, as more robust and accurate identification algorithms are formulated to estimate the unknown coefficients in the equations, the database can be used to test these algorithms. Also, since the shape of the waveform and the arterial stiffness are defined by mathematical models, application of machine learning algorithms can easily be used to diagnose cardiovascular disorders and prescribe treatments even though the information was obtained specifically from the brachial artery.
Supplementation of databases with machine learned correlations will enhance even more the possibilities of being able to diagnose cardiovascular disorders and prescribe treatments with low-cost non-invasive techniques. Without question, advances in lowering the cost and simplifying screening techniques that result in more accurate diagnoses and more effective treatments will enhance the possibility of lowering the number of disabling cardiovascular casualties and potentially saving many lives.
6. References:
- Di Cesare M, McGhie DV, Perel P, et al. The Heart of the World. Glob Heart. 2024;19(1). doi:10.5334/GH.1288.
- Samartkit P, Pullteap S. Non-invasive continuous blood pressure sensors in biomedical engineering research: A review. Sens Actuators A Phys. 2024;367:115084. doi:10.1016/J.SNA.2024.115084.
- Premakumara N, Cheng HT, Chen KW, Fu HN, Chen XY, Yang CY. Early Prevention of Cardiovascular Disease: A Review of Technology, Risk Scoring, and Non-Invasive Methods. 2024 9th International Conference on Information Technology Research (ICITR). Published online 2024. doi:10.1109/ICITR64794.2024.10857765.
- Hullender DA, Brown OR. Simulations of blood pressure and identification of atrial fibrillation and arterial stiffness using an extended Kalman filter with oscillometric pulsation measurements. Comput Methods Programs Biomed. 2021;198. doi:10.1016/j.cmpb.2020.105768.
- Hullender D, Brown O, Shrotriya A. Non-Invasive Blood Pressure Total Waveform Monitoring Using Information Extracted by an Extended Kalman Filter Algorithm from Pulsations in an Oscillatory Cuff. Med Res Arch. 2023;11(3). doi:10.18103/MRA.V11I3.3677.
- Sharman JE, Tan I, Stergiou GS, et al. Automated oscillometric blood pressure measuring devices: how they work and what they measure. J Hum Hypertens. 2022;37(2):93. doi:10.1038/S41371-022-00693-X.
- Ntineri A, Theodosiadi A, Menti A, et al. A novel professional automated auscultatory blood pressure monitor with visual display of Korotkoff sounds: InBody BPBIO480KV validation according to the Association for the Advancement of Medical Instrumentation/European Society of Hypertension/International Organization for Standardization Universal Standard. J Hypertens. 2023;41(2):356-361. doi:10.1097/HJH.0000000000003341.
- Tangirala AK. Principles of System Identification. 1st ed. CRC Press; 2018. doi:10.1201/9781315222509.
- Chen B, Dang L, Zheng N, Principe J. Kalman Filtering Under Information Theoretic Criteria. Springer; 2023. doi:10.1007/978-3-031-33764-2.
- Lewis FL, Optimal estimation: with an introduction to stochastic control theory, ISBN 0-471-83741-5, Wiley-Interscience,1986.
- Yartsev A. Normal arterial line waveforms | Deranged Physiology. August 12, 2023. Accessed June 30, 2025. https://derangedphysiology.com/main/cicm-primary-exam/cardiovascular-system/Chapter-760/normal-arterial-line-waveforms.
- CICM Primary Exam Syllabus review | Deranged Physiology. Accessed July 8, 2025. https://derangedphysiology.com/main/cicm-primary-exam-4.
- Hullender DA. Alternative Approach for Modeling Transients in Smooth Pipe with Low Turbulent Flow. Journal of Fluids Engineering, Transactions of the ASME. 2016;138(12). doi:10.1115/1.4034097/374392.
- Hullender DA. Analytical Non-Newtonian Oldroyd-B Transient Model for Pretransient Turbulent Flow in Smooth Circular Lines. Journal of Fluids Engineering, Transactions of the ASME. 2019;141(2). doi:10.1115/1.4040933/457360.
- Esper SA, Pinsky MR. Arterial waveform analysis. Best Pract Res Clin Anaesthesiol. 2014;28(4):363-380. doi:10.1016/j.bpa.2014.08.002.
- Stouffer GA, Arterial pressure | Thoracic Key. https://thoracickey.com/4-arterial-pressure/?utm_source=chatgpt.com.
- Alastruey J, Charlton PH, Bikia V, et al. Arterial pulse wave modeling and analysis for vascular-age studies: a review from VascAgeNet. Am J Physiol Heart Circ Physiol. 2023;325(1):H1. doi:10.1152/AJPHEART.00705.2022.
- Murgo JP, Westerhof N, Giolma JP, Altobelli SA. Aortic input impedance in normal man: Relationship to pressure wave forms. Circulation. 1980;62(1):105-116. doi:10.1161/01.CIR.62.1.105.
- Brien AB, Shrive NG, Parker KH, Tyberg JV. Time-domain representation of ventricular-arterial coupling as a windkessel and wave system. Am J Physiol Heart Circ Physiol. 2003;284(4 53-4). doi:10.1152/AJPHEART.00175.2002.
- Gamrah MA, Xu J, El Sawy A, Aguib H, Yacoub M, Parker KH. Mechanics of the dicrotic notch: An acceleration hypothesis. Proc Inst Mech Eng H. 2020;234(11):1253-1259. doi:10.1177/0954411920921628.
- Pulsus parvus et tardus: What Is It, Causes, and More | Osmosis. Accessed July 11, 2025. https://www.osmosis.org/answers/pulsus-parvus-et-tardus?utm_source=chatgpt.com.
- Goudar RB, ElBebawy B. Pulsus Bisferiens. Br Med J. 2023;1(1985):75-77. doi:10.1136/bmj.1.1985.75.
- Milkovich N, Mitchell GF, Suki B, Zhang Y. Blood pressure waveform morphology assessed using a transmission line model and harmonic distortion analysis. Sci Rep. 2025;15(1):1-13. doi:10.1038/S41598-025-93129-8;SUBJMETA=166,639,985,988;KWRD=BIOMEDICAL+ENGINEERING,MECHANICAL+ENGINEERING.
- Li B, Hullender D, DiRenzo M. Nonlinear induced disturbance rejection in inertial stabilization systems. IEEE Transactions on Control Systems Technology. 1998;6(3):421-427. doi:10.1109/87.668042.
- Li B, Hullender D. Self-tuning controller for nonlinear inertial stabilization systems. IEEE Transactions on Control Systems Technology. 1998;6(3):428-434. doi:10.1109/87.668043.