

Impact of Pre-K Programs on Academic Outcomes
Large-Scale, Well-Implemented Public Pre-Kindergarten Linked to Better Academic Performance and School Health
Craig T. Ramey, PhD,¹ Billy Ray Stokes, PhD,² Gary J. Asmus, PhD,³ Maria Stack Hankey PhD,¹⁴ and Sharon Landesman Ramey, PhD¹
- Fralin Biomedical Research Institute at VTC, Virginia Tech, Roanoke, VA, USA
- Riverside Circle Roanoke, Virginia, 24016
- Civitan International Research Center, University of Alabama at Birmingham, Birmingham, Alabama, USA
- Cecil J. Picard Center for Child Development and Lifelong Learning, University of Louisiana, Lafayette, Louisiana, USA
- Now at Louisiana Blue, 5525 Reitz Avenue, Baton Rouge, LA 70809, USA
- New Affiliation: Carilion Clinic, Health Analytics Research Team, 213 S. Jefferson Street, Suite 1502, Roanoke, Virginia 24011, USA
OPEN ACCESS
PUBLISHED: 31 May 2025
CITATION: Ramey, C.T., et al., 2025. Large-Scale, Well-Implemented Public Pre-Kindergarten Linked to Better Academic Performance and School Health. Medical Research Archives, [online] 13(5).
https://doi.org/10.18103/mra.v13i5.6534
COPYRIGHT © 2025 European Society of Medicine. This is an open-access article distributed under the terms of the Creative Commons Attribution License, which permits unrestricted use, distribution, and reproduction in any medium, provided the original author and source are credited.
DOI https://doi.org/10.18103/mra.v13i5.6534
ISSN 2375-1924
ABSTRACT
Large-scale PreK programs for children from low-income families are frequently justified on findings from two single-site randomized controlled trials (RCTs) – the Perry Preschool Project and the Abecedarian Project. These programs both documented cognitive benefits during PreK participation and later reductions in grade retention and special education placement as well as multiple benefits that extended into adulthood. This paper provides a description of a statewide program in the United States that adopted many key components of the Abecedarian Project and engaged its scientific leadership in a partnership of research and program implementation.
We describe the program, its scale-up, and the creation of a novel same-school longitudinal comparison group from four successive cohorts of children from low-income families totaling 15,554 public pre-K families (PPK) and 48,985 classroom peers from low-income matched families who had No Public Pre-K (NPPK). Hierarchical linear modeling revealed that PPK compared to NPPK was associated with significantly higher 3rd grade academic achievement scores in four domains (language, math, science, and social studies) as well as markedly lower rates of grade retention and special education placement, indicators of improved school health.
These results were essentially replicated in each of the four successive cohorts. Further sensitivity analyses confirmed significant positive and enduring benefits for boys and girls as well as children whose parents designated their child Black, White, or Hispanic. Features of the successful implementation are identified as guideposts for other large-scale programs seeking to achieve measurable and enduring PPK benefits.
Introduction
Since the 1970s, justification for establishing many public pre-k programs relied on citing the long-term results and estimates of economic returns-on-investment from relatively small-scale randomized controlled trials (RCTs) that offered multi-year early education programs to children from economically impoverished and almost entirely Black families (cf., Duncan & Magnuson, 2013; Heckman et al., 2007; Lowenstein, 2011).¹⁻³ The most frequently cited longitudinal studies are the Perry Preschool Project⁴⁻⁶ (e.g., Lazar & Darlington, 1982; Heckman, Moon, Pinto, Savelyev, & Yavitz, 2010; Schweinhart, et al., 2005) conducted in Ypsilanti, MI and the Abecedarian Project conducted in Chapel Hill, NC (e.g., Ramey, et al., 2000; Ramey, Sparling, & Ramey, 2012).⁷,⁸
Cumulative benefits associated with receiving the Abecedarian Project early education program, summarized in Ramey & Ramey (2023),⁹ include higher student academic achievement from kindergarten through high school, reduced rates of grade retention and special education placement, higher adult employment and incomes, lower costs to society (e.g., reduced rates of crime and lower use of forms of public assistance), and better adult decision-making, cardiovascular health, and differences in brain structure. Increasingly, these and other findings have been used to support large-scale efforts to achieve similar results. Some of these larger scale-up efforts have included statewide pre-K programs in the United States. The study designs, methods, and populations served in scale-up studies have varied so greatly that firm conclusions cannot be reached about which students benefit the most or which program features are critical to ensure benefits (cf. Dodge, 2017).¹⁰ An interdisciplinary national Pre-Kindergarten Task Force was convened to review evidence about state-funded pre-k programs. The Task Force produced a Consensus Statement¹¹ along with an edited publication concerning the scientific findings and offering recommendations for how to advance the field. Like earlier reviews, the Task Force emphasized the strong evidence for many positive short-term benefits, yet concluded that,
“Pre-k programs are not all equally effective” and
“Convincing evidence on the longer-term impacts of scaled-up pre-k programs on academic outcomes and school progress is sparse, precluding broad conclusions.” The Consensus Statement ended as follows:
In conclusion, the scientific rationale, the scientific positive evidence of impact on kindergarten readiness, and the nascent body of ongoing inquiry about long-term impacts lead us to conclude that continued implementation of scaled-up pre-k programs is in order as long as the implementation is accompanied by rigorous evaluation of the impact. (Emphasis added by current authors.)
A statewide pre-k study in the state of Tennessee in the United States reported that 2,990 children from low-income families randomly assigned to offers to attend pre-k had lower standardized achievement scores in 3rd grade than control children did. Negative effects also were reported for school attendance, discipline infractions, special education placement, and grade retention.¹² One reason offered for the unexpected follow-up results was that the program was of poor quality, although no definitive evidence was presented to buttress that speculation.
The present study provides a set of findings regarding a scaled-up public pre-k program in the State of Louisiana in the US with outcome data extending through the end of 3rd grade for four successive larger statewide cohorts as the program expanded to include more local education agencies (LEAs). Earlier reports on these four cohorts affirmed that the program produced short-term benefits¹³ with significant cognitive gains from fall to spring in the pre-k year, resulting in greater overall kindergarten readiness.
The present study also addresses an increasingly serious concern about whether effects in social and behavioral research can be replicated,¹⁴ particularly as programs expand to serve more children and involve more LEAs. In other words, if a new program produces positive short-term results at first, will
these effects occur for future cohorts that include additional schools and an even more heterogenous study sample? Further, will short-term gains be associated with longer term benefits for students when they enter a wider range of public school settings? To our knowledge, this study provides a unique set of findings about public pre-k quality with a longitudinal, population-based comparative research design focused on the issue of replication of program implementation and findings across increasingly larger successive statewide cohorts.
Methods
OVERVIEW OF THE STATEWIDE PRE-K PROGRAM AND STUDENT INFORMATION SYSTEM
From the start, the state Department of Education (DOE), the state Board of Elementary and Secondary Education, and the State Superintendent of Education supported a strong DOE/University partnership to ensure rigorous program implementation and associated longitudinal follow-up research by prospectively following the students who participated in the pre-k program and a matched comparison group throughout the school years. To follow students prospectively, the State operates a computerized, longitudinal Student Information System and conducts frequent checks on data integrity, thus permitting children’s academic achievement and school progress to be tracked even when students transfer to other schools within the state. The state’s DOE/University partnership convened quarterly meetings to review and interpret newly collected and analyzed data, make plans for program implementation and monitoring, request additional data analyses, and disseminate findings to key public interest groups including the state legislature and individual LEAs. This partnership supported the preparation and submission of regular annual reports and public presentations to the state Board of Elementary and Secondary Education and the state legislature.
This public pre-k program had the explicit goal of boosting the school readiness and subsequent academic achievement and school adjustment of children from low-income families. In this state, as well as the nation, poverty disproportionately affects African Americans/Blacks and Hispanics, although the academic and cognitive toll of growing up in economic poverty—especially during the first 5 years of life—affects children from all racial and ethnic groups (e.g., Yoshikawa, Aber, & Beardslee, 2012).¹⁵ This public pre-k program (PPK) developed a set of formal statewide standards that included:
-
a full 6-hour school day with after-school options and a full academic year program
-
a certified lead teacher and qualified teacher assistant in each classroom
-
an adult-to-child ratio of 1 to 10 or less
-
classroom size of 20 or fewer students
-
use of an evidence-based pre-k curriculum
-
intensive professional development for teachers focused on research-informed strategies to support the pre-k Standards of Learning and benchmarks for children’s progress
-
standardized assessments of each child’s fall and spring academic achievement, and independent standardized measures of classroom quality
The pre-k classrooms also had specialists available in reading, language arts, special education, and English as a Second Language. Further, each school was required to develop plans for coordinating health and mental health supports, before and after school child care, and family social services. All participating schools understood that data about classroom quality and the progress of all students would be measured systematically and reported publicly to the state DOE and the state legislature. Additionally, all LEAs received summaries of their local data annually (along with statewide results) and were eligible for technical assistance and additional professional development through the state’s DOE central staff and the Abecedarian Approach leadership and staff.
Children from families with a household income of less than 185 percent of the federal poverty level were provided access free-of-charge to the PPK program. Children from higher income families were allowed to participate in the program if their families paid tuition (on a sliding scale) or if the LEA chose to cover the costs for all students. Although students from low-income families comprised the highest priority for admission, children from higher income families were included as space permitted. For the first four cohorts, a consistent mean of 85 percent of the admitted PPK children lived in low-income family households.
To ensure quality in the pre-k program, the classrooms were independently assessed with the Early Childhood Environment Rating Scale-Revised (ECERS-R), a standardized measure of the quality of child care environments.¹⁶ We previously reported that the pre-k classrooms for the first four cohorts met high standards for implementation: the successive cohort ECERS-R means were 5.7, 6.0, 6.0, and 5.8 (overall M=5.9) on a scale from 1 to 7, where 1=inadequate, 3=minimal, 5=good, and 7=excellent. None of the pre-k classrooms scored below 4 and many scored either 6 or 7. For comparison, a nationally representative sample of Head Start classrooms at that time had a mean ECERS-R score of 4.8, with 8 percent of the classrooms scoring below.¹⁷
Concerning student progress, we previously reported¹³ that the PPK students in the first four cohorts consistently showed large fall-to-spring gains in their PreK year standardized scores in Language, Print Concepts, and Mathematical Concepts and Operations as measured by the Developing Skills Checklist (1990).¹⁸ Specifically, by spring of the PPK program, children in each of the four cohorts earned mean scores at or above the national average in all domains assessed — a notable achievement given that their fall mean scores were below the 20th percentile. To see if these gains conferred an advantage for students after they entered public school, we followed each cohort for four consecutive years, corresponding to end of 3rd grade for those who were grade-promoted on time. In spring of 3rd grade, the state administers its first set of mandated standardized academic achievement tests to all students. The present study includes comparison students in the same schools at kindergarten from comparably low-income households who did not receive PPK (local, state, or federal).
STUDY DESIGN AND IDENTIFICATION OF THE LONGITUDINAL COHORTS
Prospective data from kindergarten entry through the first four years in elementary school were obtained for four successive cohorts of PPK students enrolled in the scale-up phase of the statewide program who enrolled in kindergarten in the fall of 2003 (N=2,738 for Cohort 1), 2004 (N=3,804 for Cohort 2), 2005 (N=3,287 for Cohort 3), and 2006 (N=5,725 for Cohort 4), yielding a combined total of 15,554 students who received the new and expanding statewide pre-k program in the year prior to entering kindergarten. In the same years, the comparison cohorts of income-matched children in the same schools who did not receive any publicly funded pre-k program included 11,420 for Cohort 1, 10,893 for Cohort 2, 12,535 for Cohort 3, and 14,137 for Cohort 4, yielding a combined total of 48,985 family income-matched students in the no public pre-k groups (NPPK). This study, approved by the university Institutional Review Board, did not require individual parental permission because no new data were collected and student and family anonymity and confidentiality were fully protected.
Inclusion criteria for the PPK cohorts were: 1) an intake form completed by October 1st of the year they enrolled in the pre-k program, 2) receiving free and reduced lunches (a proxy for family household income since eligibility was up to 185 percent of the federal poverty level based on family size [USDA, 2016]),¹⁹ and 3) having scores on the Developing Skills Checklist in the fall and spring of their pre-k year (assessment twice a year was a specific program requirement). We then tracked these PPK students in the DOE’s computerized Student Information System (SIS), starting with the year they entered kindergarten.
For each entering school year, we identified a matched comparison group. Inclusion criteria for the comparison cohort groups were: 1) being in kindergarten classrooms in the same schools that the PPK students attended (total N=668 schools), 2) receiving free and reduced lunches, and 3) having the designation of No Public Pre-K (NPPK), which eliminated students who had received 4-year old Head Start or who were enrolled in Special Education classrooms or any other publicly funded program for 4-year olds as indicated in the SIS.
Our rationale for including only children who attended kindergarten in the same public schools was twofold. First, by selecting a comparison group of students who were in the same kindergarten schools as the pre-k children, we provided a contextualized educational equivalence that helps to ensure that the children in the PPK and NPPK groups had kindergarten exposures that were comparable (e.g., same classroom conditions, same curriculum, same teaching staff, same educational supports, same school leadership) and came from the same neighborhoods served by the school’s catchment area. Second, we eliminated NPPK students who attended schools that did not serve any PPK program children each year. Because the new PPK program placed priority on serving children from low-income families, the LEAs that were selected for funding through a competitive process served a higher proportion of children from low-income families than did schools not participating in this new program. These selected LEAs also may have been of somewhat higher quality, at least in terms of school leadership, resources, and commitment to serving the target population, although this is difficult to document. By the fourth year of the PPK program, 513 elementary schools with kindergarten classes were included, from a statewide total of 775.
It is important to note that students in the NPPK comparison group may have received a variety of forms of non-parental care prior to entering public kindergarten; unfortunately, the specific types and amounts of private child care and other educational programs or services were not recorded in the SIS database. Thus, the NPPK group is likely to be quite heterogeneous in terms of their prior non-parental care experiences, including the possibility of having received relative care, family daycare, center-based care, and a variety of other community-based services and early childhood education programs that were not publicly funded. In summary, the successive cohorts represent all students from low-income households who did or did not receive public pre-k and attended kindergarten classrooms. Accordingly, the longitudinal outcome analyses reported in this article compared the progress of all kindergartners attending the same schools who were receiving free and reduced meals and either participated in the PPK or had no known public pre-k experience (NPPK).
EDUCATION OUTCOME MEASURES
We used the following outcome measures: (1) scaled scores and pass rates (met “basic level or above” threshold) on state-administered standardized academic achievement tests, (2) grade retention since entering kindergarten, and (3) special education placement any time from kindergarten through end of next four years after cohort year of designation. The DOE administers a mandatory and commonly used standardized test, which is based predominately on items from the norm-referenced Iowa Tests of Basic Skills²⁰ with supplemental criterion-referenced items and scoring that align with the State’s Grade-Level Expectations. This assessment is administered in a group setting with a trained teacher present to provide instructions and monitoring of students. Testing occurs between April and May in the 3rd grade year for all students, with accommodations available for students with special needs. Scoring of the assessments is completed by an external party and scores are presented in two primary formats: the score for each of the four subject areas (on a scale from 100 to 500) and in terms of the competency level, with the state’s strong focus on the percentage of students who meet the state’s criterion score for “basic and above.” (The state designates both higher and lower categories of academic achievement by
predefined ranges of scores.) Test scores are reported to the state Board of Education as well as to LEAs and the public. For the statistical analyses here, we focus primarily on the state’s standardized scaled scores for all subject areas assessed—that is, English Language Arts, Math, Science, and Social Studies. We further describe the students’ achievement in terms of whether they met or exceeded the state’s threshold for “Basic or above” levels of competency for 3rd grade.
Both grade retention and special education placement were coded as binary outcomes, indicating whether a student was ever grade retained or placed in special education from kindergarten through the next four years. Special education designation was based on one of several variables in the SIS indicating a student had an Individualized Education Plan or received formal special education services during a given school year.
DATA ANALYSIS STRATEGY
To assess the association between 3rd grade academic achievement and PPK versus NPPK, we created two-level hierarchical linear models (HLM); for the binary outcomes, we formulated hierarchical generalized linear models (HGLM). Due to the nested data structure of individual students within schools, we selected HLM and HGLM as the most appropriate methods to analyze these data²¹ and used HLM 7 software throughout.²² At the student (Level-1), co-variates entered were PPK participation, gender, and race; the student’s age at fall of the kindergarten year was included as a control variable. We provide specific equations related to the HLM analyses in the results section.
Results
DEMOGRAPHIC COMPARISON OF GROUPS
Table 1 presents the demographic characteristics of the state PPK and NPPK samples for each cohort. Boys and girls were distributed approximately equally in each of the cohorts that received the PPK, with quite minor imbalances (<2%), in contrast to the NPPK cohorts that tended to have somewhat higher proportions of boys (53.9 to 55.1%) for each cohort. The pre-k cohorts consistently had a lower proportion of African Americans/Blacks than did the NPPK group for each of the four cohorts. Finally, the mean age of the NPPK students was older by 0.1 to 0.2 years (equivalent to 1.2 to 2.4 months) for each cohort. Because of these group differences, the HLM/HGLM models appropriately take these variables (as co-variates) into account.
Table 1. Demographic Information for Four Cohorts of Pre-K Participants and NPPK Comparison Groups
| Cohort | Cohort 1 | Cohort 2 | Cohort 3 | Cohort 4 |
|---|---|---|---|---|
| Pre-K | NPPK | Pre-K | NPPK | |
| Total | 2,738 | 11,420 | 3,804 | 10,893 |
Frequency (%)
Gender
Girls – 1,387 (50.7), 5,259 (46.1); 1,856 (48.8), 4,975 (45.7); 1,637 (49.8), 5,794 (46.2); 2,861 (50.0), 6,351 (44.9)
Boys – 1,351 (49.3), 6,161 (53.9); 1,948 (51.2), 5,918 (54.3); 1,650 (50.2), 6,741 (53.8); 2,864 (50.0), 7,786 (55.1)
Race
African American/Black – 1,482 (54.1), 6,983 (61.1); 2,123 (55.8), 6,493 (59.6); 1,598 (48.6), 7,124 (56.8); 3,186 (55.7), 8,336 (59.0)
Non-Hispanic White – 1,136 (41.5), 3,980 (34.9); 1,501 (39.5), 3,879 (35.6); 1,509 (45.9), 4,715 (37.6); 2,254 (39.4), 5,150 (36.4)
Other³ – 120 (4.4), 457 (4.0); 180 (4.7), 521 (4.8); 180 (5.5), 696 (5.6); 285 (5.0), 651 (4.6)
Mean (SD)
Age at Kindergarten Entry – 5.4 (0.3), 5.6 (0.5); 5.4 (0.3), 5.6 (0.5); 5.5 (0.3), 5.6 (0.5); 5.4 (0.3), 5.6 (0.5)
Note. Demographics here represent kindergartners who received free and reduced meals.
¹ “Pre-K” designates students in the statewide public pre-K program.
² NPPK represents students who entered kindergarten during the same school year in the same schools as Pre-K participants, but did not participate in any public pre-k program.
³ “Other” includes Hispanic, American Indian or Alaskan Native, and Asian or Pacific Islander.
HLM RESULTS FOR ACADEMIC ACHIEVEMENT OUTCOMES
To begin building an HLM model for each academic subject, first, we specified unconditional models in which no predictors were included in the models. For English Language Arts (ELA), for example, the unconditional model was specified as:
Level-1: ELAᵢⱼ = β₀ⱼ + rᵢⱼ
Level-2: β₀ⱼ = γ₀₀ + u₀ⱼ ,
where ELAᵢⱼ is the English Language Arts score for student i in school j. We formulated unconditional models for Math, Science, and Social Studies similarly. From the unconditional model, the intraclass correlation (ICC), a measure of cluster effects, was calculated. For the ELA model, the ICC was 0.107, indicating that 10.7% of the variation in ELA test scores was between schools. For Math, Science, and Social Studies, the ICCs were 0.121, 0.140, and 0.106 respectively. In educational research, ICC values of 0.05 and 0.20 are typical; the ICC values for these models, along with the significant variance at both the school and student levels, justified the use of HLM.²³
Next, at level-1, the following variables were entered: (PPK participant=1, no public pre-k=0), gender (boy=1, girl=0), and race (two indicator variables: African American/Black=1 and Other=1, with White as the reference group) and age at fall kindergarten (centered around the grand mean and fixed at level-2). At the school level (Level-2), no covariates were included in the models. Table 2 shows the final HLM results for each academic subject test for each of the successive cohorts. For all four cohorts in all of the assessed subject areas, the PPK group significantly outperformed the NPPK comparison group (p<.001 for all; see the coefficients for “Pre-K Participant, 1/0” in Table 2). For ELA, the coefficients related to pre-k participation fell between the range of 9.86 (Cohort 1) to 12.78 (Cohort 3), indicating that, accounting for gender, race, and school context, students in the pre-k group on average scored 9.86 to 12.78 points higher on the ELA exam compared to students in the corresponding NPPK group. For Math, students in the PPK group scored significantly higher (p<.001) than NPPK students, ranging from 11.09 (Cohort 1) to 12.45 (Cohort 3) points higher. For both Science and Social Studies, pre-k students scored significantly higher than NPPK students did (p<.001 across cohorts), but the magnitude of differences was somewhat lower than for ELA and Math.
Race was significant in the HLM models for all four subject areas for each of the four cohorts. More specifically, students who were African American/Black scored lower than non-Hispanic white students did across all subject areas and in all cohorts (p<.001 in all cohorts and subjects). Students designated in the “Other” race classification (almost entirely Hispanic/Latino) scored significantly lower in Science as compared to non-Hispanic white students; in the other subject areas, there was no consistent pattern of differences across cohorts for these students. Gender revealed significant and consistently replicated effects only for the subject area of ELA. Specifically, girls performed significantly higher than did boys on ELA tests (p<.001 in all cohorts). For the other subject areas, however, gender was either not significant or showed variation in effects; further, when significant gender effects appeared in these other subject areas, both their magnitude (i.e., coefficient value) and level of significance were far smaller than for ELA. Finally, the kindergarten age of students in these cohorts showed a significant relationship to third grade achievement scores, such that the older kindergarten children had significantly lower scores in all four areas.
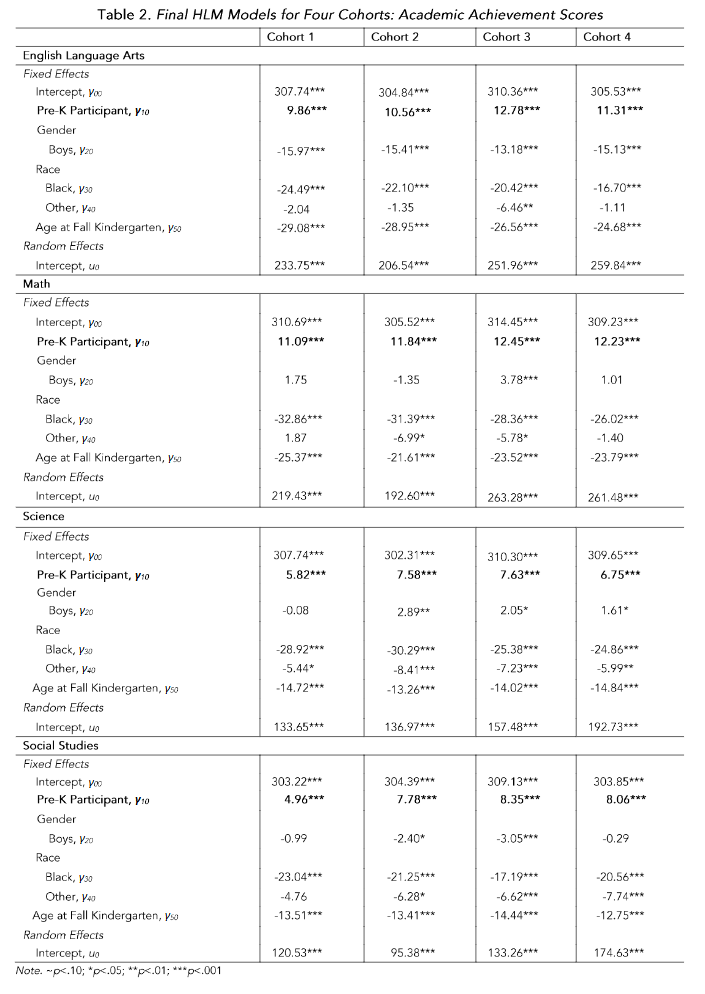
Table 3 presents the means and standard deviations for academic achievement scores for all cohorts and subject areas for the PPK and NPPK groups. The effect sizes also are shown. As revealed by the HLM analyses, the magnitude of differences between the PPK and NPPK students was greater for the ELA and Math subject areas than for the areas of Science and Social Studies, although all reach statistical significance. The effect sizes are above .25 for all comparisons for ELA and Math, ranging from .26 to .33. The effect size values range from .17 to .26 for Science and Social Studies.
Table 3. Academic Achievement Scores for Four Cohorts of Pre-K Participants and NPPK Comparison Groups
| Cohort | Cohort 1 | Cohort 2 | Cohort 3 | Cohort 4 |
|---|---|---|---|---|
| Pre-K | NPPK | Pre-K | NPPK |
Means, Standard Deviations (SD), and Effect Sizes (ES) of Academic Achievement Scores
Eng. Lang. Arts
300.2 (52.6) vs 283.9 (61.8), .26
298.4 (51.5) vs 282.4 (60.9), .26
307.7 (47.8) vs 287.6 (60.9), .33
303.0 (48.8) vs 284.5 (59.6), .31
Math
307.7 (53.4) vs 290.9 (61.3), .27
301.2 (55.4) vs 284.4 (60.5), .28
316.5 (53.6) vs 296.2 (61.4), .33
309.6 (53.9) vs 291.3 (60.6), .30
Science
299.1 (45.9) vs 289.7 (49.2), .19
295.7 (44.4) vs 284.8 (49.6), .22
306.8 (42.7) vs 294.2 (49.3), .26
304.2 (45.8) vs 293.3 (50.7), .21
Social Studies
296.7 (44.2) vs 288.3 (49.5), .17
300.2 (44.7) vs 289.5 (48.5), .22
307.9 (39.4) vs 295.4 (48.0), .26
300.9 (45.1) vs 289.6 (50.5), .22
Note.
1 – “Pre-K” designates students in the statewide public pre-k program.
2 – NPPK represents students who entered kindergarten during the same school year in the same schools as Pre-K participants, but did not participate in any public pre-k program.
3 – Academic achievement scaled scores (on the statewide exams) ranged from 100–500.
Figure 1 displays the academic achievement findings from the statewide assessments in another metric—namely, the proportion of students in the PPK and NPPK groups that met or exceeded the state’s cutoff for being competent at the “basic or above” level for grade level. Note: this often is referred to as a pass rate. In order to provide context for these results, Figure 1 also includes the statewide mean passing rate for each subject area. For ELA, the PPK students in each cohort had passing rates that ranged from a low of 66.9% for Cohort 1 to a high of 73.8% for Cohort 3 compared to lower rates for NPPK students that ranged from 56.6% up to 60.7%. Calculating the combined means for PPK and NPPK students, in which each cohort is weighted equally, the overall means were 70.4% for the pre-k cohorts and 58.8% for the NPPK. The PPK students’ pass rates exceeded that statewide average for each cohort.
The Math pass rates are almost identical to those for ELA. The PPK cohorts met or exceeded basic level ranging from 66.1% for Cohort 2 to 76.0% for Cohort 3, yielding an overall mean for all four cohorts of 70.6%. For the NPPK students, their pass rates ranged from 54.9% for Cohort 2 to 62.5% for Cohort 3, with a combined mean of 58.4%. Once again, the pass rate for the pre-k students exceeded the state average for each cohort and the combined cohort mean of 65.7% pass rate for Math statewide. In the areas of Science and Social Studies, similar patterns appear in which the PPK students have higher pass rates than the NPPK students and the same or higher pass rates compared to the state for all four cohorts.
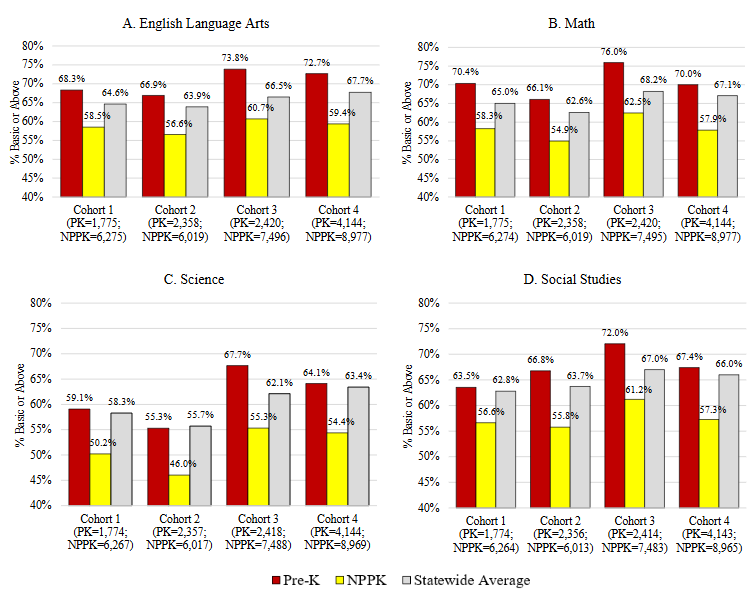
Figure 1: Academic achievement at the end of 3rd grade, expressed as a percentage of children in each cohort scoring at “Basic or Above,” for children who received public pre-K (red) or who had no public pre-K (yellow). Differences between the public pre-K and no public pre-K groups were all statistically significant (p<.001), as shown in Table 2. Statewide percentages of children scoring “Basic or Above” are shown in gray.
HLM RESULTS FOR GRADE RETENTION AND SPECIAL EDUCATION PLACEMENT
For both Grade Retention and Special Education Placement, hierarchical generalized linear models (HGLM) were specified because the outcomes were binary (i.e., ever retained in a grade or ever placed in special education from Kindergarten to 3rd grade). Similar to the academic achievement models, the first step in model building was to run unconditional models. For Grade Retention, the unconditional model was:
Level-1: Prob(Retainedᵢⱼ=1|βⱼ) = φᵢⱼ
log[φᵢⱼ/(1 − φᵢⱼ)] = ηᵢⱼ
ηᵢⱼ = β₀ⱼ
Level-2: β₀ⱼ = γ₀₀ + u₀ⱼ ,
where Prob(Retainedᵢⱼ=1|βⱼ) is the log odds of student i in school j being retained in a grade. The significant variability of grade retention among schools (p<.001), as shown in the unconditional model, justified the use of HGLM. A similar unconditional model was formulated for special education placement; again,
there was significant variability (p<.001) of special education placement among schools. Building on the unconditional models, at level-1 the variables of PPK participation (pre-k participant=1, no public pre-k=0), gender (boy=1, girl=0), and race (two indicator variables: African American/Black=1 and Other=1, with White as the reference group) were included as covariates and age at Fall kindergarten (grand mean centered and fixed at level-2) was added as a control. At the school level (Level-2), no covariates were included in the models.
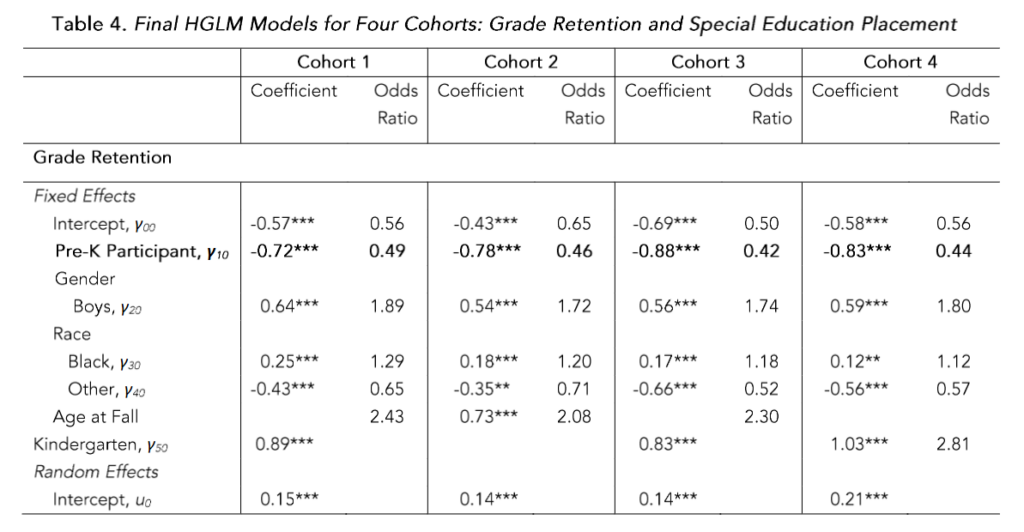
Table 4 shows the HGLM results for grade retention and special education placement. For all four cohorts, participation in the statewide PPK was associated with significantly reduced rates of grade retention (Cohort 1: OR = 0.49; Cohort 2: OR = 0.46; Cohort 3: OR = 0.42; Cohort 4: OR = 0.44; p<.001 in all cohorts); more specifically, accounting for gender, race, and school context, participating in the pre-k program decreased the risk of grade retention by 51–58%, depending on the cohort. Across all cohorts, boys were more likely to be grade retained than girls were (Cohort 1: OR = 1.89; Cohort 2: OR = 1.72; Cohort 3: OR = 1.74; Cohort 4: OR = 1.80; p<.001 in all cohorts). African American/Black students were more likely to be grade retained as compared to non-Hispanic white students (Cohort 1: OR = 1.29; Cohort 2: OR = 1.20; Cohort 3: OR = 1.18; Cohort 4: OR = 1.12; p<.001 in all cohorts), while students in the “Other” category were less likely to be grade retained (Cohort 1: OR = 0.65; Cohort 2: OR = 0.71; Cohort 3: OR = 0.52; Cohort 4: OR = 0.57; p<.001 in all cohorts).
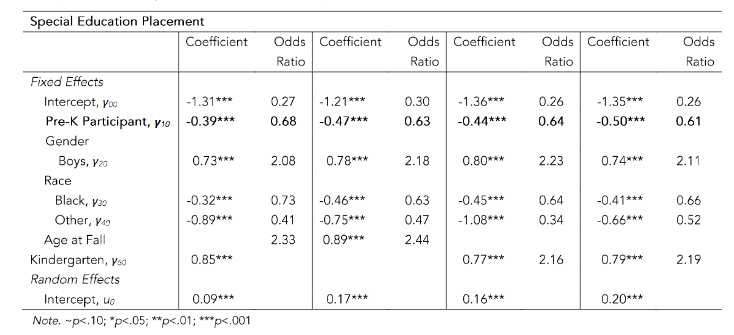
Participation in the statewide pre-k program was also associated with reduced rates of special education placement within the first four years in elementary school compared to children in the NPPK group for each cohort (Cohort 1: OR = 0.68; Cohort 2: OR = 0.63; Cohort 3: OR = 0.64; Cohort 4: OR = 0.61; p<.001 in all cohorts); specifically, attending the pre-k program decreased the risk of special education placement by 32–39%, depending on the cohort. Across all cohorts, boys were more likely than girls to be placed in special education (Cohort 1: OR = 2.08; Cohort 2: OR = 2.18; Cohort 3: OR = 2.23; Cohort 4: OR = 2.11). African American/Black and students in the “Other” classification were less likely than White/Non-Hispanic students to be placed in special education (Cohort 1: OR = 0.73; Cohort 2: OR = 0.63; Cohort 3: OR = 0.64; Cohort 4: OR = 0.66; and Cohort 1: OR = 0.41; Cohort 2: OR = 0.47; Cohort 3: OR = 0.34; Cohort 4: OR = 0.52, respectively).
Table 4. Final HGLM Models for Four Cohorts: Grade Retention and Special Education Placement
In Figure 2, the proportion of students who were grade retained or placed in special education in both the PPK and NPPK groups are shown for each cohort. The percentage of PPK students grade retained ranged from 22.7% (Cohort 3) to 29.1% (Cohort 2) with a combined mean of 26.0% retained in grade at least once. For the NPPK group, grade retention rates ranged from 44.2% (Cohort 3) to 48.1% (Cohort 1) yielding a combined grade retention rate of 47.0%.
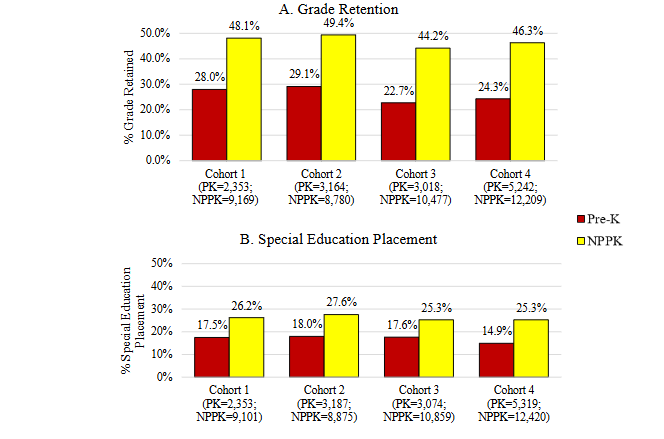
Figure 2. Percentage of students who were (A) retained in a grade at least once or (B) placed in special education within four years of entering public school as a function of receiving the Pre-K program (red) or no public pre-K (yellow). Differences between the public pre-K and no public pre-K groups were all statistically significant (p<.001), as shown in Table 4.
Similarly, Figure 2 shows that special education placement is markedly lower for students in PPK compared to the NPPK group for each cohort. Special education placement for students in the NPPK group ranged from 25.3% (for both Cohorts 3 and 4) to 27.6% for Cohort 2, while rates for those in the PPK group ranged from 14.9% (Cohort 4) to 18.0% in Cohort 2. The mean rates of special education placement for NPPK students across cohorts was 26.1% and 17.0% for PPK students.
LIMITATIONS OF THE STUDY
We realize the importance of identifying several limitations inherent in this study. First, these results are based on findings from a single state. Like all states, the demographics of students and the state and local LEA resources, policies, and changes from year to year may not be representative of these factors in other states and LEAs. Accordingly, we have no basis for predicting whether these results would be obtained in other states or LEAs. On the other hand, this state took strong action to invest in early childhood education—consistent with the advice of leading economists²³,²⁴,²⁵ and early childhood educators—with the explicit goal of helping to improve the school academic performance and school health of children from low-income families. The findings confirm that this PPK program is associated with positive results in both school performance and student health, as indexed by the reduction in grade retention and special education placement. Second, as described earlier, the children in the No Public Pre-K (NPPK) comparison group may have received a variety of forms of non-parental care prior to entering public kindergarten. The specific types and amounts of care were not recorded in the state’s Student Information System database, thus limiting our research and ability to do individual propensity score matching. To account for this, we did match the students in our NPPK comparison group on household income being below 185% of the federal poverty level and being in kindergarten classrooms in the same schools as the PPK students, making adjustments in the HLM models for race, gender, and age at kindergarten entry.
To counterbalance these limitations, this study’s strengths are that it began from the very start of an initial statewide implementation and planned scale-up, includes the entire eligible population rather than either a randomized selected or sample-of-convenience subset of program participants, tracks students in both PPK and NPPK samples when they re-locate to other public schools, and systematically considers the extent to which replicability of findings obtains across cohorts. This program also represents a prospective study that was not part of an externally funded, short-term “demonstration project,” but rather exemplifies a real-world commitment with many stakeholders to improving the outcomes for children who historically have faced significant challenges in early school success, in large part associated with inadequate educational and learning opportunities during the first five years of life.
Discussion
The findings from this statewide longitudinal study provide strong supporting evidence that a high-quality statewide public pre-K program consistently implemented is significantly linked to:
-
moderately long-term higher academic achievement scores in all academic subject areas assessed,
-
markedly lower rates of grade retention, and
-
substantially reduced rates of Special Education placement.
These findings considerably extend earlier reports of short-term gains associated with participating in large-scale public pre-K programs (e.g., Gormley, Phillips, & Gayer, 2008; Hill, Gormley, & Adelstein, 2015; Ramey et al., 2009; Durkin et al., 2022). More specifically, these results address a major concern about whether a high-quality pre-k program that is scaled-up across multiple schools and LEAs can consistently yield evidence of educationally meaningful benefits, in contrast to the so-called but frequently misinterpreted “fadeout effect”²⁶,²⁷ that others have predicted might occur by the end of 3rd grade. The so-called fade-out effect fails to distinguish between losing acquired skills and failing to acquire new expected skills taught in higher grades—a serious conceptual error in understanding developmental trajectories. The present results
indicate that positive educational effects can be detected both in the early phases of launching a statewide pre-k program (e.g., Cohorts 1 and 2 in this study) and then later replicated in subsequent years (e.g., Cohorts 3 and 4) when the program is rapidly scaling-up to serve much larger numbers of students in more classrooms, schools, and LEAs. The presence of strong statewide leadership and management skills, along with a stable DOE-University partnership, is likely a critical component in obtaining replication of benefits over time.
Findings from this longitudinal study offer much-needed support for the conclusion that children from low-income families can measurably benefit from a statewide high quality, full-day pre-k program that is actively monitored for both program implementation and student outcomes. We have pondered two noteworthy aspects of these results. First, participation in this PPK for 4-year-olds from low-income families helped to reduce, but did not eliminate, the academic achievement disparities strongly associated with being from a minority racial/ethnic background. Further, we do not know why African Americans/Blacks were somewhat underrepresented in the pre-k compared to NPPK cohorts, although they comprised the largest group in all of the cohorts. This warrants further investigation, and we were unable to find out in reviewing other public pre-k studies whether this has occurred elsewhere.
Second, a result that was unanticipated was that these PPK students who were receiving free and reduced meals not only consistently performed better than the students in the NPPK comparison group, they consistently performed at academically higher levels than did overall student statewide averages (all schools and all income groups combined). This important finding deserves closer scrutiny particularly with respect to family, child, and LEA subgroups via detailed sensitivity analyses to better understand risk and response-to-treatment issues. Such analyses could help to improve cost-effectiveness and human capital returns of investing in similar programs.
These findings have important policy and economic implications for other LEAs and states to consider. In addition to academic achievement, on-time arrival in 4th grade has become a high-priority goal for many public schools. This educational attainment is assumed to reflect that a student has shown sufficient cumulative progress in both academic performance and general social-emotional adjustment to support the educational decision for grade promotion. Similarly, Special Education placement after kindergarten is a composite indicator of how well a student is adjusting to and benefiting from the regular education program. When children are not grade-promoted (i.e., they are retained in grade) and when they are placed in Special Education, state and local school systems incur substantial extra costs, with federal costs further implicated for Special Education programs.³⁰ The magnitude of differences between the groups is not just statistically significant but sufficiently large to have educationally important implications, with effect sizes above .25 for academic achievement scores and relative risk reduction rates of a third and greater for grade retention and special education placement.
Important programmatic features of this statewide public pre-K program were its commitment to measuring and publicly reporting on program quality and student achievement for all participating children, from the very beginning. Equally important was adopting high program standards that included adoption of an evidence-based curriculum conjoined with intensive state professional development and technical assistance to help classroom teachers and school administrators succeed in fully implementing the program as intended. And finally, having a sustained engagement via a University/DOE education partnership in reviewing and acting upon findings as an integral program feature. In Table 5 we identify key implementation features of the present study. That the results consistently support replication of findings is a unique focus of this scale-up.
Table 5. Hallmarks of a Statewide Early Childhood Program Associated with Developmental Benefits
-
DOE leadership was stable, highly engaged and deeply knowledgeable about the content creation and operational features
-
The content was based on publicly available scientific findings
-
The PPK program was intensive – full day, regular school calendar
-
Features of the PPK were specified to achieve maximum desired experiences for children along with flexibility for intended individualization as needed
-
Before the PPK was implemented, it was supported by external peer review and by leaders in the local community
-
PPK program staff received preservice training and ongoing professional development
-
Implementation was monitored to provide insights and strategies about issues of concern
-
High levels of participation among children and families were strongly supported (e.g. transportation, illness policies, hours of operation, program calendar)
-
Children’s progress was assessed by standard methods, and regularly analyzed and reported to leadership and public groups including the legislature
-
The PPK program was documented in sufficient detail to guide replication across cohorts
-
DOE leadership had sufficient resources and control over expenditures so that adjustments could be made during the statewide expansion of program sites
-
The DOE/University partnership efficiently capitalized on the main strengths of each organization and had strong bipartisan support in the legislature
Finally, we would like to share an observation about working at the intersection of human developmental science, educational practice, healthy lifespan development, and public policy. Forging and sustaining long-term working partnerships with leaders, practitioners, university researchers, and policymakers is neither “science as usual” nor running schools, public programs or universities “as usual.” This sustained partnership model appears promising if we are to generate empirical findings and identify specific processes that can help inform a first-rate, effective system of early childhood education and health supported by an ongoing scientific and educational perspective. Whether implementing a rigorous evaluation as an integral component of the program itself contributed to the actual implementation and maintenance of a high-quality program across successive cohorts cannot be ascertained. We would nominate, however, that these results are highly consonant with the conclusions of the 2017 Task Force on Pre-Kindergarten Effects that “Ongoing innovation and evaluation are needed during and after pre-k to ensure continued improvement in creating and sustaining children’s learning gains and mental and social development.”
Conclusion
As we approach a century of research on intellectual development and the factors that contribute to its expression we stand in contra-distinction to Alfred Binet who more than a century ago was charged with developing a test to exclude children who would not benefit from schooling – and thereby helped create a self-fulfilling prophecy of development that results in a large proportion of children displaying later under-accomplishment and being socially stigmatized. Instead we now have a large body of evidence that early cognitive or intellectual development is substantially malleable with multiple practical consequences and meaning for children, their families, their local communities, and the larger society. Thus, the most pressing questions now to address include how to design specific public programs to realize these outcomes, how to prioritize and individualize such programs – whether as targeted or universal supports, and how to appropriately fund and sustain these early life investments. Current population trends and societal resources must be taken into account, while engaging multiple stakeholders and considering a wide range of public and private entities. Ongoing and strong partnership models are likely to be important to success in supporting higher levels of accomplishment for all segments of the general population. Beginning early in life to support full individual development is now widely embraced and underlined by a full century of the science of human development.
References
1. Duncan GJ, Magnuson K. Investing in preschool programs. J Econ Perspect. 2013;27(2):109-132. doi:10.1257/jep.27.2.109.
2. Heckman JJ, Masterov DV. The productivity argument for investing in young children. Appl Econ Perspect Policy. 2007;29(3):446-493. doi: https://doi.org/10.1111/j.1467-9353.2007.00359.x.
3. Lowenstein AE. Early care and education as educational panacea: What do we really know about its effectiveness? Educ Policy. 2011;25(1):92-114. doi:10.1177/0895904810387790.
4. Lazar I, Darlington RB. Lasting effects of early education: A report from the Consortium for Longitudinal Studies. Monographs of the Society for Research in Child Development. 1982;47(2-3): 1-151. doi:10.2307/1165938.
5. Heckman JJ, Moon SH, Pinto R, Savelyev PA, Yavitz A. The rate of return to the HighScope Perry Preschool Program. J Public Econ. 2010;94(1):114-128. doi:https://doi.org/10.1016/j.jpubeco.2009.11.001.
6. Schweinhart LJ, Montie J, Xiang Z, Barnett WS, Belfield CR, Nores M. Lifetime effects: The High/Scope Perry Preschool Study through age 40. Ypsilanti, MI: High/Scope Press; 2005.
7. Ramey CT, Campbell FA, Burchinal M, Skinner ML, Gardner DM, Ramey SL. Persistent effects of early childhood education on high-risk children and their mothers. Appl Dev Sci. 2000;4(1):2-14. doi:10.1207/S1532480XADS0401_1.
8. Ramey CT, Sparling J, Ramey SL. Abecedarian: The ideas, the approach, and the findings. Los Altos, CA: Sociometrics Corporation.; 2012.
9. Ramey CT, Ramey SL. Early childhood education that promotes lifelong learning, health, and social well-being: The Abecedarian Project and its replications. Med Res Arch. 2023;11(11). doi:10.18103/mra.v11i11.4590.
10. Dodge KA, ed. The current state of scientific knowledge on pre-kindergarten effects. Durham, NC: Duke University; 2017.
11. Phillips DA, Lipsey MW, Dodge KA, et al. Puzzling it out: The current state of scientific knowledge on pre-kindergarten effects: A consensus statement. In: Dodge KA, ed. The current state of scientific knowledge on pre-kindergarten effects. Durham, NC: Duke University; 2017:19-30.
12. Durkin K, Lipsey MW, Farran DC, Wiesen SE. Effects of a statewide pre-kindergarten program on children’s achievement and behavior through sixth grade. Dev Psychol. 2022;58(3):470-484.
doi:10.1037/dev0001301.
13. Ramey CT, Ramey SL, Stokes BR. Research evidence about program dosage and student achievement: Effective public prekindergarten programs in Maryland and Louisiana. In: Pianta R, Howes C, eds. The Promise of Pre-K. Baltimore, MD: Brookes Publishing; 2009:79-105.
14. Open Science Collaboration. PSYCHOLOGY. Estimating the reproducibility of psychological science. Sci. 2015;349(6251):aac4716. doi:10.1126/science.aac4716.
15. Yoshikawa H, Aber JL, Beardslee WR. The effects of poverty on the mental, emotional, and behavioral health of children and youth: implications for prevention. Am Psychol. 2012;67(4):272-284. doi:10.1037/a0028015.
16. Harms T, Clifford RM, Cryer D. Early childhood environmental rating scale (Rev. Ed.). New York, NY: Teachers College Press; 2005.
17. Zill N, Resnick G, Kim K, O’Donnell K, Sorongon A. Head Start FACES 2000: A whole-child perspective on program performance. Washington, DC: Administration for Children Youth and Families, U.S. Department of Health and Human Services; 2003.
18. Developing Skills Checklist [Assessment Instrument]. Monterey, CA: CTB/McGraw-Hill; 1990.
19. United States Department of Agriculture, Food and Nutrition Services. (2016). Child nutrition programs: Income eligibility guidelines. Retrieved September 28, 2016, from
https://www.gpo.gov/fdsys/pkg/FR-2016-03-23/pdf/2016-06463.pdf
20. Hover HD, Dunbar SB, Frisbie DA. Iowa Tests of Basic Skills. . Rolling Meadows, IL: Riverside Publishing; 2001.
21. Raudenbush SW, Bryk AS. Hierarchical linear models: Applications and data analysis methods (2nd ed.). Thousand Oaks, CA: Sage; 2002.
22. Raudenbush SW, Bryk AS, Congdon R. Hierarchical Linear and Nonlinear Modeling (HLM) 7.01 for Windows. [computer program]. Skokie, IL: Scientific Software International, Inc.; 2013.
23. Snijders T, R. B. An introduction to basic and advanced multilevel modeling. Thousand Oaks, CA: Sage; 1990.
24. Donovan MS, Cross CT, eds. Minority students in special and gifted education. . Washington, DC: National Academy Press; 2002.
25. Grunewald R, Rolnick AJ. An early childhood investment with a high public return. The Regional Economist. 2010.
26. Gormley WT, Jr., Phillips D, Gayer T. The early years. Preschool programs can boost school readiness. Sci. 2008;320(5884):1723-1724. doi:10.1126/science.1156019.
27. Hill CJ, Gormley Jr WT, Adelstein S. Do the short-term effects of a high-quality preschool program persist? Early Child Res Q. 2015;32:60-79. doi:10.1016/j.ecresq.2014.12.005.
28. Barnett WS. Effectiveness of early educational intervention. Sci. 2011;333(6045):975-978. doi:10.1126/science.1204534.
29. Duncan GJ, Magnuson K. Investing in preschool programs. J Econ Perspect. 2013;27(2): 109–132. doi:10.1257/jep.27.2.109.
30. Bowman LJ. Grade retention: Is it a help or hindrance to student academic success? Prev Sch Fail. 2005;49(3):42-46. doi:10.3200/PSFL.49.3.42-46.