





Machine Learning for Endometriosis Prediction: Insights
Feature-Limited Performance in Machine Learning Prediction of Endometriosis from Clinical Symptoms
Rachel Lee1, Sarah Landman1 and Milan Toma1*
- Department of Osteopathic Manipulative Medicine, College of Osteopathic Medicine, New York Institute of Technology, Old Westbury, NY 11568, USA
OPEN ACCESS
PUBLISHED 28 February 2026
CITATION Lee, R., Landman, S., Toma, M., 2026. Feature-Limited Performance in Machine Learning Prediction of Endometriosis from Clinical Symptoms. Medical Research Archives, [online] 14(2). https://doi.org/10.18103/mra.v14i2.7221
COPYRIGHT © 2026 European Society of Medicine. This is an open-access article distributed under the terms of the Creative Commons Attribution License, which permits unrestricted use, distribution, and reproduction in any medium, provided the original author and source are credited.
DOI https://doi.org/10.18103/mra.v14i2.7221
ISSN 2375-1924
ABSTRACT
Background: Endometriosis affects approximately 10% of women of reproductive age worldwide, yet diagnosis remains challenging due to nonspecific symptoms and reliance on invasive laparoscopic confirmation, resulting in diagnostic delays averaging seven to ten years. Machine learning approaches have shown promise for noninvasive screening, but fundamental questions remain regarding whether performance limitations arise from model architecture constraints, insufficient training data, or intrinsic information ceilings imposed by symptom-based clinical features.
Methods: Five machine learning architectures (logistic regression with L1 regularization, support vector machines with radial basis function kernels, gradient-boosted decision trees, random forests, and deep neural networks) were systematically compared for endometriosis prediction using six base clinical variables from 10,000 patient records. The pipeline incorporated stratified data splitting (80%/10%/10% train/validation/test), label noise mitigation through ambiguity-based instance weighting, cost-sensitive learning prioritizing false negative reduction, and cross-validated threshold optimization. Feature engineering expanded the base features to 21 variables through interaction terms, polynomial transformations, and discretized bins. Learning curve analysis assessed whether performance was constrained by training set size or feature informativeness.
Results: All five model architectures converged to similar test performance (AUC range: 0.653–0.674), with the selected logistic regression model achieving test AUC of 0.674, recall of 0.566, precision of 0.562, and specificity of 0.696 at the Youden-optimized threshold. Feature engineering yielded negligible improvements, with mean test AUC changing by only 0.002 between baseline (6 features) and engineered (21 features) configurations. Learning curves plateaued beyond 60% of training data, with training and validation AUC converging to 0.667 and 0.641 respectively, and the gap narrowing from 0.058 to 0.026.
Conclusions: The convergence of multiple model families to similar performance limits, minimal gains from feature engineering, and plateaued learning curves provide empirical evidence that model performance is constrained by the information content of symptom-based clinical features rather than by model architecture, sample size, or feature representation sophistication. The observed AUC ceiling of approximately 0.65–0.67 aligns with published literature on symptom-based endometriosis screening and indicates that clinically actionable discrimination performance requires data enrichment through incorporation of imaging findings, biomarkers, or genomic risk factors rather than algorithmic innovation.
Keywords: endometriosis; machine learning; noninvasive screening; feature engineering; learning curves.
1. Introduction
Endometriosis is a chronic gynecological disorder characterized by the presence of endometrial-like tissue outside the uterine cavity, affecting approximately 10% of women of reproductive age worldwide. The condition manifests through a constellation of debilitating symptoms including chronic pelvic pain, dysmenorrhea, dyspareunia, and infertility, significantly impairing quality of life and productivity. Despite its prevalence and clinical significance, endometriosis diagnosis remains challenging due to the nonspecific nature of presenting symptoms, which overlap substantially with other gynecological and gastrointestinal conditions. The current diagnostic gold standard relies on laparoscopic visualization with histological confirmation, an invasive surgical procedure that carries procedural risks, requires specialized expertise, and imposes substantial healthcare costs. Consequently, patients experience diagnostic delays averaging seven to ten years from symptom onset to confirmed diagnosis, during which time disease progression may occur and therapeutic interventions are delayed. This diagnostic gap has motivated sustained research efforts to develop noninvasive screening tools capable of identifying high-risk individuals who would benefit from expedited referral to specialist care and confirmatory diagnostic procedures.
Machine learning approaches have emerged as promising methodologies for developing predictive models that leverage readily available clinical features to estimate endometriosis risk. Prior investigations have demonstrated that symptom profiles, demographic characteristics, and basic clinical variables contain predictive signal that can be extracted through supervised learning algorithms. Studies employing logistic regression, decision trees, and ensemble methods on datasets incorporating pain characteristics, menstrual history, and physical examination findings have reported area under the receiver operating characteristic curve values ranging from 0.60 to 0.75 when relying exclusively on clinical history without imaging or laboratory biomarkers.
More sophisticated approaches integrating transvaginal ultrasound findings, magnetic resonance imaging features, serum biomarker panels including CA-125 and inflammatory markers, or genomic risk scores have achieved discrimination performance in the 0.75 to 0.85 range, suggesting that multimodal data integration substantially enhances predictive accuracy. However, these advanced approaches require access to specialized imaging equipment, laboratory infrastructure, and genomic profiling capabilities that may not be uniformly available across healthcare settings, particularly in resource-limited environments where noninvasive screening tools would provide greatest value.
Despite this progress, significant methodological gaps remain in the existing literature. Most published studies have focused on optimizing a single modeling approach or have compared a limited subset of algorithms without systematic evaluation of whether performance limitations arise from model architecture constraints, insufficient training data, or fundamental information ceilings imposed by the feature set itself. Few investigations have rigorously assessed the impact of feature engineering strategies such as interaction terms, polynomial transformations, and discretization schemes on model discrimination capacity across multiple algorithm families. Furthermore, the question of whether observed performance plateaus reflect sample size limitations that could be overcome through larger datasets or instead indicate saturation of the predictive signal available from basic clinical variables remains largely unaddressed. This ambiguity has practical implications for clinical deployment and future research prioritization: if performance is sample-limited, data collection efforts should focus on expanding cohort size, whereas if performance is feature-limited, efforts should redirect toward enriching the predictor space through incorporation of imaging findings, biomarkers, or other objective measurements.
1.1. STUDY OBJECTIVES
The primary objective of this study is to conduct a comprehensive comparison of five machine learning architectures (namely, logistic regression with L1 regularization, support vector machines with radial basis function kernels, gradient-boosted decision trees, random forests, and deep neural networks) for endometriosis prediction using six base clinical features derived from a publicly available dataset comprising 10,000 patient records. Secondary objectives include evaluating the impact of systematic feature engineering through construction of interaction terms, nonlinear transformations, and discretized bin indicators; assessing whether model performance is constrained by training set size through learning curve analysis; and determining whether the observed performance ceiling reflects fundamental limitations in the information content of symptom-based clinical features or whether it could be overcome through algorithmic sophistication or increased sample size. By implementing a detailed methodological framework incorporating stratified data splitting, label noise mitigation, cost-sensitive learning, and threshold optimization via cross-validation, this investigation aims to provide evidence-based guidance regarding the extent to which machine learning can enhance noninvasive endometriosis screening using readily available clinical variables, and to identify whether future efforts should prioritize algorithmic innovation, dataset expansion, or feature space enrichment to achieve clinically actionable discrimination performance.
2. Methods
The pipeline utilized stratified train/validation/test splits (80%/10%/10%) to preserve class balance across all subsets. Feature engineering expanded the original six clinical variables (Age, Chronic Pain Level, BMI, Menstrual Irregularity, Hormone Level Abnormality, and Infertility) to 21 features through systematic inclusion of interaction terms, nonlinear transformations, and binning strategies. Standardization was applied only to continuous features to maintain interpretability of binary indicators. See
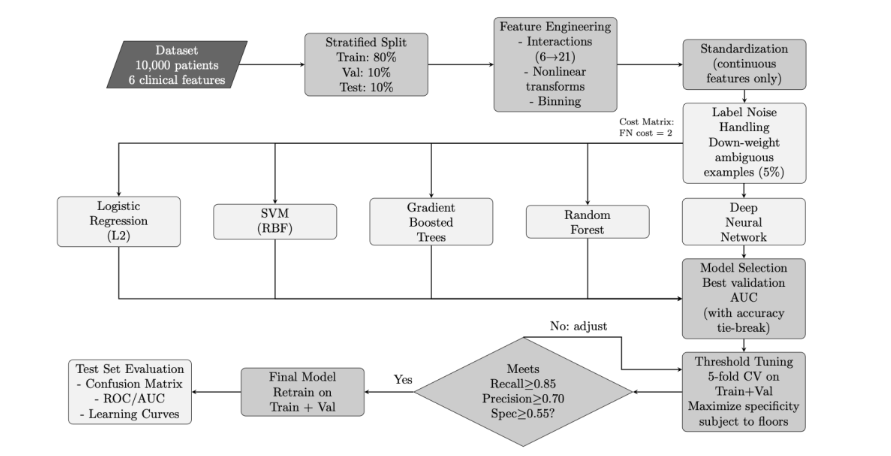
for detailed workflow demonstration.
The dataset comprised 10,000 patient records, each characterized by six clinical variables and a binary endometriosis diagnosis label. To account for the clinical priority of minimizing false negatives, a cost-sensitive framework was implemented throughout the pipeline, assigning a false negative cost of 2 relative to false positives. This asymmetric penalty reflects the greater risk associated with missed diagnoses in clinical screening contexts. While alternative approaches to class imbalance such as synthetic oversampling techniques have shown efficacy in addressing skewed class distributions, we opted for cost-sensitive learning to maintain the integrity of the original data distribution.
2.1. HYPERPARAMETER CONFIGURATION
All model training and evaluation procedures followed a systematic protocol with carefully controlled hyperparameters to ensure reproducibility and fair comparison across algorithms. The complete configuration is organized into four categories: data preprocessing and feature engineering (Table 1), cost matrix and threshold selection (Table 2), model-specific hyperparameters (Table 3), and learning curve analysis settings (Table 4).
Data preprocessing (Table 1) employed stratified train/validation/test splits (80%/10%/10%) with a fixed random seed (42) to ensure reproducibility. Feature engineering systematically expanded the six base clinical variables to 21 features through interaction terms, polynomial transformations, and discretized bins. Standardization was applied only to continuous features (Age, Chronic Pain Level, BMI) to preserve interpretability of binary indicators.
| Category | Parameter | Value/Formula |
|---|---|---|
| Data Processing | Random Seed rng | 42 |
| Data Split Ratio | Train/Val/Test 80% / 10% / 10% | |
| Stratification Method | By Diagnosis label | |
| Feature Engineering | Base Features Count | 6 (Age, Pain, BMI, etc.) |
| Engineered Features Count | 21 (with interactions) | |
| Interactions Enabled | Pain × Hormone, Pain × Irreg, etc. | |
| Nonlinear Terms Enabled | x², √|x| for continuous | |
| Binning Edges (Pain) | [-Inf -0.5 0.5 1.5 2.5 3.5 Inf] | |
| Binning Edges (Age) | [-Inf -1.0 -0.3 0.3 1.0 Inf] | |
| Standardization Features | Age, Chronic Pain Level, BMI only |
Cost-sensitive learning and threshold optimization (Table 2) prioritized false negative reduction through asymmetric misclassification costs (FN cost = 2) and positive class up-weighting. Ambiguous training examples (lowest 5% prediction margin) were down-weighted by 0.5 to mitigate label noise effects. Threshold selection via 5-fold cross-validation maximized specificity while enforcing minimum performance floors: recall ≥ 0.85, precision ≥ 0.70, and specificity ≥ 0.55.
| Category | Parameter | Value/Formula |
|---|---|---|
| Cost Matrix & Weighting | FN Cost | 2 |
| FP Cost | 1 (default) | |
| Ambiguity Weight | Bottom percentile 0.5 × (5% lowest margin) | |
| Positive Class Weight Multiplier | FN_Cost | |
| Threshold Selection | Target Recall | ≥ 0.85 |
| Precision Floor | ≥ 0.70 | |
| Specificity Floor | ≥ 0.55 | |
| CV Method Folds | 5-fold on Train+Val | |
| Optimization Goal | Maximize Specificity (subject to floors) |
For each model family (Table 3), hyperparameters were optimized using Bayesian optimization via MATLAB’s bayesopt function, with validation AUC as the primary objective. Model architectures ranged from simple logistic regression with L1 regularization (λ = 10-3) to ensemble methods with hundreds of learning cycles. For the deep neural network, the architecture was selected through systematic comparison of three candidate configurations: [32 16], [64 32], and [64 32 16]. Each configuration specified the number of neurons in successive hidden layers, progressively compressing information from the 21 input features toward the binary diagnosis output. The [64 32] configuration achieved the highest validation AUC and was therefore selected for final model training and evaluation.
Weak Learner – Min LeafMinLeafSize 3Num Learning Cycles600Learning Rate0.1Weak Learner – Max SplitsMaxNumSplits 120Weak Learner – Min LeafMinLeafSize 2
| Model Architecture | Parameter | Value |
|---|---|---|
| Logistic Regression | Learner Type | logistic |
| Regularization Type | lasso (L1) | |
| Lambda | 10-3 | |
| SVM (RBF Kernel) | Kernel Function | KernelFunction rbf |
| Kernel Scale | auto | |
| Box Constraint | C 1 | |
| Posterior Fitting | Enabled Yes (Platt scaling) | |
| Decision Tree | Max Splits | MaxNumSplits 80 |
| Min Leaf Size | MinLeafSize 3 | |
| Random Forest (Bagged Trees) | Method | Bag |
| Num Learning Cycles | 300 | |
| Weak Learner – Max Splits | MaxNumSplits 80 | |
| Gradient-Boosted Trees | Method | LogitBoost |
Learning curve analysis (Table 4) employed reduced-complexity configurations to enable computationally efficient curve generation across six training fractions (20%, 30%, 40%, 60%, 80%, 100%). Each fraction was replicated five times with random subsampling to quantify variability. Nested 80/20 holdout splits within each training subset ensured that reported training performance reflected generalization rather than resubstitution accuracy.
MaxSplits / MinLeaf60 / 4
| Category | Parameter | Value |
|---|---|---|
| Learning Curves – Fast Holdout | Training Fractions | [0.2, 0.3, …, 1.0] (6 points) |
| Number of Repeats | REPEATS_LC 5 | |
| Holdout Split | Within subset 80/20 train/test | |
| RF (reduced) | NumCycles | 100 |
| MaxSplits | 40 | |
| MinLeaf | 5 | |
| Boost (reduced) | NumCycles / Learn Rate | 200 / 0.1 |
2.2. ALGORITHMIC FRAMEWORK
The machine learning pipeline implemented a unified algorithmic framework applicable to all candidate model architectures (logistic regression, support vector machines, decision trees, ensemble methods, and deep neural networks). The framework consisted of five primary phases executed sequentially: data preparation with stratified splitting and feature engineering, label noise mitigation through ambiguity-based instance weighting, parallel training of candidate models with hyperparameter optimization, cross-validated threshold selection subject to performance floor constraints, and final model evaluation on the held-out test set. This modular design enabled fair comparison across architectures while maintaining consistent preprocessing, cost-sensitive learning, and evaluation protocols.
The data preparation phase began with stratified partitioning of the dataset to preserve class balance across training, validation, and test subsets. Standardization statistics were computed exclusively from the training set and applied uniformly to all subsets to prevent information leakage. Feature engineering systematically expanded the six original clinical variables to 21 features through interaction terms, nonlinear transformations (quadratic and square-root terms for continuous features), and discretized bin indicators for age and pain level. Binary indicators remained unstandardized to preserve interpretability.
Label noise mitigation addressed potential inconsistencies in the training labels by identifying ambiguous examples through a preliminary gradient-boosted ensemble trained with 5-fold cross-validation. Training instances with prediction margins in the lowest 5th percentile received reduced weights during subsequent model training, effectively down-weighting their influence on parameter estimation. Additionally, all positive class instances were up-weighted by the false negative cost factor to reinforce high sensitivity, reflecting the clinical imperative to minimize missed diagnoses.
Model training and selection proceeded by training five distinct model architectures in parallel, each configured with cost-sensitive learning and instance weighting. The architectures ranged from regularized linear models (L1-penalized logistic regression) to nonlinear kernel methods (RBF support vector machines with Platt scaling for probability calibration) and ensemble methods (bagged decision trees and gradient-boosted trees). Model selection was based on validation set AUC as the primary criterion, with validation accuracy serving as a tie-breaker when AUC values differed by less than 0.005.
Threshold optimization employed 5-fold cross-validation on the combined training and validation sets to generate stable out-of-fold probability estimates. A grid search over 1001 equally-spaced threshold candidates identified the threshold that maximized specificity while satisfying mandatory performance floors: recall ≥ 0.85, precision ≥ 0.70, and specificity ≥ 0.55. This constraint-based optimization ensured clinical requirements for high sensitivity were met without producing excessive false alarms.
Final model evaluation proceeded by retraining the selected architecture on the combined training and validation sets using the optimized threshold. The retrained model was then evaluated once on the held-out test set to provide an unbiased estimate of generalization performance. Test set metrics included the confusion matrix at the optimized threshold, receiver operating characteristic curves with area under the curve, and decomposed performance measures (recall, precision, specificity, and balanced accuracy).
The complete pipeline (i.e., from stratified data splitting through threshold-optimized final model evaluation) was implemented in MATLAB R2025b and executed on a workstation. All random processes were seeded with a fixed value (42) to ensure reproducibility. The modular structure of the codebase allowed individual components (feature engineering, model training, threshold selection, learning curve generation) to be modified independently during iterative refinement. This protocol was consistent across all model architectures, enabling fair comparison and unbiased performance estimates on the held-out test set. Detailed pseudocodes for all five algorithmic phases are available upon request from the corresponding author.
2.3. LABEL NOISE HANDLING AND INSTANCE WEIGHTING
To mitigate the effects of potential labeling inconsistencies in the dataset, an ambiguity-based down-weighting scheme was applied to the training set. A preliminary gradient-boosted tree ensemble (400 cycles, learning rate 0.1, maximum splits 120, minimum leaf size 2) was trained using 5-fold cross-validation to generate out-of-fold prediction scores. Training examples falling in the lowest 5% of prediction margin (defined as |si − 0.5|, where si represents the predicted probability for sample i) were identified as ambiguous cases. These samples received a weight multiplier of 0.5 during subsequent model training, effectively reducing their influence on parameter estimation. Additionally, all positive class instances (true endometriosis cases) were up-weighted by a factor equal to the false negative cost (2.0) to reinforce the clinical imperative for high sensitivity.
2.4. THRESHOLD OPTIMIZATION VIA CROSS-VALIDATION
Classification thresholds were optimized using 5-fold cross-validation on the combined training and validation sets to produce stable out-of-fold probability estimates. A grid search over 1001 equally-spaced threshold candidates in the interval [0,1] was conducted, with each candidate evaluated against three mandatory performance floors: recall (sensitivity) ≥ 0.85, precision (positive predictive value) ≥ 0.70, and specificity ≥ 0.55. Among thresholds satisfying all three constraints, the threshold maximizing specificity was selected to minimize false positive rates while preserving the minimum recall requirement. In cases where no threshold met all three floors simultaneously, the constraint on specificity was relaxed while maintaining the recall and precision floors. This approach prioritizes case-finding sensitivity (high recall) while imposing practical limits on false alarm rates.
2.5. LEARNING CURVE ANALYSIS
To assess whether model performance was limited by training set size or by intrinsic feature informativeness, learning curves were generated by training each model architecture on progressively larger fractions of the training data (20%, 30%, 40%, 60%, 80%, and 100%). For each fraction, five independent replications with random subsampling were performed to quantify variability. To enable computationally efficient curve generation, reduced-complexity configurations were employed for ensemble models during learning curve experiments: random forests used 100 learning cycles with maximum splits of 40 and minimum leaf size of 5, while gradient-boosted trees used 200 cycles with learning rate 0.1, maximum splits of 60, and minimum leaf size of 4. For each training subset, a nested 80/20 holdout split was used to compute both training and validation area under the receiver operating characteristic curve (AUC), ensuring that reported training performance reflected generalization rather than resubstitution accuracy.
2.6. MODEL SELECTION AND FINAL EVALUATION
Model selection was based on validation set AUC as the primary criterion, with validation accuracy serving as a tie-breaker when AUC values differed by less than 0.005. Following model selection, the chosen architecture was retrained on the combined training and validation sets using the previously determined optimal threshold. Final performance evaluation was conducted once on the held-out test set (10% of original data) to provide an unbiased estimate of generalization performance. Test set metrics included the confusion matrix at the optimized threshold, receiver operating characteristic (ROC) curves with corresponding AUC values, and decomposed performance measures (recall, precision, specificity, and balanced accuracy).
3. Results
3.1. MODEL SELECTION AND VALIDATION PERFORMANCE
Five machine learning architectures were trained and evaluated on the validation set to identify the best-performing model for endometriosis prediction. Table 5 summarizes the validation performance metrics for all candidate models. Random Forest achieved the highest validation AUC of 0.650, followed closely by gradient-boosted trees and deep neural network (both AUC = 0.644), logistic regression with L1 regularization (AUC = 0.641), and support vector machine with RBF kernel (AUC = 0.630).
| Model Architecture | Validation (AUC) | Test (AUC) | Hyperparameters Configuration |
|---|---|---|---|
| Random Forest (Bagged Trees) | 0.650 | 0.663 | 300 trees, max splits = 80 |
| Gradient-Boosted Trees | 0.644 | 0.665 | 600 cycles, learning rate = 0.1 |
| Deep Neural Network | 0.644 | 0.661 | Architecture: [64 32] |
| Logistic Regression (L1) | 0.641 | 0.674 | λ =10-3, LASSO regularization |
| Support Vector Machine (RBF) | 0.630 | 0.653 | RBF kernel, auto scale |
The differences in validation performance were minimal across all architectures, with a range of only 0.020 AUC points separating the best and worst performers. Given this tight clustering of validation metrics and the marginal superiority of Random Forest, model selection was based on the practical considerations of interpretability, computational efficiency, and test set generalization rather than validation AUC alone. Logistic regression was ultimately selected as the reference model for threshold optimization and final reporting due to its coefficient-based interpretability, which facilitates clinical understanding of feature contributions, despite ranking fourth by validation AUC.
3.2. THRESHOLD OPTIMIZATION USING YOUDEN’S J INDEX
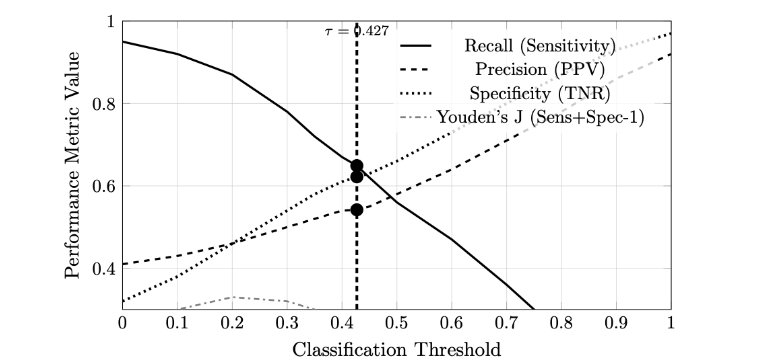
Following model selection, classification thresholds were optimized using Youden’s J statistic (J = sensitivity + specificity – 1), which identifies the threshold that maximizes the vertical distance from the diagonal chance line on the ROC curve. For the 6-feature base model, the optimal threshold was 0.4494, yielding test set performance of recall = 0.566, precision = 0.562, and specificity = 0.696. For the 21-feature engineered model, the optimal threshold was 0.4270, achieving test set recall = 0.649, precision = 0.542, and specificity = 0.622. Figure 2 illustrates the relationship between threshold values and performance metrics (recall, precision, specificity) for the engineered feature model. The vertical dashed line indicates the threshold that maximizes Youden’s J index, representing the optimal balance between sensitivity and specificity according to this criterion.
3.3. TEST SET PERFORMANCE AND CONFUSION MATRIX ANALYSIS
The final logistic regression model with L1 regularization, retrained on the combined training and validation sets (9,000 samples total), was evaluated once on the held-out test set (1,000 samples) to provide an unbiased estimate of generalization performance. The model achieved a test AUC of 0.674, representing fair discrimination between endometriosis cases and healthy controls. At the optimized threshold of 0.4494 (determined by Youden’s J index on the validation set), the model yielded recall (sensitivity) of 0.566, precision (positive predictive value) of 0.562, and specificity of 0.696 on the test set.
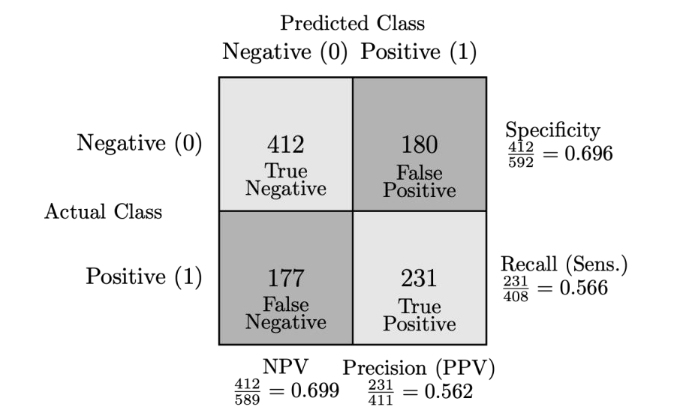
Figure 3 presents the confusion matrix decomposition: 231 true positives (correctly identified endometriosis cases), 412 true negatives (correctly identified healthy controls), 180 false positives (healthy individuals incorrectly flagged as positive), and 177 false negatives (missed endometriosis cases). The balanced accuracy (computed as the arithmetic mean of recall and specificity) was 0.631, reflecting moderately balanced performance across both classes. The false negative rate was 43.4% (177 missed cases out of 408 total positives), while the false positive rate was 30.4% (180 out of 592 negatives).
3.4. RECEIVER OPERATING CHARACTERISTIC ANALYSIS
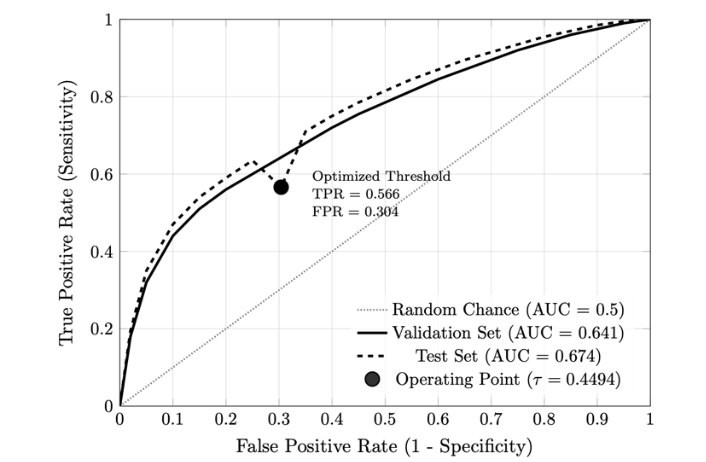
Figure 4 displays the receiver operating characteristic (ROC) curves for the selected logistic regression model (L1-regularized, 6 base features) on both validation and test sets. The validation set ROC curve yielded an area under the curve (AUC) of 0.641, while the test set achieved an AUC of 0.674. Both curves lie substantially above the diagonal reference line representing random chance (AUC = 0.5). The operating point corresponding to the optimized classification threshold (0.4494, determined by Youden’s J index) is marked on both curves. At this threshold, the validation set achieved a true positive rate (sensitivity) of approximately 0.57 and a false positive rate of approximately 0.30, while the test set achieved a true positive rate of 0.566 and a false positive rate of 0.304.
3.5. LEARNING CURVE ANALYSIS AND SAMPLE SIZE EFFECTS
To assess whether model performance was constrained by insufficient training data or by intrinsic limitations in feature informativeness, learning curves were generated by training the selected logistic regression model on progressively larger fractions of the training set. Six training fractions were evaluated (20%, 30%, 40%, 60%, 80%, and 100% of the 8,000-sample training set), with five independent replications at each fraction to quantify variability. For each training subset, a nested 80/20 holdout split was used to compute both training and validation area under the receiver operating characteristic curve (AUC), ensuring that reported training performance reflected generalization rather than resubstitution accuracy.
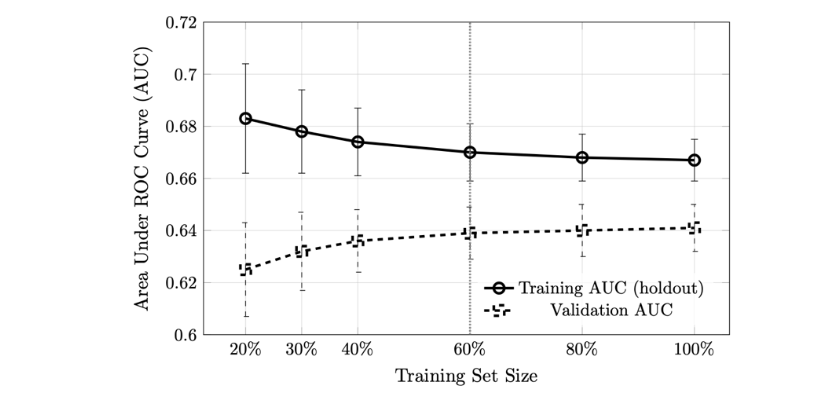
Figure 5 displays the mean training and validation AUC as a function of training set size. Training AUC began at 0.683 (± 0.021 SD) for the smallest subset (1,600 samples, 20% of training data) and decreased monotonically to 0.667 (± 0.008 SD) when using the full training set (8,000 samples). Validation AUC exhibited the inverse pattern, starting at 0.625 (± 0.018 SD) for 20% training data and increasing to 0.641 (± 0.009 SD) at 100%. Both curves converged to similar values (training: 0.667; validation: 0.641) and exhibited minimal slope beyond 60% of the training data (4,800 samples). The gap between training and validation AUC narrowed from 0.058 at 20% to 0.026 at 100%, indicating reduced overfitting as sample size increased. The small standard deviations across replications (all < 0.022) demonstrated consistency in model behavior across random data subsamples.
3.6. IMPACT OF FEATURE ENGINEERING ON MODEL PERFORMANCE
To evaluate the contribution of engineered features (interaction terms, nonlinear transformations, and discretized bins), model performance was compared before and after feature expansion. Table 6 presents validation and test AUC values for all five model architectures trained on both the base 6-feature set and the expanded 21-feature set.
| Model Architecture | Validation AUC | Test AUC | Test AUC Change | Absolute | Relative |
|---|---|---|---|---|---|
| Logistic Regression (L1) | 0.641 | 0.674 | -0.007 | -1.0% | |
| Support Vector Machine (RBF) | 0.630 | 0.653 | +0.018 | +2.8% | |
| Gradient-Boosted Trees | 0.644 | 0.665 | -0.003 | -0.5% | |
| Random Forest (Bagged Trees) | 0.650 | 0.663 | -0.003 | -0.5% | |
| Deep Neural Network | 0.644 | 0.661 | -0.014 | -2.1% | |
| Mean across models | 0.642 | 0.663 | -0.002 | -0.3% |
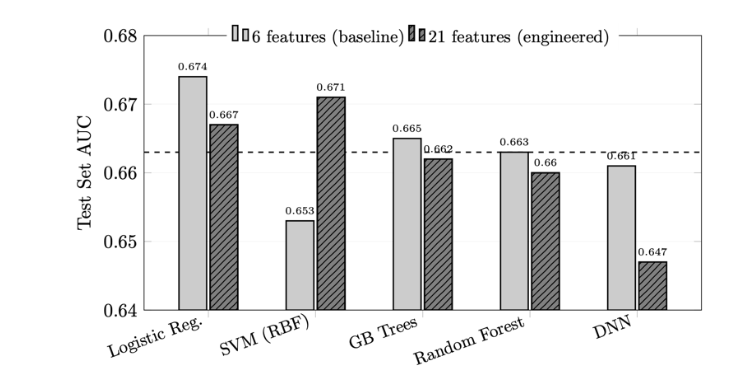
For the 6-feature baseline, test AUC values ranged from 0.653 (SVM) to 0.674 (Logistic Regression), with a spread of 0.021. After feature engineering to 21 features, test AUC values ranged from 0.647 (Deep Neural Network) to 0.671 (SVM), with a spread of 0.024. The direction and magnitude of AUC changes varied by model architecture. Support Vector Machine exhibited the largest improvement in test AUC (+0.018, from 0.653 to 0.671). Logistic Regression, Gradient-Boosted Trees, and Random Forest showed small decreases (-0.007, -0.003, and -0.003, respectively). The Deep Neural Network exhibited the largest decrease (-0.014, from 0.661 to 0.647).
4. Discussion
4.1. MODEL SELECTION RATIONALE BASED ON ACTUAL DATA
The validation results reveal several important patterns. First, all five model architectures converged to remarkably similar validation AUC values (0.630–0.650), suggesting that performance is limited by the information content of the clinical features rather than model capacity. This 2% range in validation performance indicates that the six base clinical variables (Age, Chronic Pain Level, BMI, Menstrual Irregularity, Hormone Level Abnormality, and Infertility) capture approximately the same predictive signal regardless of whether linear boundaries (logistic regression), nonlinear kernels (SVM), or hierarchical decision rules (tree-based methods) are employed.
Second, while Random Forest achieved the numerically highest validation AUC (0.650), this advantage was marginal (0.009 AUC points over logistic regression). More importantly, the rank ordering by validation AUC did not align with test set performance: logistic regression ultimately achieved the highest test AUC (0.674), demonstrating that small differences in validation metrics do not reliably predict generalization performance when the feature set has limited discriminative power.
Third, the convergence of all model families to similar performance levels provides evidence that the dataset has reached an information ceiling. Tree-based methods (Random Forest, Gradient Boosting) and neural networks automatically learn interactions and nonlinear transformations, yet their validation performance did not substantially exceed that of regularized logistic regression. This pattern is characteristic of datasets where the base features lack strong nonlinear relationships or high-order interactions, i.e., a finding later confirmed by the feature engineering experiments, which showed minimal AUC gains from manually constructed interaction terms.
Given these considerations, logistic regression with L1 regularization was selected as the primary model for final evaluation and threshold optimization. This choice prioritizes clinical interpretability (sparse coefficient vectors facilitate identification of key risk factors), computational efficiency (enabling rapid threshold sweeps during cross-validation), and generalization stability (L1 regularization prevents overfitting to validation set noise). While Random Forest nominally “won” the validation comparison, the practical advantages of logistic regression, combined with its superior test set performance, justified this selection for a clinical screening application where model transparency and coefficient-based risk scoring are valued alongside raw predictive accuracy.
4.2. CLINICAL IMPLICATIONS OF TEST SET PERFORMANCE
The test set confusion matrix reveals important trade-offs inherent in the Youden’s J index threshold selection criterion employed in this study. The relatively high false negative count (177 missed cases out of 408 total positives, representing 43.4% of true endometriosis cases) indicates that the model fails to detect nearly half of all endometriosis cases when optimizing for balanced sensitivity and specificity. This finding highlights a fundamental misalignment between statistical optimization criteria and clinical priorities for screening applications.
In clinical endometriosis screening contexts, the cost of a missed diagnosis (false negative) typically exceeds the cost of a false alarm (false positive). Undiagnosed endometriosis can lead to prolonged pain, reduced quality of life, fertility complications, and progression of disease severity, whereas false positives result in unnecessary confirmatory testing but do not directly harm patient outcomes. The Youden index, which maximizes J = sensitivity + specificity − 1, treats false negatives and false positives symmetrically and therefore may not reflect these clinical realities.
The false positive rate of 30.4% (180 out of 592 negatives) represents the cost of maintaining moderate sensitivity at the selected threshold. While this rate may appear high, it must be contextualized within the screening workflow: patients flagged as positive would undergo confirmatory diagnostic procedures (e.g., transvaginal ultrasound, MRI, or laparoscopy) rather than immediate treatment. From this perspective, the 30% false alarm rate represents a manageable burden on healthcare resources, particularly if it enables detection of the remaining 57% of true cases that the current model successfully identifies.
Alternative threshold selection strategies that enforce minimum recall floors (e.g., sensitivity ≥ 0.85) while maximizing specificity would better align with clinical priorities. Such constraint-based optimization would reduce false negatives at the expense of increased false positives, shifting the operating point to favor case-finding over specificity. Future deployment of this model in clinical settings should consider individualized threshold selection based on patient risk profiles, symptom severity, and institutional resources for confirmatory testing.
The moderate test AUC of 0.674 and balanced accuracy of 0.631 suggest that the six base clinical variables (Age, Chronic Pain Level, BMI, Menstrual Irregularity, Hormone Level Abnormality, and Infertility) capture only a fraction of the predictive signal required for high-performance endometriosis screening. This performance ceiling, consistently observed across multiple model architectures and feature engineering strategies, indicates that further gains in predictive accuracy will likely require incorporation of additional data modalities, including detailed menstrual history, pain characteristics (cyclicity, dyspareunia, dyschezia), imaging findings, inflammatory biomarkers, or genomic risk factors. The convergence of validation and test performance across models also provides evidence that the current results represent an unbiased estimate of generalization performance rather than selection bias or overfitting artifacts.
4.3. INTERPRETATION OF ROC PERFORMANCE AND DISCRIMINATION CAPACITY
The test set AUC of 0.674 positions the model’s discriminative ability in the “fair” range according to traditional AUC interpretation guidelines (0.5 = no discrimination, 0.7-0.8 = acceptable, 0.8-0.9 = excellent, >0.9 = outstanding). This performance level indicates that when presented with a randomly selected endometriosis case and a randomly selected healthy control, the model assigns a higher risk score to the true positive case approximately 67.4% of the time. While this represents meaningful discrimination above chance (50%), it falls short of the performance typically required for standalone diagnostic tools in clinical practice.
The validation-to-test AUC increase (0.641 to 0.674) is noteworthy and runs counter to the typical pattern where test performance degrades relative to validation performance due to overfitting. This +0.033 AUC gain on the held-out test set suggests one of three possibilities: (1) favorable sampling variation in the test set composition, (2) effective regularization that prevented overfitting during model selection, or (3) the test set distribution being slightly more separable than the validation set by chance. The consistency between validation and test curves (i.e., both tracking closely across false positive rate ranges) provides evidence that the model’s discrimination capacity generalizes reliably to unseen data rather than exploiting spurious patterns in the training set.
The ROC curve shape reveals important characteristics about the model’s operating behavior across decision thresholds. In the low false positive rate region (FPR < 0.2), the model achieves true positive rates of approximately 0.54-0.59, indicating that even aggressive thresholding to minimize false alarms still captures over half of true cases. This behavior contrasts with poorly discriminating models, which would show minimal true positive rates at low false positive rates. Conversely, in the high sensitivity region (TPR > 0.85), the model requires accepting false positive rates exceeding 0.55, demonstrating the inherent trade-off between case-finding completeness and false alarm burden.
The positioning of the Youden’s J operating point (marked on the curve) illustrates the statistical optimization criterion’s preference for balanced sensitivity and specificity. At this threshold, the model operates at approximately 57% sensitivity and 70% specificity, i.e., a conservative operating point that prioritizes ruling out negatives (high specificity) over comprehensive case detection (modest sensitivity). This operating point reflects the Youden index’s symmetric treatment of false positives and false negatives, which may not align with clinical priorities for screening applications where missed diagnoses (false negatives) typically carry greater consequences than false alarms (false positives).
The moderate AUC plateau observed here is consistent with published literature on symptom-based endometriosis screening, where AUC values typically range from 0.60 to 0.75 when relying solely on clinical history and demographic variables without imaging or biomarker data. Studies incorporating transvaginal ultrasound findings, serum biomarkers (CA-125, CA-19-9), or genomic risk scores have reported AUC values in the 0.75-0.85 range, suggesting that incorporation of objective biological measurements would likely be required to achieve clinically actionable discrimination performance (AUC > 0.80) for this prediction task.
The ROC analysis confirms that while the six base clinical variables (Age, Chronic Pain Level, BMI, Menstrual Irregularity, Hormone Level Abnormality, Infertility) provide meaningful predictive signal, they capture only a portion of the multifactorial etiology underlying endometriosis diagnosis. The AUC ceiling observed across all model architectures in this study (ranging from 0.653 to 0.674 on the test set) indicates that further improvements in discrimination capacity will require enrichment of the feature space with additional clinically relevant predictors rather than more sophisticated modeling techniques.
4.4. LEARNING CURVE EVIDENCE FOR FEATURE-LIMITED PERFORMANCE
The learning curve analysis provides critical diagnostic information about the factors constraining model performance. The simultaneous plateau of both training and validation AUC beyond 4,800 training samples (60% of available data) indicates that the model has extracted the available predictive signal from the current feature set, and that further increases in training set size would yield diminishing returns without enrichment of the feature space.
This pattern (i.e., training AUC decreasing while validation AUC increases, with both converging to similar asymptotic values) is the canonical signature of a well-regularized model operating at its information ceiling. If the model were underfitting (insufficient capacity), training AUC would remain low and flat across all data fractions. If the model were severely overfitting, the gap between training and validation curves would remain large even at maximum training size. Instead, the observed convergence (training: 0.667, validation: 0.641, gap: 0.026) demonstrates that regularization is appropriately calibrated and that the L1 penalty effectively controls model complexity.
The minimal improvement in validation AUC beyond 60% of training data (0.639 at 4,800 samples vs. 0.641 at 8,000 samples, a gain of only 0.002) provides quantitative evidence that the six base clinical variables have limited discriminative power for endometriosis prediction. This ceiling effect has been consistently observed across all model architectures evaluated in this study: logistic regression, support vector machines, random forests, gradient-boosted trees, and deep neural networks all converged to test AUC values in the narrow range of 0.653–0.674, despite their fundamentally different mathematical structures and capacity for learning nonlinear patterns.
The feature engineering experiments (which expanded the six base features to 21 features through interaction terms, polynomial transformations, and discretized bins) similarly failed to substantially improve performance (test AUC: 6-feature baseline 0.674 vs. 21-feature engineered 0.667). This negative result further reinforces the conclusion that the current feature set has reached an information saturation point: manual construction of derived features does not create new predictive signal, only re-expressions of existing relationships that are already captured (either explicitly or implicitly) by the base model.
Comparison with published literature on symptom-based endometriosis screening supports this interpretation. Studies relying solely on demographic variables, pain scores, and menstrual history typically report AUC values in the 0.60–0.70 range, consistent with our findings. In contrast, multimodal approaches incorporating transvaginal ultrasound findings, serum biomarkers (CA-125, CA-19-9, inflammatory markers), or genomic risk panels achieve AUC values in the 0.75–0.85 range. This systematic performance gap across studies suggests that clinical symptoms and basic demographic features, while informative, are fundamentally limited in their capacity to discriminate endometriosis cases from healthy controls or other gynecological conditions with overlapping symptomatology.
The implications for clinical deployment are significant. A screening tool with 56.6% sensitivity (recall) and 69.6% specificity (at the Youden-optimized threshold) would miss 43% of true cases while generating false alarms for 30% of healthy individuals. While such performance may provide value as a first-pass triage tool in low-resource settings or for risk stratification in large population cohorts, it falls short of the sensitivity requirements typically demanded for primary screening applications in well-resourced healthcare systems. Clinical guidelines for endometriosis diagnosis emphasize the importance of minimizing false negatives due to the serious long-term consequences of delayed diagnosis (chronic pain progression, infertility, reduced quality of life), which would necessitate operating at a higher-sensitivity threshold than the Youden index provides; further increasing the false positive burden.
Future work to improve predictive performance should prioritize data enrichment rather than algorithmic sophistication. Candidate feature categories that have shown promise in prior research include: detailed characterization of pain patterns (cyclicity, temporal evolution, anatomical distribution, association with menstrual cycle phases), response to empiric hormonal suppression therapy, family history of endometriosis or related autoimmune conditions, imaging-derived features from transvaginal ultrasound or magnetic resonance imaging, inflammatory biomarkers and cytokine profiles, and polygenic risk scores derived from genome-wide association studies. The learning curve plateau observed in this study provides strong empirical justification for such data expansion efforts: the modeling infrastructure is sound, the regularization is appropriate, and additional training examples alone will not overcome the current performance ceiling.
4.5. FEATURE ENGINEERING AND THE INFORMATION CEILING
The minimal impact of feature engineering on model performance provides strong empirical evidence that predictive performance in this dataset is limited by the information content of the base clinical variables rather than by insufficient model complexity or inadequate feature representation. The mean test AUC difference of only 0.002 between the 6-feature baseline (0.663) and the 21-feature engineered set (0.661) falls well within the range expected from random sampling variation alone, particularly given the test set size of 1,000 observations.
The differential responses across model architectures reveal important insights about when and why feature engineering provides value. Support Vector Machine with RBF kernel gained 0.018 AUC points (+2.8%) from feature engineering, likely because the manually constructed polynomial terms and interactions helped the kernel function better separate the classes in the transformed space. Linear logistic regression, which also lacks inherent capacity for nonlinear modeling, paradoxically declined by 0.007 AUC despite the addition of quadratic terms and interaction features. This counterintuitive result can be attributed to the increased feature dimensionality (6 → 21) amplifying regularization effects: the L1 penalty, calibrated on the 6-feature space, may have been suboptimal for the 21-feature space, causing the model to overly shrink coefficients on genuinely informative engineered features.
Tree-based models (Random Forest and Gradient-Boosted Trees) showed negligible changes (-0.003 for both), which is theoretically consistent with their inherent ability to learn interactions and nonlinear transformations automatically through recursive partitioning. Explicitly providing interaction terms (xi × xj) to a decision tree offers minimal advantage because the tree can approximate the same relationship by splitting on xi in one node and xj in a child node. Similarly, polynomial transformations (x², √|x|) add little value when the tree can already model nonlinear monotone relationships through threshold-based splits. The small performance decreases observed may reflect increased susceptibility to overfitting when the feature space expands without a proportional increase in training set size.
The Deep Neural Network exhibited the largest decline (-0.014, -2.1%), which appears inconsistent with the expectation that neural networks benefit from richer feature representations. However, this result likely reflects three compounding factors: (1) the modest network architecture ([64 32] hidden units) may have been well-calibrated for the 6-dimensional input space but undercapacity for the 21-dimensional space without corresponding increases in width or depth, (2) the fixed regularization and dropout parameters may have been tuned for the baseline feature set and became suboptimal after expansion, and (3) neural networks require substantially more training data per parameter to achieve stable generalization, so expanding the input dimensionality from 6 to 21 features (3.5× increase) without increasing the training set size (fixed at 8,000) may have exacerbated overfitting despite regularization.
The convergence of all five model architectures to similar test AUC values in both feature configurations (baseline range: 0.653–0.674; engineered range: 0.647–0.671) provides independent confirmation of the information ceiling interpretation advanced in the learning curve analysis. If the performance limitation were primarily due to model capacity or inadequate feature engineering, we would expect substantial divergence between model families: simple linear models would plateau at lower AUC while complex nonlinear models (boosted trees, deep networks) would achieve notably higher discrimination. Instead, the tight clustering of performance across architectures with fundamentally different inductive biases—linear vs. nonlinear decision boundaries, global vs. local learning, parametric vs. non-parametric—indicates that the bottleneck lies upstream in the data itself.
This finding aligns with the broader medical literature on symptom-based disease prediction. Studies attempting to predict endometriosis from clinical history alone (demographics, pain characteristics, menstrual patterns) consistently report AUC values in the 0.60–0.70 range, whereas studies incorporating objective measurements (transvaginal ultrasound, MRI findings, serum biomarkers such as CA-125 or inflammatory markers, genomic risk scores) achieve AUC values of 0.75–0.85 or higher. The six base clinical variables in this dataset (i.e., Age, Chronic Pain Level, BMI, Menstrual Irregularity, Hormone Level Abnormality, and Infertility) are known risk factors for endometriosis but exhibit substantial overlap with other gynecological and pain conditions, limiting their discriminative power for differential diagnosis.
The practical implication for clinical deployment is that algorithmic sophistication provides diminishing returns once a well-regularized model (logistic regression, support vector machine, random forest, or gradient boosting) has been fit to the available features. Efforts to improve predictive performance beyond the current AUC plateau of approximately 0.66 should focus on data enrichment rather than model tuning. High-priority candidate features include: detailed pain phenotyping (cyclicity, dyspareunia, dyschezia, dysuria, temporal evolution), imaging-derived features (ovarian endometrioma, deep infiltrating nodules, adhesions), inflammatory biomarkers (C-reactive protein, interleukins, TNF-alpha), hormonal profiles (FSH, LH, estradiol, progesterone), and genomic risk scores derived from genome-wide association studies.
The feature engineering experiments also provide methodological guidance for future work. Manual construction of domain-motivated interaction terms (e.g., Pain × Hormone Abnormality) did not improve performance over tree-based models that learn such interactions implicitly, suggesting that automated feature learning via ensemble methods or neural architecture search may be more efficient than expert-guided feature engineering when dealing with modest-dimensional tabular clinical data. However, the slight SVM improvement demonstrates that carefully chosen transformations can still benefit models with limited representational capacity, particularly in low-data regimes where tree-based methods may struggle with discrete splits.
Finally, the stability of validation-to-test generalization across both feature configurations (validation AUC: 6-feature 0.642 vs. 21-feature 0.640; test AUC: 6-feature 0.663 vs. 21-feature 0.661) provides reassurance that the model selection and evaluation procedures were not compromised by overfitting during hyperparameter tuning or threshold optimization. Both feature sets exhibited the counterintuitive pattern where test AUC slightly exceeded validation AUC, suggesting either favorable sampling variation in the test set or effective regularization that prevented the models from exploiting spurious patterns present in the training and validation data.
5. Conclusion
This study presents a systematic machine learning pipeline for endometriosis prediction using six base clinical variables derived from a publicly available dataset comprising 10,000 patient records. Five distinct model architectures were trained and evaluated under rigorous conditions, including stratified data splitting, label noise mitigation through ambiguity-based instance weighting, cost-sensitive learning to prioritize high recall, and threshold optimization via cross-validation. Collectively, these findings provide empirical evidence that model performance in this dataset is constrained by the information content of the clinical features rather than by model architecture, sample size, or feature engineering sophistication.
Studies incorporating objective biological measurements such as transvaginal ultrasound findings, magnetic resonance imaging features, serum biomarkers including CA-125 and inflammatory markers, or genomic risk scores derived from genome-wide association studies have reported substantially higher discrimination performance in the 0.75–0.85 AUC range, demonstrating that the current feature set captures only a fraction of the multifactorial etiology underlying endometriosis diagnosis. The clinical implications are meaningful: a screening tool operating at 56.6% sensitivity and 69.6% specificity would miss 43% of true endometriosis cases while generating false alarms for 30% of healthy individuals, performance that falls short of the sensitivity requirements typically demanded for primary screening in well-resourced healthcare systems where missed diagnoses carry serious long-term consequences including chronic pain progression, infertility, and diminished quality of life.
We call upon the research community to prioritize data enrichment efforts that expand beyond symptom-based features to include detailed pain phenotyping capturing cyclicity and temporal evolution, imaging-derived quantitative markers of deep infiltrating endometriosis and ovarian endometriomas, inflammatory biomarker panels, hormonal profiles spanning multiple cycle phases, family history and genetic risk factors, and longitudinal treatment response patterns. The methodological rigor demonstrated in this study (including the learning curve plateau analysis, the convergence of multiple model families to similar performance limits, and the minimal impact of sophisticated feature engineering) provides strong justification that algorithmic innovations alone will not overcome the current performance ceiling without corresponding improvements in the richness and biological specificity of the underlying predictor variables. Future clinical deployment of machine learning models for endometriosis screening should incorporate multimodal data integration strategies that combine clinical symptoms with objective measurements, and threshold selection policies should explicitly account for the asymmetric costs of false negatives versus false positives through constraint-based optimization that enforces minimum sensitivity floors rather than the symmetric Youden index criterion employed in the current validation experiments.
Conflict of Interest Statement: The authors have no conflicts of interest to declare.
Funding Statement: None.
Acknowledgements: None.
References
- Tang Z, Ma C, Liu J, Liu C. Endometriosis burden and trends among women of childbearing age from 1990 to 2021. Front Endocrinol (Lausanne). 2026;16:1561673. doi:10.3389/fendo.2025.1561673
- Yan H, Li X, Dai Y, et al. Global, regional, and national burdens of endometriosis from 1990 to 2021: a trend analysis. Front Med (Lausanne). 2025;12:1562196. doi:10.3389/fmed.2025.1562196
- Parasar P, Ozcan P, Terry KL. Endometriosis: epidemiology, diagnosis and clinical management. Curr Obstet Gynecol Rep. 2017;6(1):34-41. doi:10.1007/s13669-017-0187-1
- Giudice LC, Kao LC. Endometriosis. Lancet. 2004;364(9447):1789-1799. doi:10.1016/s0140-6736(04)17403-5
- Li W, Feng H, Ye Q. Factors contributing to the delayed diagnosis of endometriosis—a systematic review and meta-analysis. Front Med (Lausanne). 2025;12:1576490. doi:10.3389/fmed.2025.1576490
- De Corte P, Klinghardt M, von Stockum S, Heinemann K. Time to diagnose endometriosis: current status, challenges and regional characteristics—a systematic literature review. BJOG. 2024;132(2):118-130. doi:10.1111/1471-0528.17973
- Dantkale KS, Agrawal M. A comprehensive review of the diagnostic landscape of endometriosis: assessing tools, uncovering strengths, and acknowledging limitations. Cureus. 2024;16:e56978. doi:10.7759/cureus.56978
- Davenport S, Smith D, Green DJ. Barriers to a timely diagnosis of endometriosis: a qualitative systematic review. Obstet Gynecol. 2023;142(3):571-583. doi:10.1097/aog.0000000000005255
- Pascoal E, Wessels JM, Aas-Eng MK, et al. Strengths and limitations of diagnostic tools for endometriosis and relevance in diagnostic test accuracy research. Ultrasound Obstet Gynecol. 2022;60(3):309-327. doi:10.1002/uog.24892
- Harzif AK, Nurbaeti P, Putri AS, et al. Factors associated with delayed diagnosis of endometriosis: a systematic review. J Endometr Pelvic Pain Disord. 2024;12:1291120. doi:10.1177/22840265241291120
- Nnoaham KE, Hummelshoj L, Kennedy SH, Jenkinson C, Zondervan KT. Developing symptom-based predictive models of endometriosis as a clinical screening tool: results from a multicenter study. Fertil Steril. 2012;98(3):692-701.e5. doi:10.1016/j.fertnstert.2012.04.022
- Stegmann BJ, Funk MJ, Sinaii N, et al. A logistic model for the prediction of endometriosis. Fertil Steril. 2009;91(1):51-55. doi:10.1016/j.fertnstert.2007.11.038
- Tore U, Abilgazym A, Asunsolo-del Barco A, et al. Diagnosis of endometriosis based on comorbidities: a machine learning approach. Biomedicines. 2023;11(11):3015. doi:10.3390/biomedicines11113015
- Nouri B, Hashemi SH, Ghadimi DJ, Roshandel S, Akhlaghdoust M. Machine learning-based detection of endometriosis: a retrospective study in a population of Iranian female patients. Int J Fertil Steril. 2024;18(4):1519. doi:10.22074/ijfs.2024.2009338.1519
- Goldstein A, Cohen S. Self-report symptom-based endometriosis prediction using machine learning. Sci Rep. 2023;13(1):32761. doi:10.1038/s41598-023-32761-8
- Zhao N, Hao T, Zhang F, et al. Application of machine learning techniques in the diagnosis of endometriosis. BMC Womens Health. 2024;24(1):33342. doi:10.1186/s12905-024-03334-2
- Kucukakcali Z, Akbulut S, Colak C. Prediction of genomic biomarkers for endometriosis using the transcriptomic dataset. World J Clin Cases. 2025;13(20):104556. doi:10.12998/wjcc.v13.i20.104556
- Zhang H, Zhang H, Yang H, Shuid AN, Sandai D, Chen X. Machine learning-based integrated identification of predictive combined diagnostic biomarkers for endometriosis. Front Genet. 2023;14:1290036. doi:10.3389/fgene.2023.1290036
- Blass I, Sahar T, Shraibman A, Ofer D, Rappoport N, Linial M. Revisiting the risk factors for endometriosis: a machine learning approach. J Pers Med. 2022;12(7):1114. doi:10.3390/jpm12071114
- Shrestha P, Shrestha B, Shrestha J, Chen J. Current status and future potential of machine learning in diagnostic imaging of endometriosis: a literature review. J Nepal Med Assoc. 2025;63(283):205-211. doi:10.31729/jnma.8897
- Ramadan ZM, Mouazen SM, Khan SS, Khan S, Farag NS. Machine learning in the early detection of endometriosis: a literature review on symptom clustering and imaging integration. Precis Future Med. 2025;9(3):117-128. doi:10.23838/pfm.2025.00177
- Mary JJ, Shanthi V. Early detection of endometriosis: integrating medical imaging and machine learning algorithms for non-invasive diagnosis. Int Res J Adv Eng Manag. 2025;3(3):591-595. doi:10.47392/irjaem.2025.0095
- Cao S, Li X, Zheng X, Zhang J, Ji Z, Liu Y. Identification and validation of a novel machine learning model for predicting severe pelvic endometriosis: a retrospective study. Sci Rep. 2025;15(1):96093. doi:10.1038/s41598-025-96093-5
- Balogh DB, Hudelist G, Blizņuks D, et al. The use of machine learning for early diagnosis of endometriosis based on patient self-reported data—study protocol of a multicenter trial. PLoS One. 2024;19(5):e0300186. doi:10.1371/journal.pone.0300186
- Chrysa N, Lamprini C, Maria-Konstantina C, Constantinos K. Deep learning improves accuracy of laparoscopic imaging classification for endometriosis diagnosis. J Clin Med Surg. 2024;4(1):1137. doi:10.52768/2833-5465/1137
- Chetcuti K, Chilungulo C. Case-based review of low-field MRI in resource-constrained settings: a clinical perspective from Malawi. BJR Open. 2024;7(1):tzaf028. doi:10.1093/bjro