


Nutritional Comparison: Dairy Milk vs. Plant Beverages
A Nutritional and Environmental Impact Comparison of Skim Dairy Milk and Plant Beverages: A Review
Jim Painter, Ph.D., RDN¹
- Program Director, MS Integrative & Functional Medicine – Nutrition concentration
School of Integrative & Functional Medicine
OPEN ACCESS
PUBLISHED: 30 April 2025
CITATION: Painter, J., 2025. A Nutritional and Environmental Impact Comparison of Skim Dairy Milk and Plant Beverages: A Review. Medical Research Archives, [online] 13(4).
https://doi.org/10.18103/mra.v13i4.6498
COPYRIGHT: © 2025 European Society of Medicine. This is an open-access article distributed under the terms of the Creative Commons Attribution License, which permits unrestricted use, distribution, and reproduction in any medium, provided the original author and source are credited.
DOI https://doi.org/10.18103/mra.v13i4.6498
ISSN 2375-1924
Abstract
Plant beverages began to be used widely in the US in the 1970s, and their popularity has continued to grow. The growth of plant-based beverages has been driven by factors such as increased awareness of lactose intolerance, the rise of veganism, sustainability concerns, and innovations in taste. The nutrient density of beverages was not a significant factor in the decision to switch to plant-based beverages. This review compares skim milk to plant beverage alternatives due to a closer calorie comparison and examines their nutritional differences, highlighting their benefits and limitations. The protein content of most plant beverages is significantly lower than that of dairy milk. Skim milk provides approximately 3.3 grams of protein per 100 grams, making it a significant source of high-quality protein that contains all essential amino acids. On the other hand, plant beverages, while lower in protein content, offer a promising environmental advantage. Almond beverages contain 0.5 grams to 3.2 grams of protein per 100 grams, depending on the type of soy used. The Digestible Indispensable Amino Acid Score (DIAAS) for almond beverages scores 40 compared to 100 for dairy milk. The mineral content of plant beverages is generally lower than that of milk, except for calcium, which is often fortified to meet or exceed the levels found in dairy milk. The glycemic index of dairy milk is also low at 37 compared to plant beverages, ranging from 49 to 97. Studies show that producing one liter of dairy milk emits approximately 3.2 kg CO₂-equivalent, compared to 0.9 kg for soy beverages. In conclusion, dairy milk’s nutrient density per dollar spent is superior to plant-based alternatives. Research must continue for plant beverages to bring them up to the standard of milk yet they currently provide environmental advantages and a hopeful outlook for the future of sustainable nutrition.
Keywords
skim dairy milk, plant beverages, nutritional comparison, environmental impact, protein content, glycemic index
Introduction
Milk and its plant-based alternatives are integral to many diets in the United States, offering different nutritional benefits. Plant-based beverages are non-dairy alternatives made from plant sources and are often designed to mimic dairy milk in terms of appearance, mouthfeel, and functionality. This review compares skim milk to plant beverage alternatives, focusing on a closer calorie comparison. Soy beverages gained widespread use in the US in the 1970s and continued to grow in popularity through the 1990s. Almond beverages overtook soy beverages in popularity in the early 2010s due to its mild taste, lower calorie content, and heavy marketing from brands like Silk and Almond Breeze. By 2017, almond beverages accounted for about 66% of the U.S. plant-based beverage market. The late 2010s saw a significant surge in oat beverages’ popularity, led by brands such as Oatly. Oat beverage sales grew by over 300% in 2019 alone. The growth of plant beverages was driven by factors such as lactose intolerance awareness, veganism, sustainability concerns, and innovation in taste and texture. Still, the nutrient density of the beverages was not a significant purchase factor. By the 2020s, plant beverages became mainstream, with nearly every major grocery store and coffee shop offering multiple plant beverage options. The main plant beverages discussed in this paper are soy, oat, almond, and coconut. Both almond (1.5) and oat (.61) have passed soy beverage (.22) in sales,
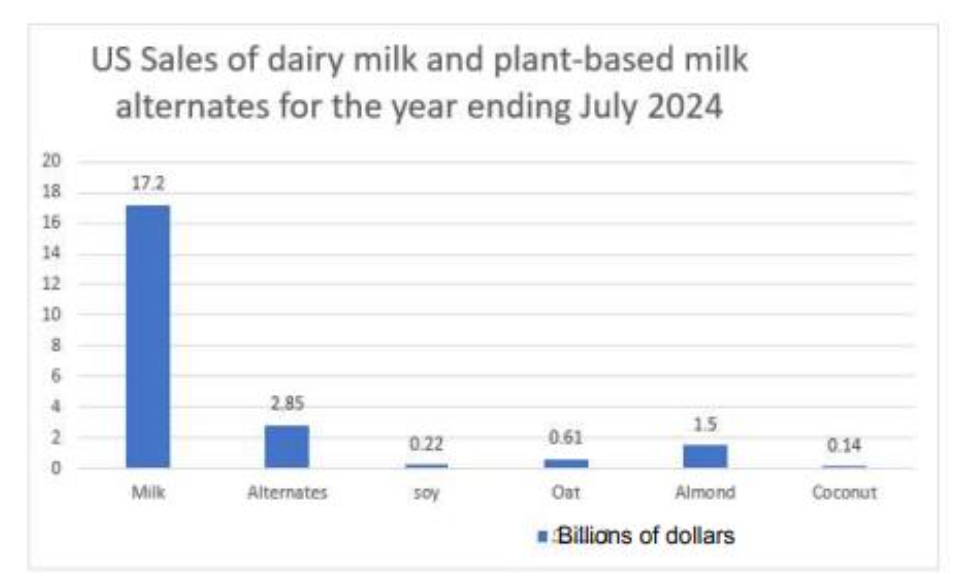
.
The United States Department of Agriculture’s (USDA) 2020-2025 Dietary Guidelines, nutrients of concern for Americans for underconsumption are calcium, potassium, vitamin D, and fiber. Dairy milk is an excellent source of calcium, vitamin D, and potassium, making it a convenient, whole-food source of these nutrients to increase consumption. Skim dairy milk also provides over 10% of the daily requirement for nine nutrients: protein, calcium, potassium, phosphorus, vitamin D, B12, niacin, riboflavin, and pantothenic acid. This review examines the nutritional differences between skim dairy milk and non-dairy plant beverages, highlighting their benefits and limitations and focusing on nutrients of concern for Americans.
Materials and methods
The researchers surveyed the refrigerated sections of 2 grocery stores in southern Texas. Products surveyed included non-flavored plant beverages and dairy milk. Google Scholar was used to conduct a nonsystematic literature review through December 2024. Searches utilized the following descriptors: milk, plant beverages, digestibility, glycemic index, vitamin D, nutrition, calcium, protein, price, carbohydrates, environmental impact, and market growth.
Nutritional Comparison
PROTEIN CONTENT
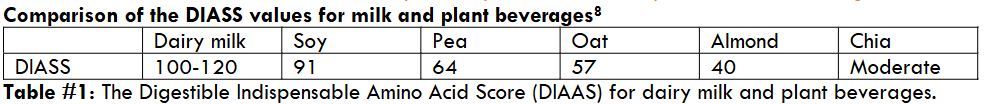
Skim dairy milk provides approximately 3.3 grams of protein per 100 grams, making it a significant source of high-quality, complete protein. In contrast, many plant beverages have lower protein content. For instance, almond beverages contain about 0.5 grams of protein per 100 grams, while oat beverages offer around 0.9 grams per 100 grams. Soy beverages are an exception among plant beverages, providing approximately 3.2 grams of protein per 100 grams, which closely matches that of skim dairy milk. In addition to being lower in quantity, plant alternatives are also lower in protein quality. The Digestible Indispensable Amino Acid Score (DIAAS) measures protein quality that considers the protein’s amino acid profile and digestibility. The almond beverage is of inferior quality, with a low DIASS score of 40 compared to 100 for dairy milk and less than one-quarter of the protein content of milk.
Soy is the only plant beverage close to dairy milk in protein content. It is the only plant beverage allowed in the School Lunch Program and the Women Infants and Children (WIC) programs as an acceptable substitute for dairy milk for children who cannot tolerate it.
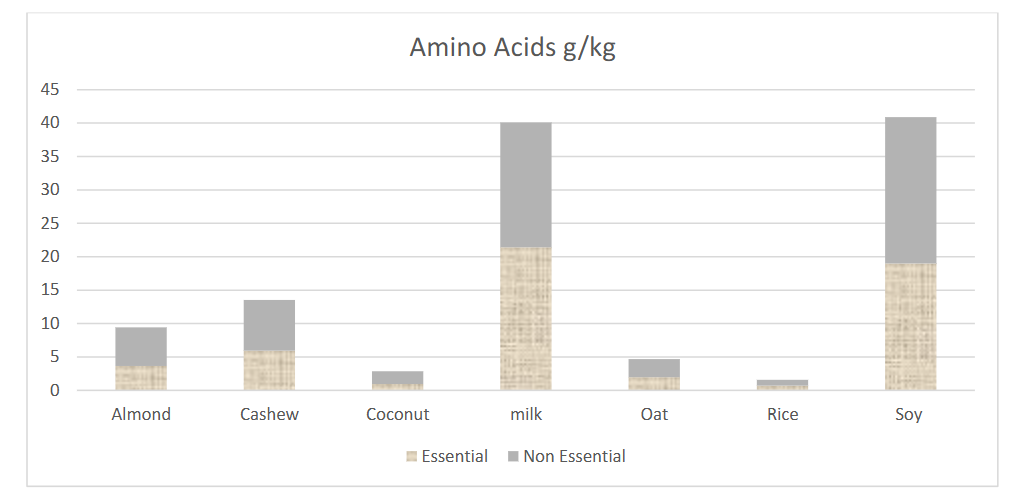
With a simple overview of each beverage’s essential and non-essential amino acids, almond beverages have less than 25% of the protein content in dairy milk. In comparison, coconut and rice beverages have less than 10% of the protein in dairy milk. Therefore, the percentage of protein in plant beverages is lower than in milk, and the protein quality is much less complete. Considering the low protein content of plant alternatives, the cost to consume the Recommended Daily Intake (RDI) for protein varies greatly: $3.77 for dairy milk, $28.36 for almond, $35.77 for coconut, $26.47 for oats, and $6.15 for soy. Dairy milk has more protein of better quality and is far less expensive than plant beverages.
Major mineral content in dairy milk and plant beverages
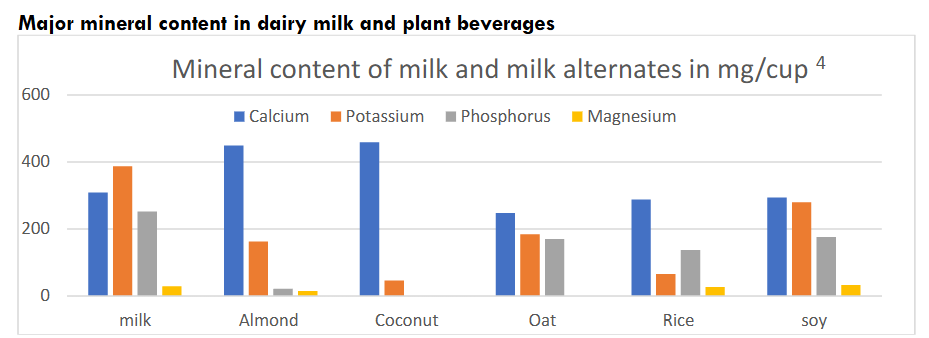
Figure 3 shows that dairy milk naturally contains about 120 milligrams of calcium per 100 grams, which is well absorbed by the body. Most plant beverages are fortified with calcium to match or exceed the levels found in dairy milk. However, the bioavailability of calcium in fortified plant beverages can vary, and some studies suggest that the body may not absorb all of the added calcium as efficiently as it does from dairy milk. The calcium in fortified soy and almond beverages may not be absorbed as readily as from milk due to the phytates and oxalates in plant beverages, which can inhibit calcium bioavailability. If the carton is not shaken well before serving, the calcium can precipitate out of the solution and remain on the bottom of the carton. Bioavailability also varies by type of calcium; tricalcium phosphate has a lower bioavailability, while calcium carbonate can have a similar bioavailability to the calcium naturally present in dairy milk. For potassium, only soy comes close to dairy milk content. Regarding magnesium content, rice and soy are comparable to dairy milk, while almond, coconut, and oat beverages contain less than half the magnesium of dairy milk.
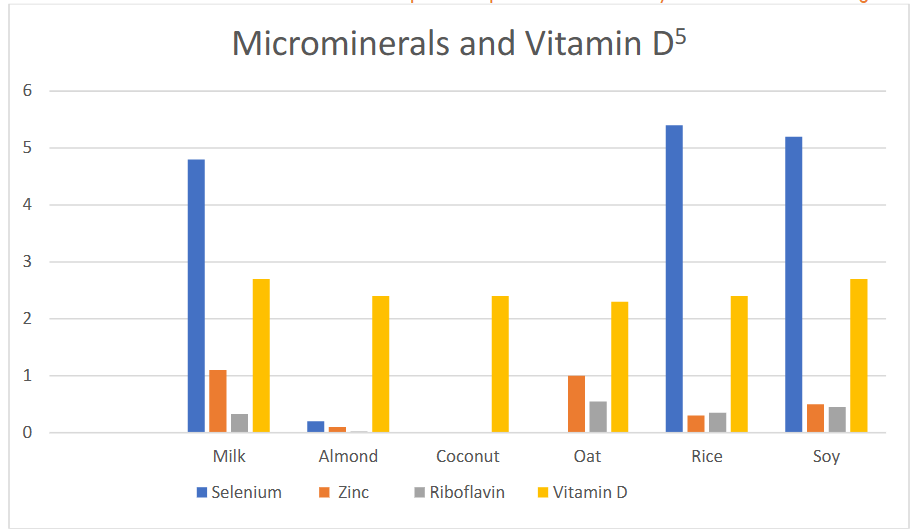
All beverages are fortified with similar amounts of vitamin D. Milk, rice, and soy have similar levels of selenium; the other three have little to none. Milk and oat have similar zinc levels; the other four have less than half. Milk, oat, rice, and soy have similar levels of riboflavin, while almond and coconut have none. Compared to the alternatives, none has the nutritional density of milk. Milk contains vitamin B12, whereas plant beverages do not; however, they are generally fortified to match the B12 content found in milk.
FAT CONTENT AND HEART HEALTH
Since the 1960s, there has been a recommendation to reduce full-fat dairy products because they were thought to contribute to heart disease. In the 1960s, Ancel Keys promoted the theory that dietary fat, particularly saturated fat and cholesterol, were central to the etiology of heart disease. He cited his seven-country study to prove his point. The validity of his study has been questioned, as there were 22 countries at the time, and he selected the seven that proved his point. When all 22 countries were included, fat was not associated with heart disease. The 2015-2020 Dietary Guidelines for Americans eliminated total dietary fat and cholesterol as potential risk factors for heart disease. Although saturated fat is still considered a risk factor for heart disease, several studies have assessed the role of saturated fat consumed in the context of dairy foods, and they don’t appear to be atherogenic when consumed as a component of dairy products. One research team found that full-fat dairy did not affect cardiometabolic disease markers. “Despite these caveats, currently, full-fat dairy foods milk, yogurt, and cheese are nutrient-rich and may be consumed without producing adverse effects on the risk of heart disease.” Therefore, full-fat dairy doesn’t present a risk for heart disease and can be consumed freely.
Skim dairy milk is a low-fat option containing less than 0.5 grams of fat per 100 grams. Plant beverages vary in fat content. Almond beverages typically have about 1 gram of fat per 100 grams, primarily heart-healthy unsaturated fats. Oat beverages contain around 1.5 grams of fat per 100 grams and also provide beta-glucans, which have been shown to support heart health.
CARBOHYDRATES AND SUGAR CONTENT
Oat beverages are higher in carbohydrates, with about 6.7 grams per 100 grams. Skim dairy milk contains approximately five grams of natural lactose per 100 grams. Almond drinks are lower in carbohydrates, typically around 0.3 grams per 100 grams. The type of beverage chosen for its low carbohydrate content is essential for those following a low-carbohydrate or low glycemic index (GI) diet. Dairy milk is the only beverage that has a low glycemic index. Soy beverages can have a low glycemic index, almond and oat beverages are medium, and rice and coconut are high. Milk’s low GI lactose sugar makes it a low glycemic index product. The plant alternates have a variety of sugars, including maltose, sucrose, dextrose, and glucose if they have added sugars.
| Item | Glycemic index Ranking |
|---|---|
| Dairy Milk | 39 Low |
| Skim Dairy milk | 37 Low |
| Soy beverage | 49-61 Low – Medium |
| Almond beverage | 49-58 Low – Medium |
| Coconut beverage | 97 High |
| Oat beverage | 59 Medium |
| Rice beverage | 97 High |
DIGESTIBILITY
Dairy milk contains lactose, which can be problematic for individuals with lactose intolerance. Plant beverages, such as almond and oat, offer lactose-free alternatives. However, consider nut allergies with almond beverages or gluten sensitivity with certain oat beverages. Considering the less-than-optimal nutrient density of plant beverages, a better option for lactose-intolerant individuals is lactose-free dairy milk. It still contains all the milk’s nutrients, but the added lactase enzyme breaks down the lactose into its component monosaccharides, glucose, and galactose. Unlike dairy milk, plant beverages contain dietary fiber but are not a good source as defined by the FDA. The food must contain 2.8 grams per serving to be a good source. Oat beverages contain approximately 0.8 grams of dietary fiber per 100 grams, almond 0.36, coconut 0.45, rice 0.09, and soy 0.72 grams per 100 grams of beverage.
ENVIRONMENTAL IMPACT
Dairy milk production has a significant environmental footprint. It requires more land, water, and feed resources than plant beverages while generating higher greenhouse gas (GHG) emissions. Studies show that producing one liter of dairy milk emits approximately 3.2 kg CO₂-equivalent, compared to 0.9 kg for soy beverages and 0.4 kilograms for oat beverages. Dairy farming is also associated with high water usage—628 liters per liter of milk, compared to 28 liters for soy beverages and 48 liters for oat beverages.
Plant beverages have a lower environmental impact, though variations exist. Almond drinks, for example, require significant water resources (up to 371 liters per liter), while rice beverages produce high methane emissions from paddy fields. Plant beverages are more sustainable than dairy milk but less nutrient-dense. However, before switching to plant alternatives to protect the environment, consider that dairy herds and products account for only 3-4% of the total greenhouse gases (GHG) produced globally. The largest producers of total GHG are electricity and heat (34%), transportation (15%), Industry (24%), and agriculture, forestry, and land (22%). Fossil fuels should be phased out for heating, cooling, and lighting homes, with a shift to solar and wind energy. Additionally, consider switching to electric vehicles for travel and ensuring that all purchases take into account the environmental impact during production.
If people want to add variety to their diet, they can choose plant beverages carefully to get the most nutrient-dense options. When considering the environment, it is essential to consider what we get when producing greenhouse gas emissions. Remember that dairy is a whole food with minimal processing that provides a nutrient-dense, good source of nine nutrients, as determined by the FDA. Plant beverages range from moderately to highly processed depending on the number and type of additives, thickeners, emulsifiers, artificial flavors, sweeteners, and oils.
Although overall milk production has increased by over 400% in the 53 years from 1970 to 2023, across all environmental metrics studied, intensities expressed per unit of fat and protein-corrected milk (FPCM) produced decreased from 25% to 75%. Totals from all dairy farms in the United States increased in NH3, CH4, and reactive non-CH4 VOC emissions. Total GHG emissions related to dairy farms have increased by just 14% with the 400% increase in production, while total fossil energy use has shown slight change, and nutrient losses to ground and surface waters have shown substantial improvements. The US dairy industry has been actively reducing its carbon footprint for many years. The Innovation Center for US Dairy launched the Net Zero Initiative (NZI) in 2021. The dairy industry has pledged to reach carbon neutrality by 2050.
MARKET GROWTH
Over the past several decades, the United States has experienced a notable decline in dairy milk consumption, accompanied by a significant increase in the consumption of plant beverage alternatives. Per capita consumption of fluid cow’s milk has been steadily decreasing. In 1975, the average American consumed approximately 1.25 cups of milk daily; by 2022, this had reduced by 47% to about 0.67 cups per day. This decreasing trend accelerated after 2010, with per capita availability declining at an average annual rate of nearly 2.5% between 2010 and 2017. Factors contributing to this decline include increased awareness of lactose intolerance and environmental concerns associated with dairy farming.
Conversely, plant beverages have gained substantial popularity. Between 2013 and 2017, household purchases of almond, soy, and other plant beverages increased by 36%, from 0.028 to 0.038 gallons per week. In 2025, almond beverages led the market, accounting for 74% of plant beverage sales; from 2018 to 2019, oat beverages increased by nearly 700%. Drivers of this growth include perceived health benefits, dietary preferences such as veganism, and the lower environmental impact of plant beverages compared to dairy. While plant beverages offer environmental advantages, their nutritional profiles can differ from dairy milk. It often requires fortification to reach the nutrient levels in milk, but even with fortification, it doesn’t restore all the lost nutrients. In summary, shifting consumer preferences, health considerations, and environmental awareness have collectively contributed to the decline in dairy milk consumption and the rise in plant beverage alternatives in the United States. If the health benefits of dairy milk were more widely known those consumers seeking health might change the current trajectory of beverage consumption.
Conclusion
Dairy milk’s nutrient density per dollar spent is superior to that of plant alternatives, while the plant alternatives offer more sustainable options with lower environmental footprints. Fortification makes plant-based alternatives more similar to dairy milk, particularly in terms of calcium and protein content. Future research should aim to optimize plant-based formulations to enhance bioavailability, nutrient absorption, and overall health benefits.
Skim dairy milk remains the only nutritionally dense option, particularly in terms of protein, potassium, and zinc content. Skim milk alone provides nine essential nutrients, over 10% of the daily value per serving. Plant-based beverages offer lower nutrient density but have several benefits. Oat beverage provides more carbohydrates and fiber, while almond beverage is lower in calories. Choosing the best option depends on individual health goals, dietary restrictions, and nutritional priorities. It’s essential to read labels carefully, especially regarding fortification and added sugars, to ensure consumers get what they expect. It isn’t just the flavored plant beverages but the plain beverages also contain added sugar. Milk is the best nutrient-dense beverage for at-risk populations, the elderly, growing children, and pregnant women.
References
- Mäkinen, O. E., Wanhalinna, V., Zannini, E., & Arendt, E. K. Foods for special dietary needs: Non-dairy plant-based milk substitutes and fermented dairy-type products. Critical Reviews in Food Science and Nutrition,(2016). 56(3), 339–349. http://dx.doi.org/10.1080/10408398.2012.761950
- Mintel. Non-dairy milk sales grow as consumers seek variety in plant-based diets. Retrieved from (2017). https://www.mintel.com
- Watson. E. Almond milk accounts for two-thirds of sales in the plant-based milk category, says WhiteWave Foods, 2014. Food Navigator. https://www.foodnavigator-usa.com/Article/2014/05/10/Almond-milk-accounts-for-two-thirds-of-sales-in-plant-based-milk-category-says-WhiteWave-Foods/
- Ritchie, H. Environmental impacts of food production. Our World in Data (2018). https://ourworldindata.org/environmental-impacts-of-food
- Dietary Guidelines Advisory Committee, HHS, Office of Disease Prevention, Health Promotion (US), USDA, Center for Nutrition Policy Promotion (US). Dietary Guidelines for Americans 2020-2025. Government Printing Office; 2015.
- Watson E. US retail sales of plant-based milk by numbers Coconut is up, almond is down, soy and oat are flat. AgFunderNews 2024, 8. https://agfundernews.com/us-retail-sales-of-plant-based-milk-by-numbers-coconut-is-up-almond-is-down-soy-and-oat-are-flat
- Smith NW, Dave AC, Hill JP, McNabb WC. Nutritional assessment of plant-based beverages in comparison to bovine milk. Frontiers in Nutrition. 2022;9. doi: https://doi.org/10.3389/fnut.2022.957486
- Karoui R, Bouaicha I. A review on nutritional quality of animal and plant-based milk alternatives: a focus on protein. Front Nutr. 2024; 11. 1378556. doi: 10.3389/fnut.2024.1378556. PMID: 39036491; PMCID: PMC11259050
- Smith N. Nutritional assessment of plant-based beverages compared to bovine milk. Frontiers, 2022; 9. https://doi.org/10.3389/fnut.2022.957486
- Ramsing R, Santo R, Kim BF, Altema-Johnson D, Wooden A, Chang KB, Semba RD, Love DC. Dairy and Plant-Based Milks: Implications for Nutrition and Planetary Health. Curr Environ Health Rep. 2023;10(3):291-302. doi: 10.1007/s40572-023-00400-z. Epub 2023 June 10. PMID: 37300651; PMCID: PMC10504201.
- Weiss C. Mayo Clinic Q and A: Comparing dairy milk and plant-based beverages. Mayo Clinic News Network. 2020. https://newsnetwork.mayoclinic.org/discussion/mayo-clinic-q-and-a-comparing-dairy-milk-and-plant-based-beverages/
- Burrows, A. Bioavailability of calcium and calcium content in plant-based milk substitutes and cow’s milk: a systematic review. Viterbo Research Collection, 2023. https://viterbo.contentdm.oclc.org/digital/collection/src/id/127952
- Katherine D Pett, Walter C Willett, Erkki Vartiainen, David L Katz, The Seven Countries Study, European Heart Journal, Volume 38, Issue 42, 07 November 2017, Pages 3119–3121, https://doi.org/10.1093/eurheartj/ehx603
- Yerushalmy J, Hilleboe HE. Fat in the diet and mortality from heart disease; a methodologic note. N Y State J Med. 1957; 14:2343-54. PMID: 13441073.
- Dietary Guidelines Advisory Committee, HHS, Office of Disease Prevention, Health Promotion (US), USDA, Center for Nutrition Policy Promotion (US). Dietary Guidelines for Americans 2015-2020. Government Printing Office; 2015.
- Hirahatake, K. Astrup, A, O Hill J, Slavin J, Allison D, Maki K. Potential Cardiometabolic Health Benefits of Full-Fat Dairy: The Evidence Base, Advances in Nutrition. 2020;11(3): 533-547. ISSN 2161-8313, https://doi.org/10.1093/advances/nmz132
- Shkembi B, Huppertz T. Glycemic Responses of Milk and Plant-Based Drinks: Food Matrix Effects. Foods. 2023;12(3):453. doi: 10.3390/foods12030453. PMID: 36765982; PMCID: PMC9914410.
- Poore, J., & Nemecek, T. Reducing food’s environmental impacts through producers and consumers. Science, 2018. 360(6392), 987-992.
- Mekonnen, M. M., & Hoekstra, A. Y. Water Footprint of Farm Animals and Animal Products. Ecosystems. 2012;15: 401–415. https://doi.org/10.1007/s10021-011-9517-82012
- Khanal B, Lopez R. Demand for Plant-Based Beverages and Competition in Fluid Milk Markets. AgEcon Search, 2021.
- Emissions Trends and Drivers. In IPCC, 2022: Climate Change 2022: Mitigation of Climate Change. Contribution of Working Group III to the Sixth Assessment Report of the Intergovernmental Panel on Climate Change. Cambridge University Press, Cambridge, UK and New York, NY, USA. doi: 10.1017/9781009157926.004
- Rotz CA, Beegle B, Bernar JK, LeytemA, FeyereisenG, Hagevoort R, Harrison J, Aksland G, Thoma G. Fifty years of environmental progress for United States dairy farms, Journal of Dairy Science, 2014; 107 (6) 3651 – 3668. https://www.journalofdairyscience.org/article/S0022-0302(24)00010-9/fulltext
- Hand T, Etienne X, Tejeda H, Trujillo-Barrera A. Net Zero by 2050: US Dairy’s Climate Pledge and Lessons from Idaho. Choices Magazine, 2024,39 (4).
- Kuchler F and Stewart H. Fluid Milk Consumption Continues Downward Trend, Proving Difficult to Reverse. Amber Waves, Economic Research Service, 2022, 6. https://www.ers.usda.gov/amber-waves/2022/june/fluid-milk-consumption-continues-downward-trend-proving-difficult-to-reverse
- Stewart, H., Kuchler, F., Cessna, J. & Hahn, W. Are Plant-Based Analogues Replacing Cow’s Milk in the American Diet? Journal of Agricultural and Applied Economics, 2020. doi:10.1017/aae.2020.16.
- Walther, B., Guggisberg, D., Badertscher, R., Egger, L., Portmann, R., Dubois, S., Haldimann, M., Rhyn, P., Zoller, O., Veraguth, R., & Rezzi, S. Comparison of nutritional composition between plant-based drinks and cow’s milk. (2022) Frontiers in Nutrition, 9, 988707. https://doi.org/10.3389/fnut.2022.988707