

Perceived Learning Difficulties and School Burnout in Youth
Perceived learning difficulties, school burnout and digital addiction of students in grades 6 to 12
Introduction
Since 2010, Estonian schools have been gradually moving towards an inclusive education policy³⁸, and this is now a guiding principle in Estonian education. With inclusion, at least 80% of learning takes place in mainstream classrooms. This means that included learners can also include partial learning in a special class¹¹. While after the restoration of Estonia’s independence in the 1990s and 2000s, students with special needs, often including those with learning difficulties, were placed in special classes or schools, today they remain predominantly in mainstream classes in regular schools. Students with learning difficulties are primarily targeted by general support measures, but also by enhanced support measures in the case of more persistent difficulties¹⁰–²⁹. In Estonia, it is well known how many students have registered special educational needs. Students’ additional support needs and special needs are registered in the Estonian Education Information System². As in other countries¹⁹, learning difficulties have been the most common special educational need in Estonia²⁷,⁴⁹.
The way students perceive, and value themselves has a significant impact on their sense of well-being and overall coping. Although knowledge of the cognitive and social components of learning difficulties has increased over time, there has been an equal lack of attention to how students themselves perceive their difficulties and special needs⁴⁴. Students’ self-perceived learning difficulties and coping in an inclusive learning environment have not been adequately studied in Estonia or elsewhere in the world. However, expectations for schools and teachers in implementing inclusive education are high. Teachers’ attitudes towards and evaluations of inclusive education have been repeatedly studied in Estonia²⁰,⁴⁵,²⁶,⁵². It is often perceived that teacher preparation is not sufficient to teach children with very different abilities together, and there is a shortage of support specialists, assistant teachers and support workers in schools¹³. Students whose learning difficulties are not noticed and diagnosed also do not receive the support they need⁹. The Perceived Learning Difficulties Scale offers an additional way to find out how students rate their own learning coping and difficulties.
Learning difficulties as a construct
The definition of learning difficulties largely overlaps with the definition of specific learning disorder used in the International Classification of Learning Disabilities²¹. Learning difficulties is an umbrella term that can include one or more specific difficulties but can also be associated with attention deficit and/or hyperactivity, Asperger syndrome or specific language impairment³².
Learning difficulties border on intellectual disabilities²⁷. In Estonia, children with cognitive abilities below the age-appropriate level, i.e. with intellectual disabilities, are not counted as students with learning difficulties. However, there are countries where even less pronounced intellectual disabilities are classified as learning difficulties¹⁴.
Research on learning difficulties focuses mainly on differences in cognitive development among students³⁹. Disorders that have their origins at the biological level have an impact on the development of cognitive processes¹⁵,¹⁸, and this is noticeable in learning performance⁴⁰. As is the case with special educational needs more broadly⁴⁴, students with learning difficulties find it difficult to cope with learning as successfully or independently as their peers. It is this lower performance in relation to their peers that is the basis for schools’ identification of students with learning difficulties¹⁰.
Children with learning difficulties have weaknesses or deficits in both perceptual and memory development compared to children of age-appropriate development¹. Learning difficulties are manifested in the areas of oral and written language, reasoning and recall skills, information structuring and numeracy⁷. Often, the features of several specific learning difficulties are similar or overlapping³². Those students who experience difficulties in reading often also perceive difficulties in writing and numeracy. Schulte et al.⁴⁹ also point out that students with learning difficulties
learning difficulties have impaired reading, spelling and/or numeracy skills. Most students with learning difficulties have problems acquiring reading skills at age-appropriate levels²⁷,³¹.
Students with reading difficulties find it difficult to read texts at the same pace as their peers and may not be able to comprehend the content of what they read due to low reading skills³¹. In school, children with a learning difficulty may find it difficult to comprehend educational texts, which can often contain complex concepts and facts that are difficult for students to relate to their emotions, values and prior knowledge³⁰. Most students with reading difficulties can read fluently in the third grade of primary school but have difficulties in comprehending what they read at an age-appropriate level and in retrieving, interpreting, inferring and generalising information from the text⁵⁴.
Students with learning difficulties need significantly more support to cope with their learning compared to their peers of an age-appropriate development. Students who need additional support have insufficient learning competences. Difficulties arise in planning time, completing tasks on time and solving tasks independently. Students’ lack of self-management of their learning process is a barrier to progress. Because of the lack of independent work skills, there is a greater need for additional support at home⁵. Environmental factors influence the emergence and depth of difficulties¹⁵. In the distance learning periods implemented due to COVID-19, it was also found that greater difficulties were experienced by students who needed extra support at school⁵⁷. At the same time, some of the respondents with learning difficulties appreciated that distance learning allowed them to learn at their own pace and plan their own time²⁸.
Different data show that learning difficulties are more widespread among boys²⁷. Across European countries, there is a clear pattern of a much higher proportion of boys with special educational needs than girls⁴³. In Estonian education statistics, boys are also significantly more likely to have special educational needs than girls²². At the same time, other studies have shown that reading difficulties occur equally often in boys and girls. Throughout the school years, girls on average score higher on reading tests, while boys’ difficulties are more profound⁴. As a result, many girls with learning difficulties may be unidentified and unsupported by special education².
In the academic year 2021/22, 69,685 students were studying in Estonian-taught grades 6–12 in Estonia, 59,014 of them in regular education. In schools, 22% of 6th grade students, 21% of 7th grade students, 22% of 8th grade students, 22% of 9th grade students, 2% of 10th grade students, 3% of 11th grade students and 4% of 12th grade students are recorded in the Estonian Education Information System (EHIS) as receiving additional support. More than half of students needing support at school have a diagnosed learning difficulty. These include specific, temporary and permanent learning difficulties³². In the 2021/22 school year, temporary learning difficulties were recorded in all grades. According to the EHIS, this type of learning difficulties was most prevalent in upper secondary school (grades 10–12). In primary school (grades 6 to 9), numeracy, reading and writing difficulties were recorded more than temporary learning difficulties. An interesting trend was observed in the 2021/22 school year in the recording of learning difficulties in upper secondary grades. Few of them were recorded in grade 10, while by grade 12 the prevalence of all learning difficulties increased significantly³⁷. In summary, however, learning difficulties in upper secondary students were formally recorded at a rather low rate, a similar trend was also observed in the formal assignment of general, enhanced and special support at upper secondary level⁵².
Previous studies on students with learning difficulties’ self-evaluation of their coping abilities
Research that distinguishes students with learning difficulties from students with age-appropriate development uses a variety of instruments: tests, skill lists, interviews and observations³³–³⁶. In previous studies that have analysed the performance and learning assessments of students with learning difficulties, clinical diagnoses have predominantly been used as a basis for identifying participants with learning difficulties⁵,⁶,¹⁶,¹⁷,⁴²,⁴⁶,⁶²,⁶³, or have included students with low scores on tests of learning competences². However, there has been little research on students’ own perceptions of their learning difficulties. In some of the studies, the focus has been on academic achievement and self-concept of ability. Students’ self-concept includes social, physical and academic self-concept⁵³,⁵⁹,⁶³. Thereby, students’ subject-specific self-concept in reading, mathematics, and other subjects belong to a broader academic self-concept⁵⁹.
Academic self-concept is positively correlated with students’ academic performance in reading and mathematics¹⁷. Cheng et al. have found that the self-concept of students diagnosed with learning difficulties correlates positively with both self-concept and academic achievement. Self-concept and self-perception of students with learning difficulties are positively related to academic achievement and are also predictors of academic achievement and predictors of success in reading and mathematics⁶³. Research¹⁷,³⁴,⁶² suggests that students diagnosed with learning difficulties have lower ratings of their academic performance than their peers. A strong correlation has been found between academic self-concept and academic achievement.
Heyman’s Self-Perception of One’s Learning Disability (SPLD) scale⁴⁴, which consists of 25 items, has been used previously to investigate learning assessments of students with learning difficulties and age-appropriate academic performance. The scale included positive and negative statements such as: “I always need extra help with schoolwork” or “I have few friends because I need extra help at school”. In their findings, Rothman and Cosden⁴⁴ report that students who gave fewer negative ratings of their academic performance achieved higher academic performance in mathematics compared to those who perceived more negative aspects of learning difficulties. Students with learning difficulties who received more help from parents and peers in their learning had fewer negative perceptions of learning difficulties. Those with fewer negative views of their learning difficulties had higher beliefs about their own abilities, were more socially accepted and perceived more support from their parents and classmates. Those with fewer perceived learning difficulties had higher overall mental ability, higher self-esteem, higher perceived writing ability, were more socially accepted.
Morgan and Klein also emphasise that to develop positive self-esteem, it is necessary to recognise and diagnose learning difficulties in childhood and to provide support for the child at school and at home⁴¹. Childhood feelings of being perceived as “stupid” often ensure the development of persistently low self-esteem⁴¹. At the same time, students’ self-esteem is a predictor of their future academic success¹.
Varik-Maasik⁶¹ has investigated young people in Estonia’s assessments of learning difficulties in school and adulthood. There was a statistically significant correlation between perceived reading, writing and numeracy difficulties both at school and in the post-school period. Young people who rated themselves as struggling readers also had lower reading test scores⁶⁰,⁶¹.
School-related burnout and digital addiction linked to learning difficulties
The psychological well-being of children with learning difficulties is lower than that of their non-disabled peers⁵⁰,⁵¹,⁵². Students with learning difficulties are less socially accepted, have fewer friendships and are more often victims of bullying⁶².
Students diagnosed with learning difficulties have higher levels of anxiety and depression compared
to their peers, in addition to lower academic performance²⁵,⁴⁵,⁵⁵,⁶². Constant perceptions of school-related stress can lead to burnout⁴⁷. Burnout has also been defined as a psychosocial condition characterised by mental and emotional fatigue, cynicism, lack of motivation and a sense of underachievement⁷. School-related burnout refers to a lack of well-being in an academic context⁷. School-related burnout can also be defined as a sense of school-related overload, more specifically as chronic fatigue resulting from excessive schoolwork. For students, it starts with the constant stress associated with school, which can eventually lead to burnout⁴⁷. School-related burnout can be a consequence of long-lasting academic difficulties⁵. When students feel constant pressure and anxiety due to schoolwork, this can lead to school-related burnout⁴⁷. A study by Stepanova⁵⁵ found that girls with learning difficulties had a statistically significantly higher rate of school-related burnout than boys. Girls worried more about schoolwork and perceived more stress due to different school tasks⁵⁵. In contrast, in Peltg’s⁴² study, it was boys with diagnosed learning disabilities who had lower mental health indicators and higher levels of anxiety than girls with the same diagnosis.
Digital addiction often seems to co-occur with other mental health problems, but the question of whether digital addiction is a cause or a consequence, whether it is a symptom, or a coping mechanism linked to a health problem, is still topical³. The concept of digital addiction is broad and encompasses the compulsive use of various digital tools⁵⁰. Karošse, Tülbārs and Papadakis²³ used the term “digital addiction” as an umbrella term that includes internet addiction, smartphone addiction, social media addiction, video game addiction and other addictions related to digital devices. As more and more digital tools are being produced, a generic approach to digital tools is useful to understand the compulsive behaviours associated with them. Digital addiction is not yet a formal diagnosis but is an area of international research. Living in a digitally rich environment, digital addiction is a problem that tends to be denied and is difficult to define and measure, as the digital time alone is not enough to define digital addiction. Digital addiction occurs when the use of digital tools has become pervasive and interferes with learning and other important things, and a person’s health suffers as a result⁵⁰.
A Finnish study⁴⁸ showed that school-related burnout predicts internet addiction. A screening of Estonian teenagers⁵¹ found that 18.5% of teenagers self-identify as experiencing a significant degree of school-related burnout and at the same time have learning difficulties and symptoms of digital addiction. Those young people with high levels of digital addiction symptoms use digital tools more than others – they spend an average of five hours on digital tools before and after school on a school day and an average of seven hours on a non-school day. In contrast, teenagers who self-report low levels of digital media use did not experience perceived learning difficulties or school-related burnout.
Research objectives and research questions
The aim of this study is to find out the internal consistency of the Perceived Learning Difficulties Scale between the perceived learning difficulties items scores, how students in grades 6–12 perceive the learning difficulties, and how perceived learning difficulties are related to burnout and digital addiction.
The article seeks answers to the research questions:
-
What is the internal consistency of the items of the Perceived Learning Difficulties Scale?
-
How do students in grades 6–12 perceive the characteristics of learning difficulties?
-
What are the gender differences in the perception of learning difficulties?
-
What is the relationship between students’ perceived learning difficulties related to burnout and digital addiction?
Sample and procedure
Tallinn University’s Centre for Educational Innovation (CIE) has been conducting school surveys since 2016. The research has focused on students’ attitudes towards learning and school life; perceptions of teaching methods; learning skills, learning difficulties and need for additional support in learning; well-being and mental health; bullying, digital use and addiction; and in Estonian school life. From 7 January to 28 February 2022, CIE conducted the Student Survey 2022. Participation in the survey was optional for schools, and all Estonian schools eager to take part and compare themselves with others were invited. An internet-based survey was conducted among students in grades 6–12. The research was performed using the Qualtrics survey environment. To participate in the survey, each school was sent a link to an individual questionnaire, which took approximately 20–40 minutes to complete. Students answered the questionnaire independently. No additional help was provided to understand the questions or statements. The data were collected in accordance with the principles of scientific ethics. The students remained anonymous, and their responses will be used as a generalisation for primary and/or secondary school students.
The study included school students from all over Estonia. In 2022, a total of 9,259 students responded to the questionnaire (8,415 to the Estonian version and 844 to the Russian version)⁶. The sampling requirements were based on the total number of students in the respective education levels in grades 6–9 and 10–12. Depending on the total number of students, participation requirements ranged from 40% to 90%. If a participating school had enough respondents (meeting the sampling requirements), its results were included in the unified database. The data included in the database were checked and cleaned. In total, the data of 245 students were excluded from the analysis because they had left many questions unanswered or had provided illogical responses to open-ended questions.
In our article, we use the data from 8,170 students who responded to the Estonian version of the questionnaire. The students were aged 11–20 years. Students could indicate their gender as follows: male (3,621, 44.3%), female (4,136, 50.6%), prefer not to say/other. The last option was selected by 413 participants (5.1%).
Data collection instruments
The **Perceived Learning Difficulties Scale (PLDS)**⁵¹ was used to assess perceived learning difficulties. The scale has been developed considering the nature and manifestation of learning difficulties by Ene Varik-Maasik. The statements of the PLDS were created focusing on the conditions that students with learning difficulties most often experience at school²⁷,³⁰,³¹,⁵⁴: perceived more difficulty in learning than peers; difficulty in understanding the meaning of texts; working at a different pace than peers; taking more time to understand what is being taught; low academic achievement; need for help with homework. The formulation of the statements has considered factors that affect the comprehensibility of the text³⁵,³⁶. Long sentences, complex sentence constructions and words with infrequent or abstract meanings were avoided. The scale was tested in a pilot study in autumn 2021. A scale consisting of six statements was used to collect data (Appendix 1). Students were asked to rate how often they had experienced difficulties in learning during the school year. Participants were asked to rate the statements on a 7-point frequency scale. Students were asked to respond on a scale from 1 to 7, with a higher score indicating more agreement with the statement (never–very often). Cronbach’s α (α = 0.83) was calculated to assess the internal reliability of the scale.
An adapted version of the **School Burnout Inventory (SBI)**⁴⁷ was used. Six items on a 7-point frequency scale were used. Respondents were asked to rate the extent to which they agreed with the statements (strongly disagree–disagree). The scale consisted of statements such as “I often wonder whether my schoolwork makes sense”. A higher composite score indicates a higher level of perceived school-related burnout⁴⁷. SBI scale internal reliability high (Cronbach’s α = 0.87).
The **Digital Addiction Scale for Teenagers (DAST)**⁵⁰ is a 10-item scale that measures teenagers’ symptoms of digital addiction. The scale describes some of the ways in which digital devices are used and the associated feelings. The scale consists of statements such as: “I keep an eye on my digital device even when I am chatting with someone”. Respondents were asked to rate on a 7-point frequency scale how often these situations occur (never to very often). The internal reliability of this scale was also high (α = 0.86).
In addition, respondents’ demographic data were used: gender, age, class.
Data analysis
The data were analysed using the IBM SPSS Statistics 26 program. Principal Component Analysis (PCA) was used to analyse the data to identify commonalities. Principal component analysis was used with the aim of conveying as much as possible of the total variance of the characteristics through the principal components⁵⁸. Descriptive statistics were used to investigate respondents’ estimates of perceived learning difficulties. A one-way ANOVA was used to identify differences by class and gender. A further analysis using Levene’s test was conducted to identify detailed differences between subgroups. The p-value and effect size h² were used to express statistical significance between subgroups. The following criteria were used to interpret the effect size: h² ≥ 0.13 large effect; h² = 0.13–0.06 medium effect; h² = 0.01–0.05 small effect. The p-value (p ≤ 0.05), effect size, was used to express statistical significance between subgroups. Pearson’s linear correlation coefficients were used to analyse the relationships between different values⁸.
Results
Perceived Learning Difficulties Scale Analysis
Factor analysis with principal components was conducted to examine the structure of the scale’s statements. The analysis revealed that all the scale statements have good communality (higher than 40%), and one principal component describes 54% of the total variability of all the baseline items. The scale statements have a communality between 62% and 85%. The results of the analysis are presented in Table 1.
Table 1. Arithmetic averages, standard deviations, factor loadings, and composite scores of responses to the statements of the Perceived Learning Difficulties Scale (N = 8170)
Items of Perceived Learning Difficulties Scale M SD Factor loadings I feel that learning is difficult for me. 3.8 1.456 0.754 I must redo the tests because of a bad result. 2.97 1.596 0.620 I find it difficult to understand the meaning of texts when I read them. 3.33 1.538 0.673 I find it difficult to keep up with my classmates at the same pace of learning. 2.73 1.478 0.826 It takes me longer to understand what I’m learning than other peers. 2.79 1.498 0.845 I need help with homework from family members or classmates. 2.78 1.381 0.663 6-item Perceived Learning Difficulties Scale composite score:
M = 18.47 | SD = 6.537
We also analysed the scale with two principal components, but the two principal components were related by 0.36 and no two clearly distinguishable principal components were found. The second principal component was most strongly represented by the statement “I must redo the tests because of a bad result”.
Students’ perception of learning difficulties
The students’ PLDS composite scores are shown in Figure 1. Since the students answered a questionnaire consisting of six statements and the answer could be chosen between 1 and 7, the composite score for each student who participated could be between 6 and 42.
Figure 1. The distribution of students according to their composite score of perceived learning difficulties (N = 8170)
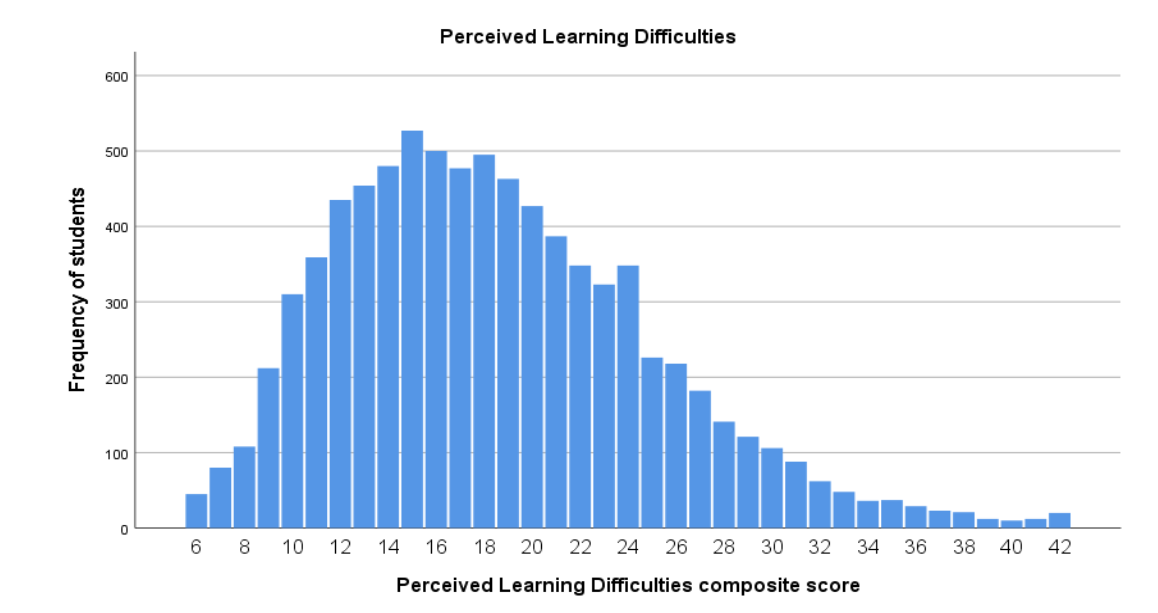
The arithmetic mean of the composite score of the six-factor latent scale of perceived learning difficulties was 18.47, with a standard deviation of 6.537. The minimum composite score was 6 and the maximum was 42 (Figure 1).
Our study showed that 13.7% of students scored one to two standard deviations below the arithmetic mean (6–11 PLDS points). Up to one standard deviation below the arithmetic mean was found for 41.3% of results (12–18 PLDS points). At the same time, 30.8% of students perceived learning difficulties up to one standard deviation above average. These students had a composite score of 19–25 PLDS points and perceived learning difficulties rather rarely or for a few traits.
10.4% of the composite scores (26–31 PLDS points) were one to two standard deviations above the arithmetic mean and these students can be counted as learning difficulties perceiving students. 3.8% of students scored more than three standard deviations above the arithmetic mean. The PLDS composite score for students who responded in this way was 32–42, and this assumes the selection of “often” and “very often” for all statements. It can be suggested that these students have persistent learning difficulties. Thus, the results of our study show that perceived learning difficulties are found in 14.2% of students in grades 6–12.
The arithmetic mean of all respondents’ answers was highest for the statement “I feel that learning is difficult for me” (M = 3.88, SD = 1.46) (Table 1).
the respondents, 29.8% admitted to having felt this way rather often to very often during this academic year. The proportion who disagreed with this statement was low (2.6%). The option “so-so” was the most frequently selected (30%) (Supplementary material).
Supplementary Material. Perceived Learning Difficulties Scale
Please rate how often you have had difficulties in learning during this academic year?
Scale: never, rarely, somewhat rarely, so-so, somewhat often, often, very often
Percentage (%) of responses
| Item | never | rarely | rather rarely | so-so | rather often | often | very often |
|---|---|---|---|---|---|---|---|
| I feel that learning is difficult for me. | 2.6 | 16.8 | 20.8 | 30.0 | 15.0 | 9.2 | 5.6 |
| I must redo the tests because of a bad result. | 18.4 | 30.1 | 16.8 | 17.6 | 8.4 | 5.6 | 3.1 |
| I find it difficult to understand the meaning of texts when I read them. | 8.9 | 27.1 | 21.6 | 21.9 | 10.2 | 6.2 | 4.1 |
| I find it difficult to keep up with my classmates at the same pace of learning. | 21.2 | 32.5 | 18.0 | 16.5 | 6.0 | 3.8 | 2.1 |
| It takes me longer to understand what I’m learning than other peers. | 19.4 | 33.7 | 17.1 | 16.9 | 6.7 | 3.8 | 2.5 |
| I need help with homework from family members or classmates. | 14.3 | 39.6 | 18.5 | 16.3 | 6.3 | 3.2 | 1.8 |
Students also have more difficulty understanding the meaning of reading texts (M = 3.33, SD = 1.538) (Table 1). One fifth found it difficult to understand the meaning of texts when reading rather often or even very often.
Fewer agreed with the item “I find it difficult to keep up with my classmates at the same pace of learning” (M = 2.73, SD = 1.48). It was difficult to keep the same pace as classmates rather often to very often for 11.9% of respondents (M = 2.73; SD = 1.478). 17.1% of students felt that they often had to re-do a test because of a bad mark (M = 2.97, SD = 1.60). 13% of respondents felt that it took them rather often to very often longer than their peers to understand what they had learnt (M = 2.79, SD = 1.50). 11.3% (M = 2.78, SD = 1.38) felt that they needed help with their homework more often or very often. When looking at the frequency with which difficulties were reported, for all questions “rather often” was the most frequently answered, followed by “often”, and “very often” the least.
Class and gender differences in perceptions of learning difficulties
The results of the univariate analysis of variance and Levene’s test showed that there are small and statistically insignificant differences in the perception of learning difficulties between students in different grades (F = 5.973; p < 0.05, h2 = 0.004). The lowest composite score for each student could be six and the maximum sum of scores could be 42. The arithmetic means of the composite scores for the classes ranged between 17.85 and 19.08 points, so the average difference in scores was less than two points. In some of the class comparisons, the p-value was higher than 0.05 and their results can be considered the most similar.
Similar perceptions of learning difficulties were found for students in grades 7 and 10. Similar results were also found for students in grades 6 and 10 and for students in grades 9, 11 and 12.
Gender differences in the perception of learning difficulties were calculated on the basis of the way students had indicated their gender in the questionnaire. Most respondents had chosen between male and female gender. However, there was a significant number (5.1%) who had chosen other or did not wish to disclose their gender. To gain an insight into their perception of learning difficulties, they were considered as a separate group when analysing gender differences (Table 2).
Table 2. Distribution of perceived learning difficulties by gender
| Gender | N | M | SD | Minimum | Maximum |
|---|---|---|---|---|---|
| Male | 3621 | 17.53 | 6.333 | 6 | 42 |
| Female | 4136 | 19.03 | 6.518 | 6 | 42 |
| Prefer not to say/other | 413 | 21.08 | 7.114 | 6 | 42 |
| Total | 8170 | 18.47 | 6.537 | 6 | 42 |
Compared to boys (M = 17.53; SD = 6.333), girls were more likely to perceive learning difficulties (M = 19.03; SD = 6.518) (Table 2). Among those who had not indicated their gender, the mean overall score for learning difficulties was the highest and the difference in responses the largest (M = 21.08; SD = 7.114). To further compare differences by gender, a one-factor analysis of variance and Levene’s test were performed (F = 88.0; p < 0.05, h2 = 0.021). There were statistically significant differences in the perception of learning difficulties between all groups (p < 0.005). Boys’ responses to perceptions of learning difficulties differed from both girls’ and those of unspecified gender. Girls’ responses differed from both boys’ and those with gender undetermined in their perception of learning difficulties.
Perceived learning difficulties in relation to burnout and digital addiction
There is a statistically significant positive association between perceived learning difficulties and digital addiction (r = 0.323, p < 0.01). A higher perceived learning difficulties composite score is also associated with a higher burnout (r = 0.509, p < 0.01) composite score (Table 3). There was a significant and high correlation between perceived learning difficulties and burnout. Those who often feel that their schoolwork has no meaning, have low motivation to do schoolwork, feel that they cannot cope with learning and feel overloaded with schoolwork, and sleep poorly because of schoolwork also have high perceived learning difficulties composite scores.
Table 3. Correlation matrix: correlations between students’ perceptions of learning difficulties, digital addiction and school-related burnout (N = 8170)
| Digital addiction | Learning difficulties | School-related burnout | |
|---|---|---|---|
| Digital addiction | 1 | 0.323** | 0.409** |
| Learning difficulties | 0.323** | 1 | 0.509** |
| School-related burnout | 0.409** | 0.509** | 1 |
p < 0.01
Students with higher perceived learning difficulties scores also had higher digital addiction scores. They often confessed to feeling bored and annoyed without a digital device, feeling the need to use it constantly, keeping an eye on the digital device even while eating or chatting with someone.
Discussion
The aim of this study was to find out the internal consistency of the Perceived Learning Difficulties Scale (PLDS) between the perceived learning difficulties, how students in grades 6–12 perceive the learning difficulties, and how perceived learning difficulties are related to burnout and digital addiction.
This study showed that there was good consistency between the PLDS items. The statements of the PLDS are consistent with each other and, as such, are suitable for identifying perceived learning difficulties in a sample of primary and secondary school students.
Most students in grades 6–12 perceive so little or so rarely that they might be expected to cope with learning without additional support. Temporary or specific learning difficulties are indicated by PLDS composite scores that are one to two standard deviations above the arithmetic mean (26–31 PLDS points). For those students who perceive often or very often signs of learning difficulties, the PLDS composite score was three standard deviations above the arithmetic mean. It can be assumed that these respondents have persistent learning difficulties (32–42 PLDS points). The distribution of PLDS composite scores is broadly consistent with previously known statistics on diagnosed learning difficulties³⁷,⁵².
Diagnosed learning difficulties are associated with deficits in students’ cognitive processes. These result in lower than age-appropriate coping and persistent difficulties¹⁵. The results of a survey on perceived learning difficulties also show that a significant proportion of students perceive that they take longer to understand what they are learning than their peers and find it difficult to cope with learning at the same pace as their classmates. The arithmetic mean response to the statement “I feel that learning is difficult for me” was the highest. In Estonian schools, nearly a third of students feel that learning is often or very often difficult for them.
Previous research on learning difficulties shows that most students diagnosed with learning difficulties have difficulty acquiring reading skills at age-appropriate levels²⁷,³¹. Students with reading difficulties find it difficult to read texts at the same pace as their peers and may not be able to comprehend the content of what they read due to low reading skills³¹. As in previous research on learning difficulties²⁷,⁵⁴, the study of perceived learning difficulties found that a fifth of students have difficulty understanding the meaning of texts when reading. At the same time, reading at an age-appropriate level is a prerequisite for acquiring subject knowledge and academic performance.
More than a tenth of the survey respondents admitted to needing the help of family members or classmates to do homework rather often or very often. It is well known from the past¹⁵,⁵⁷ that it is difficult for students diagnosed with learning difficulties to cope with learning without adapting their learning. They are characterised by a greater need for help both in class and with homework.
It was interesting to note that in this study there was not as much variation by school level in students’ own perception of learning difficulties as is seen in the national statistics on diagnosed learning difficulties. Differences between classes remained small and were not statistically significant. Perceptions of learning difficulties were similar in the first grades of the school year (grades 7 and 10) and in the final grades (grades 9 and 12), as well as in grades 8 and 11.
In this study, statistically significant gender differences were found in the perception of learning difficulties. In all European countries, a clear pattern emerged, with a much higher proportion of boys with special educational needs than girls⁴³. In Estonian educational statistics, boys are also significantly more likely to have special educational needs than girls²². It was interesting to note that in this study boys perceived learning difficulties slightly less than girls. This result contradicts the knowledge that boys generally have more learning difficulties⁹,²⁷. At the same time, it has been previously reported that girls may manifest learning difficulties more easily and their specific needs may therefore be unidentified and unsupported by special education². Previous studies have shown that girls tend to worry more about schoolwork and perceive more stress due to different schoolwork⁵⁵.
As in several previous studies²⁵,⁴⁷ assessing burnout in students diagnosed with learning difficulties, this study found that perceived learning difficulties correlated with burnout. School-related burnout, however, implies a lack of well-being in the academic context.
The study showed significant links between perceived learning difficulties and digital addiction. Perceived learning difficulties aggregate scores were, on average, positively related to digital addiction. An earlier study in Estonia showed very similar associations between the variables⁵⁰. During periods of distance learning, longer use of digital tools and a greater need to cope with learning independently⁵⁷ are likely to have an impact on the likelihood of perceived learning difficulties and digital dependence.
Conclusion
So far, adults – parents, teachers and support professionals – have played a central role in identifying the need for additional support for students⁴⁹. At the same time, previous research has shown that students’ academic self-concept correlates positively with their academic achievement¹⁷. Such a correlation is also evident for students diagnosed with learning difficulties⁶³. Thereby, students diagnosed with learning difficulties have lower ratings of their academic performance than their peers¹⁷,³⁴,⁶². In the light of the results of this study, it can be stressed that adults around students should pay more attention to students’ own perceptions of their own coping and difficulties. Schools have different practices in this area, the evaluation system or the management of developmental discussions may be different. It is worthwhile for schools to think about creating a well-functioning structure that allows students’ views to be collected and considered. An additional tool could be the use of the Perceived Learning Difficulties Scale.
The results of the survey show that the need for student support is still significant in secondary school. Large differences were found between students’ perceptions of learning difficulties and official statistics. Although students need to demonstrate in entrance exams and in the final examinations that their knowledge and learning skills are up to the expected standards to continue in upper secondary education, they perceive learning difficulties at a similar level as students in primary school. One reason for this may be the higher learning demands in upper secondary school (more complex texts, more homework). This result may also be related to the challenges and difficulties perceived in the transition from one school to another and needs further investigation. As compulsory schooling is currently required in Estonia until the end of primary education or until the age of 17²⁹, this may be one of the reasons why the same level of support services is not guaranteed for students in primary school. Greater responsibility seems to have been left to schools, students themselves and their parents. Secondary education has so far been optional for students.
It is well known that environmental factors influence the development and depth of learning difficulties¹⁵. Inadequate help and support can, in turn, lead to accumulating stress and mental health problems. If this goes unnoticed, students who perceive difficulties are at high risk of school-related burnout and other mental health problems. After all, it is known from previous studies⁵,⁴⁷ that school-related burnout can result from long-term academic difficulties and ongoing school-related stress.
A debate will focus on the causal relationships between school burnout, learning difficulties and digital addiction. This cross-sectional survey and statistical analyses do not allow generalisations to be made about the causes and consequences of digital addiction, burnout and perceived learning difficulties. However, the study showed that there is a positive correlation between perceived learning difficulties, digital addiction and burnout. It is possible that these are different dimensions of the same phenomenon, all of which in turn influence students’ psychological well-being and mental health.
Limitations and future research directions
The research was conducted electronically, in the computer classrooms and homes of the participating schools. The researchers did not have the opportunity to observe all the students while they were completing the questionnaire. There may have been some participants who did not answer all the questions adequately. This fact also led to the exclusion of quite many respondents from the sample. The reliability of the responses of students with learning difficulties may have been affected by their difficulty in understanding the texts.
Another limitation of the study is that it did not use other empirical data that would provide information on students’ diagnosed learning difficulties. This was not possible due to the data collection procedure. All participants remained anonymous, and it was not possible to collect additional data from databases. It was also not necessary to collect additional information on students’ diagnoses because of confidentiality and data protection restrictions. In future studies, it is desirable to compare the results of the Perceived Learning Difficulties Scale with the students’ learning outcomes or diagnoses. Once the scale has been tested more extensively, it could be used as one of the tools for the initial identification of students who perceive themselves as having learning difficulties and who need more support in school. It would be useful for schools where there is a shortage of support specialists and therefore some students with learning difficulties go unnoticed. We also recommend that, after further testing, the scale could be used, where appropriate, in studies focusing on students’ coping and well-being.
Further research would need to pay attention to special educational needs in the upper secondary level of the curriculum – how to recognise the need for support and ensure intervention.
What needs to be analysed further is what is associated with the third group by gender. Preliminary analyses show that they have the highest rates of learning difficulties. The results for the third group are also associated with other risks, such as a higher rate of digital addiction⁵¹. It would be worthwhile to further analyse the social and emotional coping, as well as the mental health risks, of both the third group and all students with learning difficulties.
More attention needs to be paid to the mental health and well-being of students in need of support. The issues identified in the study also deserve attention in education policymaking.
References
1. Aktan O. Determination of educational needs of teachers regarding the education of inclusive students with learning disability. Int J Contemp Educ Res. 2020;7(1):149–164. doi:10.33200/ijcer.6 38362
2. Alesi M, Rappo G, Pepi A. Depression, anxiety at school and self-esteem in children with learning disabilities. J Psychol Abnorm Child. 2014; 3(3):1-8. doi:10.4172/2329-9525.1000125
3. Almourad BM, McAlaney J, Skinner T, Pleva M, Ali R. Defining digital addiction: Key features from the literature. Psihologija. 2020;53(3):237-253. doi:10.2298/PSI191029017
4. Barton D. Literacy: An Introduction to the Ecology of Written Language. 2nd ed. Oxford: Blackwell Publishing; 2007.
5. Ben-Naim S, Laslo-Roth R, Einav M, Biran H, Margalit M. Academic self-efficacy, sense of coherence, hope and tiredness among college students with learning disabilities. Eur J Spec Needs Educ. 2017;32(1):18–34. doi:10.1080/08856257.20 16.1254973
6. Centre for Educational Innovation. Student survey 2022: feedback booklet for schools. Published 2023. Accessed March 1, 2024.
https://www.tlu.ee/sites/default/files/Instituudid/HTI/HIK/kooliuuring/%C3%95pilasuurimus_tagasisideraamat_2022.pdf
7. Chacón-Cuberos R, Martínez-Martínez A, García-Garnica M, Pistón-Rodríguez MD, Expósito-López J. The relationship between emotional regulation and school burnout: Structural equation model according to dedication to tutoring. Int J Environ Res Public Health. 2019;16(23):1–14. doi:10.3390/ijerph16234703
8. Cohen L, Manion L, Morrison K. Research Methods in Education. 6th ed. London & New York: Routledge; 2007.
9. Cortiella C, Horowitz SH. The State of Learning Disabilities: Facts, Trends and Emerging Issues. New York: The National Center for Learning Disabilities; 2014. Accessed November 8, 2024. https://www.ncld.org/wp-content/uploads/2014/11/2014-State-of-LD.pdf
10. Education and Youth Board. Pupil personalisation in delivering learning that matters. Published 2021. Accessed January 10, 2025. https://harno.ee/sites/default/files/documents/2022-01/Individuaalsuse%20arvestamine%20j%C3%B5ukohase%20%C3%B5ppe%20tagamisel%2022.pdf
11. European Agency for Special Needs Education and Inclusive Education. Published 2022. Accessed January 8, 2025. https://www.european-agency.org/
12. Estonian Education Information System. Accessed January 8, 2024. https://www.ehis.ee/
13. Estonian Qualifications Authority. A Forward-Looking View on Labour and Skills Needs: Education and Research. Published 2018. Accessed January 12, 2025. https://oska.kutsekoda.ee/wp-content/uploads/2018/09/OSKA-Hariduse-ja-teaduse-uuringuaruanne-2018.pdf
14. Farell M. Educating Special Children: An Introduction to Provision for Pupils with Disabilities and Disorders. New York & London: Routledge; 2008.
15. Frith U. Resolving the paradoxes of dyslexia. In: Reid G, Wearmouth J, eds. Dyslexia and Literacy: Theory and Practice. Chichester: John Wiley & Sons; 2006:45–68.
16. Gaspar T, Bilimoria H, Albergaria F, Matos MG. Children with special educational needs and subjective well-being: Social and personal influence. Int J Disabil Dev Educ. 2016;63(5):500-513.
17. Ghazvini SD. Relationships between academic self-concept and academic performance in high school students. Procedia Soc Behav Sci. 2011; 15:1034–1039. doi:10.1016/j.sbspro.2011.0 3.235
18. Habib M. The neurological basis of developmental dyslexia and related disorders: A reappraisal of the temporal hypothesis, twenty years on. Brain Sci. 2021;11(6):708. doi:10.3390/br ainsci11060708
19. Heward WL. Exceptional Children: An Introduction to Special Education. London: Pearson; 2014.
20. Häidkind P, Oras K. The concept of inclusive education and the challenges for teachers in kindergartens and first grade. Est J Educ. 2016; 4(2):60-88. doi:10.12697/eha.2016.4.2.04
21. ICD-10: Mental and Behavioural Disorders. Clinical Descriptions and Diagnostic Guidelines. Tartu: University of Tartu Publishing House; 1999.
22. Kallaste E. The Effectiveness of Inclusive Education and Related Measures for Students with Special Educational Needs: Statistical Overview of the Prevalence, Inclusion and Use of Support Measures for HEV in Estonia 2010-2014. Tallinn: Estonian Centre for Applied Research Centar; 2016. Accessed November 6, 2024.
https://centar.ee/case-studies/studies/enhancement-of-inclusive-education-for-pupils-with-educational-special-needs/
23. Karakose T, Tülübaş T, Papadakis S. Revealing the intellectual structure and evolution of digital addiction research: An integrated bibliometric and science mapping approach. Int J Environ Res Public Health. 2022;19(22). doi:10.3390/ijerph192 214883
24. Kirk SA, Gallagher JJ. Education of Exceptional Children. 6th ed. Boston: Houghton Mifflin Company; 1989.
25. Kiuru N, Leskinen E, Nurmi J, Salmela-Aro K. Depressive symptoms during adolescence: Do learning difficulties matter? Int J Behav Dev. 2011; 35(4):298–306. doi:10.1177/0165025410396764
26. Kivirand T, Leijen Ä, Lepp L, Malva L. The meaning and effective implementation factors of inclusive education in the Estonian context: The perspective of professionals training or advising teachers. Est J Educ Res. 2020;8(1):48-71. doi:10.12697/eha.2020.8.1.03
27. Kõrgesaar J. Introduction to the Concept of Special Educational Needs. Published 2020. Accessed March 6, 2024. https://dspace.ut.ee/handle/10062/69494
28. Laanemaa K, Piperal L. Coping and Differentiation of Learning for Students with Learning Difficulties in Distance Education. [Master’s thesis]. Tallinn University; 2021.
29. Law on Primary and Secondary Schools. Published 2022. Accessed April 8, 2024.
https://www.riigiteataja.ee/akt/13332410
30. Martinson M. Learning Difficulties: Whose Problem? Where to Look for Solutions? Tallinn: Koolibri; 2010.
31. McCulley LV, Katz S, Vaughn S. Reading instruction and students with learning disabilities. Learn Disabil Pract Concerns Stud LD. 2013; 25:19-43. doi:10.1108/S0270-4013(2013)0000025005
32. Macintyre C, Deponio P. Identifying and Supporting Children with Specific Learning Difficulties. London & New York: RoutledgeFalmer; 2003.
33. Mathew ST. A review of the Learning Disability Evaluation Scale (LDES). J Sch Psychol. 2001;39(3): 279-284. doi:10.1016/S0022-4405(01)00066-8
34. Meltzer L, Katzir TL, Miller L, Reddy R. Academic self-perceptions, effort, and strategy use in students with learning disabilities: Changes over time. Learn Disabil Res Pract. 2004;19(2):99-108.
35. Mikk J. Textbook expertise system. Educ. 2000;(3):23-25.
36. Mikk J. Teachers’ congress recommends textbook testing in schools. Teach Newspaper. Published April 17, 2003.
37. Ministry of Education and Research. Unpublished sources from the Ministry of Education and Research. 2022.
38. Ministry of Education and Research. Special Educational Needs: Organization of Studies and Support Services. Published 2022. Accessed January 8, 2025. https://www.hm.ee/uldharidus-ja-noored/alus-pohi-ja-keskharidus/toe-vajadusega-opilased-oppekorraldus-ja-tugiteenused#hariduslike-erivajad
39. Mitchell D. Diversities in Education: Effective Ways to Reach All Learners. Routledge; 2017. doi:10.4324/9781315684208
40. Morgan J, Frith U. Causal modelling: A structural approach to developmental psychopathology. In: Cicchetti D, Cohen DJ, eds. Manual of Developmental Psychopathology: Theory and Methods. New York: John Wiley & Sons Ltd; 1995:357-390.
41. Morgan E, Klein C. The Dyslexic Adult in a Non-Dyslexic World. London: Whurr Publishers; 2000.
42. Peleg O. Social anxiety among Arab adolescents with and without learning disabilities in various educational frameworks. Br J Guid Couns. 2011;39(2):161-177. doi:10.1080/0306988 5.2010.547053
43. Ramberg J, Watkins A. Exploring inclusive education across Europe: Some insights from the European Agency Statistics on Inclusive Education. FIRE: Forum Int Res Educ. 2020;6(1):85-101. doi:10.32865/fire202061172
44. Rothman HR, Cosden M. The relationship between self-perception of learning disability and achievement. Self-concept and social support. Learn Disabil Q. 1995;18:203-212. doi:10.2307/15 11043
45. Räis ML, Kallaste E, Sandre S-L. Inclusion of students with special educational needs and related measures. Study report. Estonian Centre for Applied Research CentAR. 2016. Accessed March 1, 2024. https://centar.ee/uus/wp-content/uploads/2017/01/Pohiraport-final.pdf
46. Sakiz H, Sart ZH, Börkan B, Korkmaz B, Babür N. Quality of life of children with learning disabilities: A comparison of self-reports and proxy reports. Learn Disabil Res Pract. 2015;30(3):114-126.
47. Salmela-Aro K, Kiuru N, Pietikäinen M, Jokela J. Does school matter? The role of school context in adolescents’ school-related burnout. Eur Psychol. 2009;13(1):12-23. doi:10.1027/1016-904 0.13.1.12
48. Salmela-Aro K, Upadyaya K, Hakkarainen K, Lonka K, Alho K. The dark side of internet use: Two longitudinal studies of excessive internet use, depressive symptoms, school burnout and engagement among Finnish early and late adolescents. J Youth Adolesc. 2017;46(2):343-357. doi:10.1007/s10964-016-0494-2
49. Schults A, Kivirähk T, Plado K, Häidkind P. Definition of special educational need and inclusive education. In: Krull E, ed. Handbook of Educational Psychology. Tartu: University of Tartu Publishing House; 2018:615-672.
50. Seema R, Heidmets M, Konstabel K, Varik-Maasik E. Development and validation of the Digital Addiction Scale for Teenagers (DAST). Advance Preprint. 2021. doi:10.31124/advance.13 503156.v1
51. Seema R, Varik-Maasik E. Students’ digital addiction and learning difficulties: shortcomings of surveys in inclusion. Front Educ. 2023;8:1191817. doi:10.3389/feduc.2023.1191817
52. Silm G, Lepp L, Kivirand T, et al. The effectiveness of inclusive education in general education 2023. University of Tartu, Institute of Educational Research; 2024.
53. Skaalvik EM, Hagtvet KA. Academic achievement and self-concept: An analysis of causal predominance in a developmental perspective. J Pers Soc Psychol. 1990;58(2):292-307. doi:10.1037/0 022-3514.58.2.292
54. Soodla P, Puksand H, Luptova O. Communicative competence. In: Kikas E, Toomela A, eds. Learning and Teaching in the Third Grade. General Competences and Their Development. University of Tartu Publishing House; 2015:147-184.
55. Stepanova M. School-Related Burnout Among Students With Learning Difficulties [master’s thesis]. Tallinn University; 2021.
56. Sukadari JM, Sutarto HA, Junaidi J, Huda M. Exploring specific learning difficulties in primary schools: An empirical research. Test Eng Manag. 2019;81(11-12):4387-4399.
57. Tammets K, Ley T, Eisenschmidt E, et al. Experiences of Special Needs Distance Education and Implications for the Estonian General Education System. Tallinn University; 2021. Accessed January 6, 2025.
https://www.hm.ee/sites/default/files/tlu_raport_distantsope_yldharidus.pdf
58. Tooding LM. Data Analysis and Interpretation in the Social Sciences. University of Tartu; 2007.
59. Valentine JC, DuBois DL, Cooper H. The relation between self-concept and achievement: A meta-analytic review. Educ Psychol. 2004;39(2):11 1-133. https://dukespace.lib.duke.edu/dspace/bitstream/handle/10161/14940/Valentine.pdf?sequence
60. Varik E. Literacy of young adults learning at adult gymnasiums: literacy or illiteracy? Stud Learn Soc. 2014:10-16.
61. Varik-Maasik E. Literacy of Estonian Youth from Different Social Backgrounds [doctoral thesis]. Tallinn University; 2015.
62. Veni RK, Merlene AM. Self-perception and psychological well-being as determinants of classroom behavior of students with and without learning disability. J Indian Assoc Child Adolesc Ment Health. 2022;18(2):158-166. doi:10.1177/097 31342221122840
63. Zheng C, Erikson AG, Kingston NM, Noonan PM. The relationship among self-determination, self-concept, and academic achievement for students with learning disabilities. J Learn Disabil. 2014;47 (5):462-474. doi:10.1177/0022219412469688