


Blood-Based Biomarkers for COVID-19 Prognosis and Treatment
Development and evaluation of blood-based prognostic biomarkers for COVID disease outcomes using EpiSwitch 3-dimensional genomic regulatory immuno-genetic profiling
Ewan Hunter¹, Dmitri Pchejetski², Alexandre Akoulitchev¹, Jane Mellor³
- Oxford BioDynamics plc, Oxford UK
- Norwich Medical School, University of East Anglia
- Department of Biochemistry, University of Oxford, Oxford, UK
OPEN ACCESS
PUBLISHED: 30 September 2024
CITATION: Hunter, E., Pchejetski, D., et al., 2024. Development and evaluation of blood-based prognostic biomarkers for COVID disease outcomes using EpiSwitch 3-dimensional genomic regulatory immune-genetic profiling.Medical Research Archives, [online]12(9).https://doi.org/10.18103/mra.v12i 9.5737
COPYRIGHT: © 2024 European Society of Medicine. This is an open-access article distributed under the terms of the Creative Commons Attribution License, which permits unrestricted use, distribution, and reproduction in any medium, provided the original author and source are credited.
DOI https://doi.org/10.18103/mra.v12i9.5737
ISSN 2375-1924
Abstract
Infection of humans by the SARS-CoV-2 virus leads to highly variable host responses and diverse clinical outcomes, ranging from asymptomatic to hospitalization, intensive care unit (ICU) admission and death. 10% of those with acute infections continue to display post-acute sequelae of coronavirus disease (PASC), now colloquially termed Post-COVID Syndrome (PCS). There is an acute unmet need for unbiased diagnostic biomarkers to predict outcomes before or during the early stages of acute infection, to discover more about PCS and to enable targeting of therapeutics to individual patients. Here, starting with whole blood taken at the time of diagnosis, a predictive classifier model containing six 3-dimensional (3D)-genomic biomarkers able to identify individuals at the highest risk of acute severe COVID disease with a positive predictive value of 93% and balanced accuracy of 88% was developed. The discovery process started with a whole 3D-genome microarray generating 964,631 data points per patient. Mapping the position of the most informative 3D markers to nearby genes revealed associations with ACE2, olfactory, Gβψ, Ca2+ and nitric oxide signalling; innate and adaptive immunity; programme death ligand 1 (PD-L1); prostaglandin E2 (PGE2); and the inflammatory cytokine CCL5, confirming variability in host immune responses, rather than viral genetics or load, as the primary determinant of disease outcomes, and supporting the use of mammalian target of rapamycin (mTOR) inhibitors and immunosuppressants to treat acute severe disease. Using the 3D genomics knowledgebase, with >1 billion 3D genomic datapoints derived from clinical studies, a subset of 77 of the acute COVID-associated prognostic 3D biomarkers were found close to 10 loci genetically linked to fatigue-dominant PCS, and to be informative biomarkers in 6 diseases with fatigue as a symptom. Network analysis linked individual 3D genomic markers to pathways, diseases and therapies. 3D-genomic profiling, as an integrator of multi-omic molecular regulation, offers a new approach for better understanding the complex heterogeneous clinical outcomes triggered by infectious agents.
Keywords
SARS-CoV-2; acute COVID-19 disease; Post-COVID Syndrome (PSC); blood-based biomarkers; 3-dimensional genomic profiling; prediction of COVID disease severity.
Introduction
Infection by the SARS-CoV-2 virus in humans leads to highly variable host response and diverse clinical outcomes, ranging from asymptomatic to hospitalization, ICU admission and death. Some individuals experience asymptomatic or mild disease while other develop severe coronavirus disease (COVID-19) triggered by a strong systemic immune response that can lead to acute respiratory failure, thromboembolic phenomena, microvascular disease, viral sepsis and sometimes death. Another early feature associated with more severe disease is significant hypoxemia that commonly occurs in the absence of other systemic symptoms. Epidemiological studies reveal that advanced age, male gender, obesity, diabetes, hypertension and underlying medical conditions such as neurological disability, particularly stoke and renal disease, and being immunocompromised are also associated with the risk of severe disease. However, a subgroup of healthy patients without these risk factors nevertheless will develop significant disease, leading to increased morbidity or mortality. Identifying the cellular and molecular factors responsible is critical for understanding individual disease risk and appropriate therapeutic interventions for personalised medicine. In addition, 10% of those with acute infections continue to display PCS including a respiratory form, a form involving muscle pain, a predominantly neurological form and disease involving chronic fatigue. There is a real need to identify unbiased diagnostic biomarkers to distinguish disease severity and sub-types of PCS in individual patients after mild or severe acute infection to enable therapeutics to be discovered and targeted appropriately. The 3D configuration of the genome acts as a regulatory interface and integration points for multiple inputs: genetic variants and genetic risk, epigenetic modifications, metabolic signals and transcriptional events, influencing cellular phenotype and ultimately clinical outcomes. The EpiSwitch® Explorer array platform is a chromosome conformation capture (3C) methodology that is used to discover blood-based 3D genomic biomarkers based only the clinical features displayed by a patient (their phenotype). Thus, it is an unbiased method which only relies on a phenotypic characteristic, usually a clinical diagnosis of a disease, to stratify the presence, type and likelihood of developing a condition in blood samples from individual patients. Examples include prostate cancer, response to immune checkpoint inhibitors, melanoma, motor neurone disease, Huntington’s disease, arthritis and diffuse large B cell lymphoma. Commercial tests are now available to diagnose prostate cancer with 94% accuracy (PSE test) and response to immune checkpoint inhibitors across 14 cancers with 85% accuracy (CiRT test). Interestingly, although the anchor sites associated with 3D genomic loops are scattered throughout genomes, by linking the top prognostic biomarkers to nearby genes (within 3Kb), it is possible to learn a great deal about the underlying processes contributing to the pathology of a disease and identify potential therapeutic strategies. Here this approach was applied to discover more about how individuals respond to infection by the SARS-CoV-2 virus, with the aim of developing a blood-based prognostic test to predict the severity of infection and identify potential therapeutic treatments, as the few predictive measures assessed to date suffer from low certainty, high bias and insufficient predictive accuracy. During the discovery phase of this work, the EpiSwitch® Explorer array platform was used to generate 964,631 data points per patient at the time of confirmed SARS-CoV-2 infection and then to identify 200 3D genomic chromosome conformation signatures (CCS) associated with either the development of mild disease or severe clinical outcomes, requiring ventilation and admission to intensive care units (ICU). The loci within 3kb of the 200 3D genomic markers were involved in biological pathways with direct relevance to immune system function including T-cell signalling, macrophage-stimulating protein (MSP)-RON signalling, and calcium signalling. Machine learning algorithms were trained on the best 200 predictive genomic biomarkers and the resultant six-marker model tested on an independent cohort giving a positive predictive value of 93% and balanced accuracy of 88% for COVID-19 severity across 116 patients. This combination of unbiased discovery using 3D genomics and association with pathways, diseases and therapeutics in a 3D genomic knowledge graph space, confirms variability in host immune responses, rather than viral genetics or load, as the primary determinant of COVID-19 disease manifestation and offers new approaches to understanding the variable disease processes associated with SARS-CoV-2, such as PCS.
Materials and Methods
Patient characteristics for the biomarker discovery cohorts (80 patients)
Clinical peripheral blood mononuclear cell (PBMC) (Cohorts 1-3) and whole blood samples (Cohort 4) from consented patients were obtained from academic collaborators and commercial sources. A total of 80 patients from 4 sample cohorts were used in this part of the study, comprising a multinational set of COVID-19 cases: asymptomatic, mild hospitalized and severe (ICU support), from the United Kingdom, the United States, and Peru. All samples were collected at the time of polymerase chain reaction (PCR) test diagnosis of COVID infection. Patients were then observed over the period of up to several weeks for clinical manifestations of COVID disease. The age of the patients ranges from 24 to 95, with median at 70 years (Table 1 and Supplemental Table 1 Tabs 1,2).
Patient characteristic for training (78) and testing (38) cohorts for defining classifying biomarkers
Clinical whole blood samples from consenting patients were supplied from Boca Biolistics LLC (FL, USA) and Reprocell USA Inc. (MD, USA). A total of 116 patients from three sample cohorts were used in this part of the study, comprising a multinational set of COVID-19 cases from the United States, Peru, and the Dominican Republic. Patient annotations are listed in Supplemental Table 1 Tabs 3,4 and Table 2. In line with WHO guidelines, the patient annotations provided were used to classify the severe outcome group on the basis of a confirmed admission to the Intensive Care Unit (ICU) and/or advanced clinical interventions such as mechanical ventilation. Patients that required a lower level of clinical care, such as administration of supplemental oxygen only, were classified as the mild outcome group. All samples were collected within 72 hours of a patient being admitted to a hospital for treatment of a PCR-confirmed COVID infection. The age of the patients ranged from 28 to 92, with median of 64.5 years.
Custom microarray design
Custom microarrays were designed using the EpiSwitch® pattern recognition algorithm, which operates on Bayesian-modelling and provides a probabilistic score that a region is involved in long-range chromatin interactions. It was used to annotate the GRCh38 human genome assembly across ~1.1 million sites with the potential to form long-range chromosome conformations. The most probable interactions were identified and filtered on probabilistic score and proximity to protein, long non-coding RNA, or microRNA coding sequences. Predicted interactions were limited to EpiSwitch® sites greater than 10 kb and less than 300 kb apart. Repeat masking and sequence analysis was used to ensure unique marker sequences for each interaction. The EpiSwitch® Explorer array (Agilent Technologies, Product Code X-HS-AC-02), containing 60-mer oligonucleotide probes was designed to interrogate potential 3D genomic interactions. In total, 964,631 experimental probes and 2,500 control probes were added to a 1 x 1 M comparative genomic hybridization (CGH) microarray slide design. The experimental probes were placed on the design in singlicate with the controls in groups of 250. The control probes consisted of six different EpiSwitch® interactions that are generated during the extraction processes and used for monitoring library quality. A further four external inline control probe designs were added to detect non-human (Arabidopsis thaliana) spike-in DNA added during the sample labelling protocol to provide a standard curve and control for labelling. The external spike DNA consists of 400 bp ssDNA fragments from genomic regions of A. thaliana. Array-based comparisons were performed described previously, with the modification of only one sample being hybridised to each array slide in the Cy3 channel.
Preparation of 3D genomic templates
EpiSwitch® 3C libraries, with chromosome conformation analytes converted to sequence-based tags, were prepared from fresh or frozen whole blood samples using EpiSwitch® protocols following the manufacturer’s instructions (Oxford BioDynamics Plc). All samples were processed under biological containment level CL2+. Initial sample processing was performed manually in a Category 3 microbial safety cabinet with the remainder performed on the Freedom EVO 200 robotic platform (Tecan Group Ltd). Briefly, 50 μL of whole blood sample was diluted and fixed with a formaldehyde containing EpiSwitch buffer. Density cushion centrifugation was used to purify intact nuclei. Following a short detergent-based step to permeabilise the nuclei, restriction enzyme digestion and proximity ligation were used to generate the 3C libraries. Samples were centrifuged to pellet the intact nuclei before purification with an adapted protocol from the QIAmp DNA FFPE Tissue kit (Qiagen) and eluted into 1x TE buffer pH7.5. 3C libraries were quantified using the Quant-iTTM Picogreen dsDNA Assay kit (Invitrogen) and normalised to 5 ng/μL prior to interrogation by PCR. The EpiSwitch® Explorer arrays were performed as published previously, with the modification of only one sample being hybridised to each array slide in the Cy3 channel. EpiSwitch® Explorer arrays, based on Agilent SureSelect array platform, allow for the highly reproducible, non-biased interrogation of ~1.1 million anchor sites for 3D genomic interactions (964,631 experimental probes and 2500 control probes).
Statistical analysis for the biomarker discovery cohort
The COVID-19 cohorts 1-4 were normalised by background correction and quantile normalisation, using the EpiSwitch® R analytic package, which is built on the Limma and dplyr libraries. The four datasets were then combined into one sample set containing 80 samples. Data was corrected for batch effects using ComBat R script. Parametric (Limma R library, Linear Regression) and non-parametric (EpiSwitch® RankProd R library) statistical methods were performed to identify 3D genomic changes that demonstrated a difference in abundance between the Mild and Severe COVID-19 classes. Asymptomatic patients (10 samples) were excluded from this analysis. The resulting data from both procedures were further filtered based on adjusted p-value (FDR correction) and abundance scores (AS). Only 3D genomic markers with adjusted p-value <=0.05 and AS -1.1<= or >=1.1 were selected. Both filtered lists from Limma and RankProd analysis were compared and the intersection of the two lists was selected for further processing.
Genome mapping and linear discriminant analysis for the biomarker discovery cohort
The statistically filtered list of 1000 3D genomic markers with the greatest and lowest abundance scores were selected for genome mapping. Mapping was carried out using Bedtools closest function for the 3 closest protein coding loci (Gencode v33). The resulting list of ‘Severe’ and ‘Mild’ 3D genomic markers were further annotated for relatedness to immunological processes using the ‘immune process’ annotation from Gene Ontology and gene lists for immune aging and trained immunity. Significant 3D genomic markers with associated protein coding loci involved in immune processes were then ordered by adjusted p-value (adj.P.Val), then abundance score. The top 100 3D genomic markers from this combined filter were then utilized for linear discriminant analysis (LDA) using the MASS library and visualized using the ggplot2 package in R.
Biological network and drug target analysis using the biomarker discovery cohort
Network analysis for functional/biological relevance of the 3D genomic markers was performed using the Hallmark Gene Sets and BioCarta and Reactome Canonical Pathway gene sets from the Molecular Signatures Database (MSigDB). Protein interaction networks were generated using the Search Tool for the Retrieval of Interacting proteins (STRING) database. Candidate drugs were identified using the GeneAnalytics platform (geneanalytics.genecards.org).
Translation of array-based 3D genomic markers to PCR readouts
Libraries from 3D genomic templates were quantified using the Quant-iTTM Picogreen dsDNA Assay kit (Invitrogen) and normalised to 5 ng/μL prior to interrogation by PCR. The top array-derived markers in the discovery cohort were interrogated using OBD’s proprietary primer design software package to identify genomic positions suitable for a hydrolysis probe based real time PCR assay. Briefly, the top array-derived markers associated with prognostic potential to differentiate between mild and severe COVID disease outcomes were filtered on fold change and adjusted p value. PCR primer probes were ordered from Eurofins genomics as salt-free primers. The probes were designed with a 5’ FAM fluorophore, 3’ IABkFQ quencher and an additional internal ZEN quencher and ordered from iDT (integrated DNA Technologies). Each assay was optimised using a temperature gradient PCR with an annealing temperature range from 58-68°C. Individual PCR assays were tested across the temperature gradient alongside negative controls including soluble and unstructured commercial TaqMan human genomic DNA control (Life Technologies) and used a TE buffer only negative control. Assay performance was assessed based on Cq values and reliability of detection and efficiency based on the slope of the individual amplification curves. Assays that passed the quality criteria and presented with reliable detection differences between the pooled samples associated with Severe and Mild COVID disease outcomes were used to screen individual patient samples.
EpiSwitch® PCR
Each patient sample was interrogated using real time PCR in triplicate. Each reaction consisted of 50 ng of EpiSwitch® library template, 250 mM of each of the primers, 200 mM of the hydrolysis probe and a final 1X Kapa Probe Force Universal (Roche) concentration in a final 25 μL volume. The PCR cycling and data collection was performed using a CFX96 Touch Real-Time PCR detection system (Bio-Rad). The annealing temperature of each assay was changed to the optimum temperature identified in the temperature gradients performed during translation for each assay. Otherwise, the same cycling conditions were used: 98°C for 3 minutes followed by 45 cycles of 95°C for 10 seconds and 20 seconds at the identified optimum annealing temperature. The individual well Cq values were exported from the CFX manager software after baseline and threshold value checks. All Cq values obtained for individual samples and markers are available online: https://github.com/oxfordBiodynamics/medrxiv/tree/main/CST%20publication. A total of 21 3D genomic markers that passed the translation phase were screened on 78 individual samples from the Training cohort. A marker reduction step based on statistical criteria were used to identify the top six discriminating markers which were used to screen the remaining set of 38 samples in the Test cohort.
Genomic mapping
The 21 3D genomic markers from the statistically filtered list with the greatest and lowest abundance scores were selected for genome mapping. Mapping was carried out using Bedtools closest function for the 3 closest protein coding loci (Gencode v33). All markers were visualized using the EpiSwitch® Data Portal.
Statistical analysis
The 21 markers screened on 78 individual patient samples were subject to permutated logistic modelling with bootstrapping for 500 data splits and non-parametric Rank Product analysis (EpiSwitch® RankProd R library). Two machine learning procedures (eXtreme Gradient Boosting: XGBoost and CatBoost) were used to further reduce the feature pool and identify the most predictive/prognostic, 3D genomic markers. The resulting markers were then used to build the final classifying models using CatBoost and XGBoost. All analysis was performed using R statistical language with Caret, XGBoost, SHAPforxgboost and CatBoost libraries.
Biological network/pathway analysis
Pathway enrichment analysis was performed using the Reactome Pathway Browser. Protein interaction networks were generated using the Search Tool for the Retrieval of Interacting proteins (STRING) database. Discovery using the EpiSwitch Data and Knowledge Graph Space. The graph space contains over a billion CCSs datapoints from more than 20 clinical studies, semantical parsed >33 million abstracts from Pubmed (Bern2) that are integrated with pathway databases, drug DBs, dbSNP, eQTLs, Enhancer DBs, Disease ontologies and Transcription Factors binding sites. Details of the analysis used for this study are available from the corresponding author on reasonable request.
Results
Array-based profiling of COVID-19 patient cohorts for identification of prognostic 3D genomic markers for severe and mild COVID-19 disease outcomes
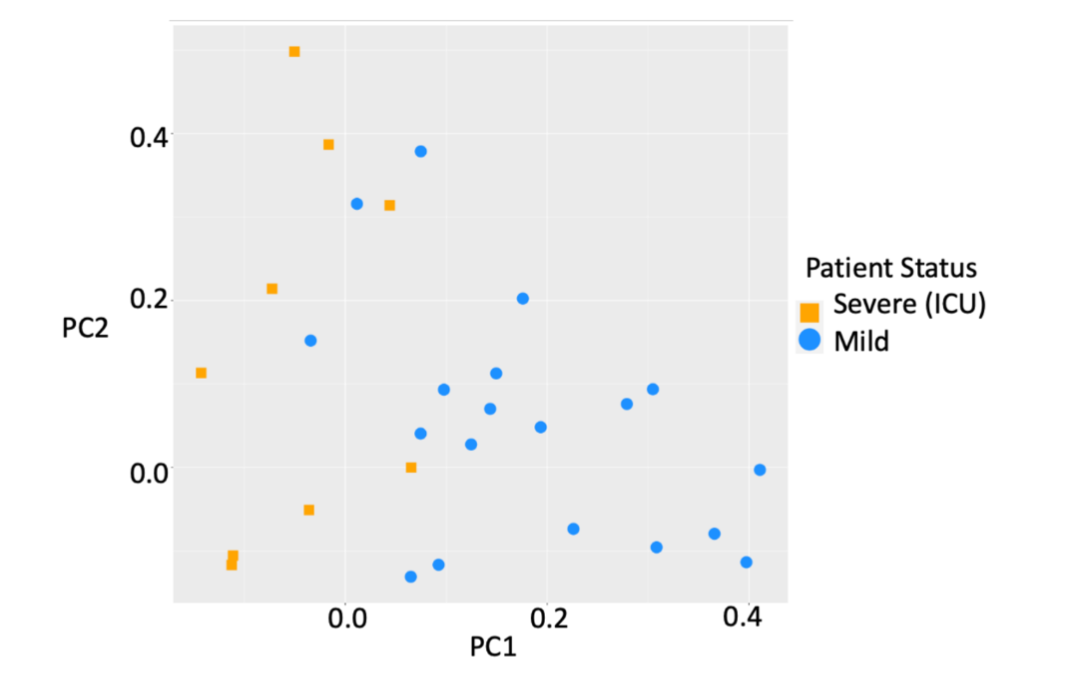
Whole-genome EpiSwitch® Explorer arrays were used to screen peripheral blood mononuclear cells (PBMC) samples collected at the time of confirmed COVID-19 infection from 38 patients in three independent cohorts from the US and the UK. Interestingly, all three cohorts showed separation by principal component analysis (PCA) for mild or severe disease outcomes without pre-selection or reduction of the 964,631 array markers (Figure 1), suggesting that 3D genomic profiles associated with different clinical outcomes exist and can be distinguished.
To evaluate the biological relevance of the observed separation of mild and severe COVID-19 outcomes, the 964,631 3D genomic markers from each patient were subject to statistical testing using both parametric testing (Limma) and non-parametric testing (EpiSwitch® RankProd), both procedures that correct for multiple testing by using False Discovery Rate (FDR) corrections. The RankProd approach also has a resampling step to control for random rank importance, adding another layer of statistical stringency in marker selection when testing a large number of possibilities. The selected markers were filtered based on an adjusted (FDR) P value <=0.05, and high abundance scores (AS), -1.1<= or >=1.1. Similar approaches and thresholds for FDR cut-offs have been used in previously published biomarker development studies. Thus, starting with the 964,631 whole genome screened cis-interactions and after statistical filtering, the 750 3D genomic markers with the greatest and lowest abundance scores were chosen for further analysis. Previous analysis has indicated that changes in the 3D chromosome architecture captured using EpiSwitch® biomarkers, are also reflected in the broader region surrounding each biomarker and that analysis of these regions can give insights into the causes of the observed phenotype. The genomic positions of the 750 3D genomic markers were mapped to enable identification of the 3 closest protein coding loci. Potential functional roles for these loci were obtained using Hallmark Gene Sets, BioCarta and Reactome canonical pathway analysis (Figure 2A-C).
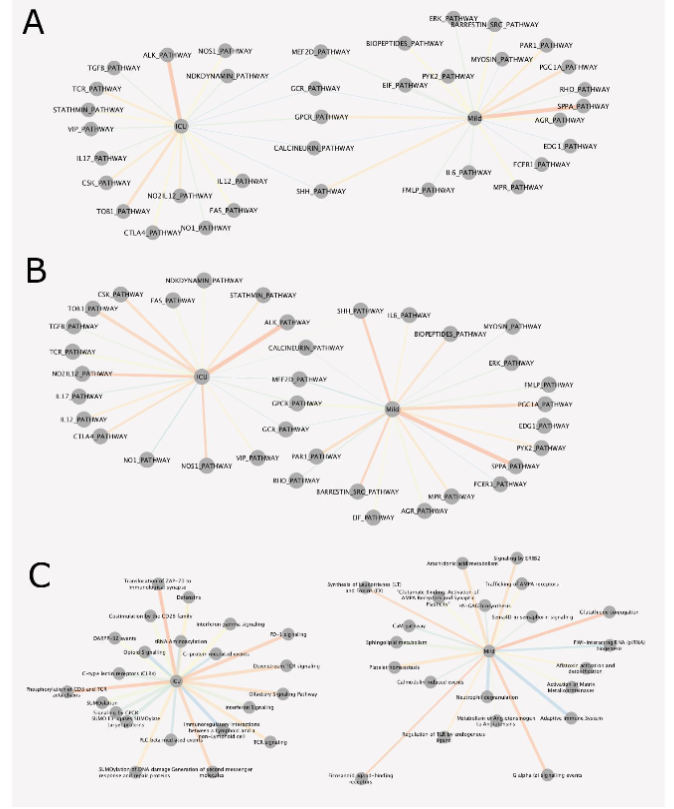
The list of affected pathways and corresponding genetic loci with individual 3D genomic changes is provided in Supplemental Table 1 Tabs 11-31. When evaluating the biological function of the genes within the genomic regions identified as being dysregulated between patients who developed mild or severe outcomes in COVID-19, a number of biological pathways with known associations to COVID-19 were identified, including the olfactory signalling pathway, ACE2, innate and adaptive immune systems, interleukin 6 (IL6) and JAK-STAT signalling, calcium signalling, (NO) nitric oxide signalling, coagulation, complement, interferon gamma (IFNγ) response, transforming growth factor beta (TGFβ) signalling, tumour necrosis factor alpha (TNFα) signalling, and apoptosis. Interestingly, SARS-CoV-2 has been reported to drive hyperactivation of CD4+ T-cells and immune paralysis, due to loss of FOXP3 negative feedback, to promote pathogenesis of disease. Hyperactive T-cells (FOXP3-; CD25+ the IL2α receptor) fail to differentiate into regulatory T-cells (Tregs) and produce Furin to promote viral entry into lung epithelial cells. Feedbacks necessary to repress a potentially overstimulated immune response in COVID-19 may be mediated by CD28 and IL2 (Figure 2C Reactome, ICU; Severe). With CD25 being the IL2α receptor, IL-2 acts as a potent growth factor for CD25-expressing activated T cells (Figure 2A Hallmark, ICU). The prevalence of both IL2 and CD25 indicates that a positive feedback loop for T-cell activation is established in severe COVID-19 leading to the production of multiple effector cytokines. This may be because of a reduction of FOXP3-mediated negative regulation to allow functional Tregs to be produced. The CD25+ T-cells in severe patients are likely to die partly by cytokine deprivation or become hyperactivated in severe disease – i.e. FOXP3 negative cells may become ex-Tregs or hyperactivated T-cells (leading to T cell paralysis). These abnormally activated T-cells produce Furin which activates the Spike pro-protein cleavage and promotes viral entry into cells. Regarding the immune checkpoints, IL2 expression activates FOXP3 and prolonged activation results in the expression of immune checkpoints such as CTLA-4 and FOXP3, which represses transcription of effector cytokines, suppression of T-cell responses and resolution of inflammation (i.e. in normal cells). In severe COVID-19, hyperactivated macrophages may present antigens to CD4+ T-cells which are activated and differentiate into CD25+, IL10R+ early activated T-cells which produced IL10 rather than IL2 and there is no Foxp3 expression to start the negative feedback. This IL10 may further enhance the activation of CD25+ T-cells which express immune checkpoints, multiple cytokines and Furin. Multifaceted Th differentiation leads to unfocused T-cell responses and paralyses the T-cell system. The nucleocapsid (N) protein of the SARS-Cov-1 virus is sumoylated and binds to hUbc9, a ubiquitin conjugating enzyme of the sumoylation system. SARS-CoV-2 N protein is likely to be sumoylated at several sites included K62. This pathway is a potential target for treatments as SUMOylation is required for homo-oligomerisation and self-association of the N protein required for the formation of viral RNP and nucleocapsid assembly. PD-L1 expression in severe COVID-19 patients is likely to be linked to immunosuppressive phenotypes in innate immune cells and to support lymphopenia through apoptosis of lymphocytes. It is possible that PD-1 signalling is not able to control hyperactivated T cells and resolution of hyperinflammatory stage. It remains to be investigated if PD-L1 expression on lung epithelia may also regulate PD-1-expressing T-cells, as shown for influenza and Rous sarcoma viruses. Novel associations with COVID-19 include the macrophage-stimulating protein (MSP)-RON pathway associated with autoimmune disease when defective, and tumour progression when overactivated. Oxidative phosphorylation may prove to be the link between the metabolic state of cells in people with predisposing conditions (T1D, heart attacks, obesity, use of steroids, etc), and dysregulation of the homeostasis of CD25+ T-cells and Fox3p expressing Tregs. Activation of Tregs is impaired in Type1 diabetics, but is also reduced in severe COVID patients. FOXP3 expression is reduced in CD25+ CD4+ T-cells in patients who have had heart attacks. Leptin released from adipocytes also prevents CD25+CD4+ T-cell proliferation. T-cell activation is dependent on glycolysis and oxidative phosphorylation while Treg differentiation is more dependent on oxidative phosphorylation and inhibited by glycolysis. This could be because of the hypoxic lung in severe COVID which leads to higher levels of glycolysis, hence reduced Treg differentiation. This may be via HIF-1alpha activation, which mediates glycolysis and so promotes degradation of FoxP3 proteins and a reduced feedback loop blocking Treg differentiation. Type 1 interferons and downstream pathways are suppressed in severe patients (i.e. lower levels of IFT1,2,3 and IF1TM1), with lower levels of TNF ligands TRAIL, LIGHT and surface proteins SLAMF1, KLRB1, all of which have roles in viral infections. The profound hypoxia associated with more severe disease may well result from viral damage to hypoxic pulmonary vasoconstriction, which is a protective mechanism that diverts blood flow towards the healthier regions of the lung where oxygen uptake can still occur. The regulation of blood flow within the lung is dependent on both Ca2+ signalling and NO. The mechanisms associated with acute hypoxia signalling are not understood, but an interesting link has been made in the carotid body between this mechanism and the olfactory receptor Olfr78. In fact, EpiSwitch® array analysis identified 3 statistically significant 3D biomarkers at the Olfr78/OR51E2 locus.
Linear Discriminant Analysis for COVID-19 disease severity
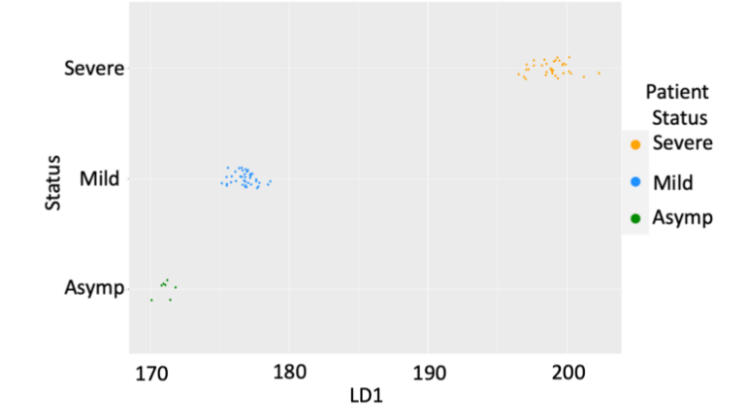
This analysis was further refined by adding fourth blood cohort of hospitalized COVID-19 patients from Lima, Peru which at the time of collection had one of the highest COVID-19 fatality rates in the world (3.5%). Of the 42 hospitalized patients in this cohort, 18 remained on the ward with mild disease and 26 progressed to ICU support. Thus, when combined with the 38 patients in the first 3 cohorts, a total of 80 patients who were screened by the whole genome array were used, providing 77.3 million data points from patients clinically assessed as Asymptomatic (7), Mild (40) and Severe (35). With the focus on prognosis of severe (ICU) outcomes, we reduced our analysis to the top 100 immuno-genetic components of the 3D genomic markers statistically associated with Severe (ICU) outcome in clinical annotations. This data was subject to Linear Discriminant Analysis (LDA). By LDA, the top 100 Severe (ICU) markers were able to demonstrate statistically significant difference for patients with different clinical outcomes – asymptomatic, mild and severe (ICU).
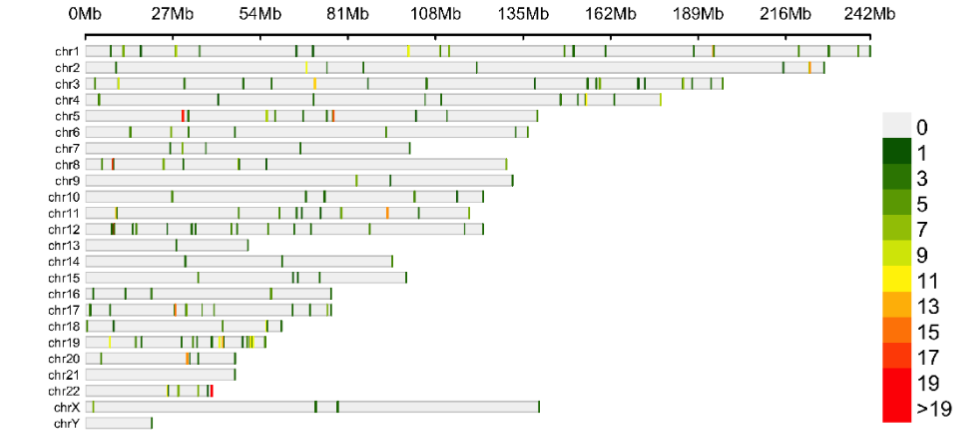
The genomic location of the top 100 3D genomic markers associated with Severe (ICU) clinical outcomes were mapped, there was a broad genomic distribution with a notable high density at regions on chromosomes 5, 17, 20 and 22.
Biological network analysis and therapeutic implications
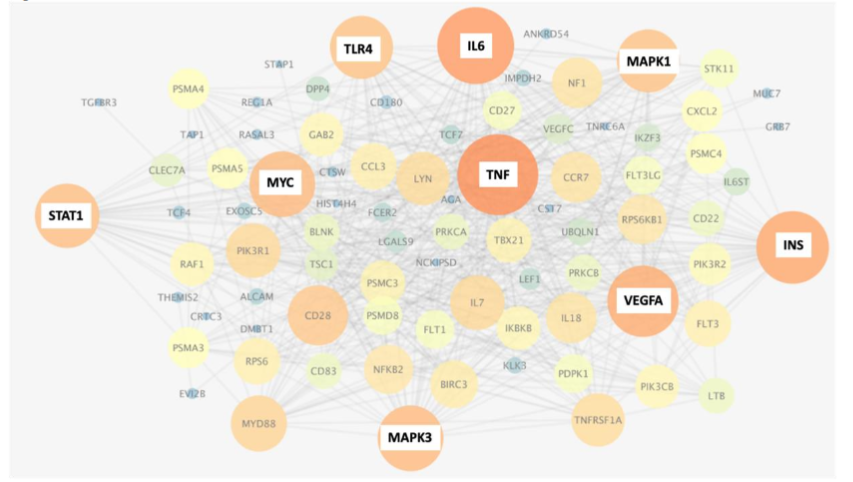
Analysis of the top 3D genomic markers associated with Severe (ICU) COVID-19 outcomes using the Search Tool for Retrieval of Interacting Genes (STRING) database, revealed a network with hubs at inflammatory mediators (TNF, IL6, VEGFA), immune-related receptors and signalling mediators (TLR4, STAT1, MAPK1,3), the pleiotropic transcription factor MYC and metabolic pathways (INS). Stratifying markers associated with IL-6 are linked to both mild and severe acute disease outcome but it is important to note that the chromosomes folds are different in each case. Other genes may show similar relationships to the 3D genomic markers. The network of genes associated with differential 3D genomic folding and severe COVID-19 outcome were evaluated as potential drug targets and therapies for mitigation of severe disease outcomes. Using GeneAnalytics, 25 drug candidates with potential utility for treating COVID-19 disease were uncovered. Interestingly, the analysis based on 3D genomic profiling of severely affected COVID-19 patients identified Dexamethasone with the second highest score, known to be beneficial in reducing mortality among severely affected patients.
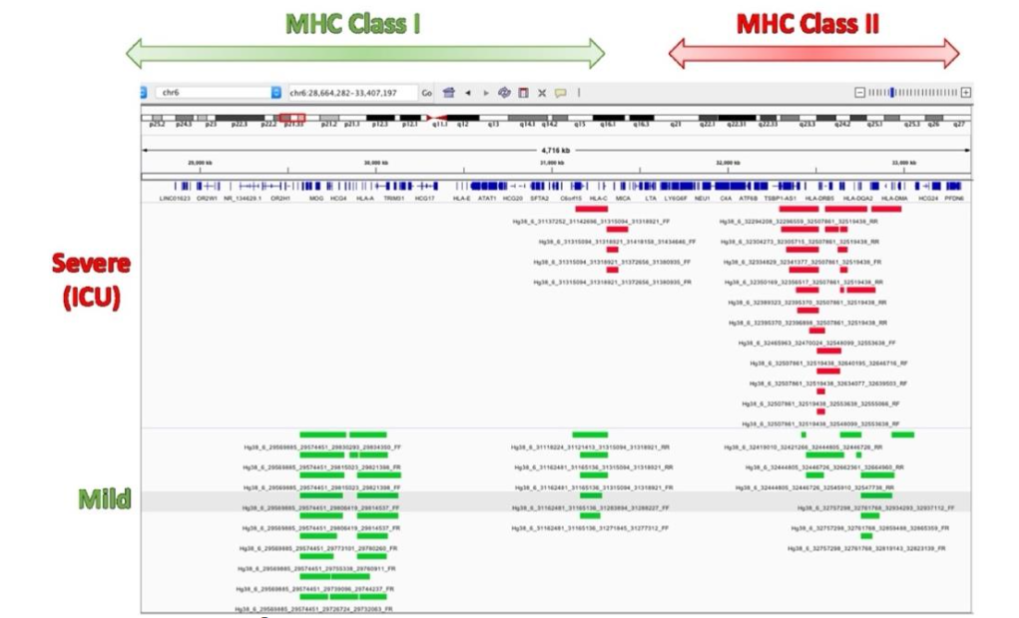
Ranking top 100 immune-related 3D genomic markers associated with severe (ICU) outcome by adjusted p-value, then by abundance, the top 20 markers were found to be at genetic loci involved in macrophage-stimulating protein (MSP)-RON signalling (KLK5, NOS2, KLK3), G-Beta Gamma (Gβγ) Signalling (WNT2B, NOS2, VEGFC) and pathways related to regulation of nitric oxide. The top 20 3D genomic markers associated with Mild clinical outcomes in COVID-19 are PREX1, ARHGAP9, MHC class II antigen presentation (KIF5A, DCTN2) and MHC class I mediated antigen processing and presentation (FCGR1B, DCTN2, KIF5A). Interestingly, the 3D chromosome configurations at MHC class I and class II regions distinguish mild versus severe outcome.
Finally, RAC1 signalling negatively regulates T cell migration via TCR signalling and inhibiting RAC1 restores T cell migration suggesting that essential mechanisms for T cell control are lacking in patients with Severe clinical presentations of COVID-19.
Identification of the top prognostic 3D genomic markers for severe COVID-19 disease outcomes in order to develop a classifying test
The next objective of this study was to translate the EpiSwitch® Explorer Array markers to a PCR based clinical assay to enable prognostic classification of patients as to the likelihood they will suffer severe disease on receipt of a positive COVID-19 test from a whole blood sample.
| Cohort | N | male | female | Age (mean) | Hosp. | ICU |
|---|---|---|---|---|---|---|
| 1-3 | 38 | 18 | 20 | 62.6 | 18 | 10 |
| 4 | 42 | 27 | 15 | 73.8 | 18 | 24 |
Details in Supplemental Table 1 tabs 1 and 2. Starting with the 200 array-derived 3D genomic marker leads associated with severe or mild disease, a sequential stepwise strategy was used to build, refine and test a classifier model with the aim of identifying a minimal set of biomarkers that were predictive of COVID-19 disease severity.
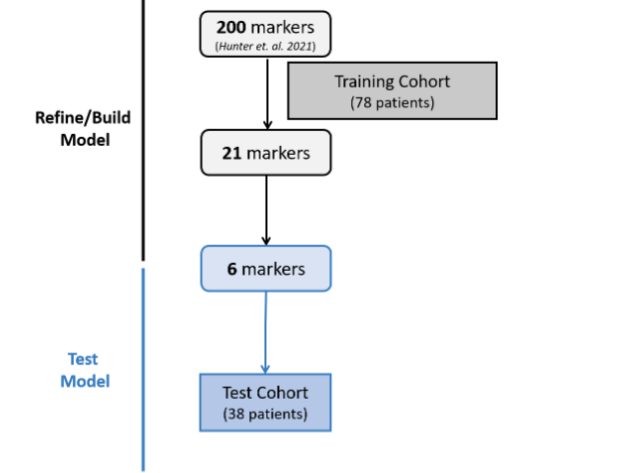
To do this a new cohort of 116 patients in the USA, Peru and the Dominican Republic was divided into a training cohort (78 patients) and a test cohort (38 patients). Their clinical characteristics are shown in Table 2 and Supplemental Table 1 Tabs 3,4.
| Cohort | N | % male | % female | Age (mean) | Age (SD) | % w/PEC | % Hosp. | % ICU | % SO | % Vent. |
|---|---|---|---|---|---|---|---|---|---|---|
| Training | 78 | 64 | 36 | 64.8 | 14.5 | 76 | 46 | 54 | 37 | 60 |
| Test | 38 | 79 | 21 | 65.1 | 16.2 | 90 | 53 | 47 | 29 | 74 |
Details in Supplemental Table 1 tabs 3 and 4. To translate the 200 EpiSwitch® Explorer Array markers to a PCR-detectable assay for clinical use, primers to detect individual 3D genomic markers were generated and validated. Starting with whole blood samples from the training set, feature reduction using machine learning methods on the initial pool of 200 3D genomic biomarkers identified 21 markers with predictive power to differentiate between COVID-19 patients requiring mechanical ventilation and those that were hospitalized but required less interventional care and support. The top 21 markers were non-randomly distributed throughout the human genome, with notable enrichment on larger chromosomes and a hotspot on chromosome 11.
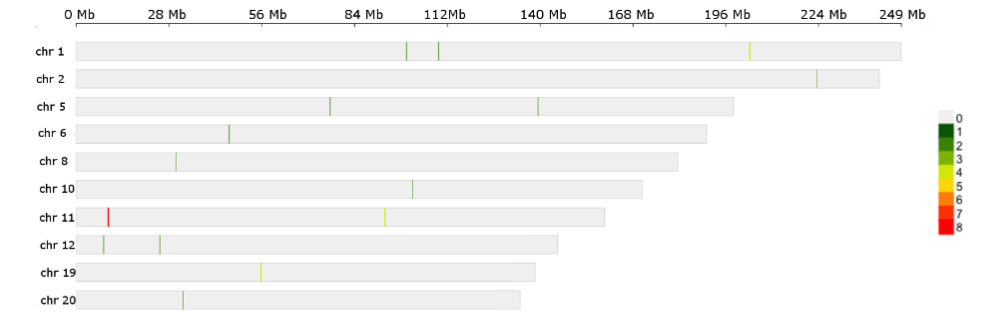
Four out of the 21 markers associated with ICU outcomes occurred within an approximately 265 kb region on the p-arm of chromosome 11 containing the switching B cell complex subunit SWAP70 (also known as DEF6) locus. Genomic mapping of the region surrounding one of the final 21 prognostic 3D genomic biomarkers Linear and circos plot views of a ~500 kb region of chromosome 11 containing the SWAP70 locus showing the genomic location for four markers.
While some of the 3D genomic markers spanned multiple genes, others were localized within protein coding regions of single genes. Pathway enrichment for genes localised within 3Kb of the 21 3D genomic markers revealed the top two pathways to be related to downstream signalling mediated by B-cell receptor activation. Importantly, genomic loci encoding proteins involved in haemostasis/clotting were also enriched. The 21 3D genomic markers were further refined to a set of 6 markers with predictive ability for COVID severity and applied to an independent Test cohort.
| Marker | Closest Genes |
|---|---|
| hg38_10_101411215_101490136_RF | BTRC, DPCD, POLL |
| hg38_11_9577172_9685884_FR | AC011979.1, AC011979.2, RPL23AP65, SWAP70, WEE1 |
| hg38_20_32238035_32290178_FF | KIF3B, PLAGL2, POFUT1 |
| hg38_11_9685855_9716901_RF | AC011979.1, AC011979.2, SWAP70 |
| hg38_1_109341941_109359750_RR | MYBPHL, PSMA5, SORT1 |
| hg38_11_9663012_9685884_FR | AC011979.1, AC011979.2, SWAP70 |
| hg38_5_139331499_139356679_FF | MATR3, PAIP2, SLC23A1 |
| hg38_2_223395100_223450604_FF | AP1S3, HIGD1AP4, KCNE4, SCG2 |
| hg38_1_99670351_99714401_FF | AGL, FRRS1, HMGB3P10, PALMD |
| hg38_8_30132538_30177089_RR | DCTN6, LEPROTL1, MBOAT4 |
| hg38_12_8219312_8342000_RR | AC092745.2, AC092745.3, ALG1L10P, CLEC4A, ENPP7P5, FAM86FP, FAM90A1 |
| hg38_11_9685855_9839717_RF | AC011979.1, SBF2, SWAP70 |
| hg38_19_55694909_55778461_RF | AC008749.1, AC010525.2, EPN1, NLRP9, RFPL4A, RFPL4AL1, RFPL4AP1 |
| hg38_6_46139224_46175482_FF | ACTG1P9, ENPP4, ENPP5 |
| hg38_12_25206967_25256704_FR | CASC1, ETFRF1, KRAS |
| hg38_11_93198707_93237221_RR | SLC36A4; MTNR1B; DEUP1 |
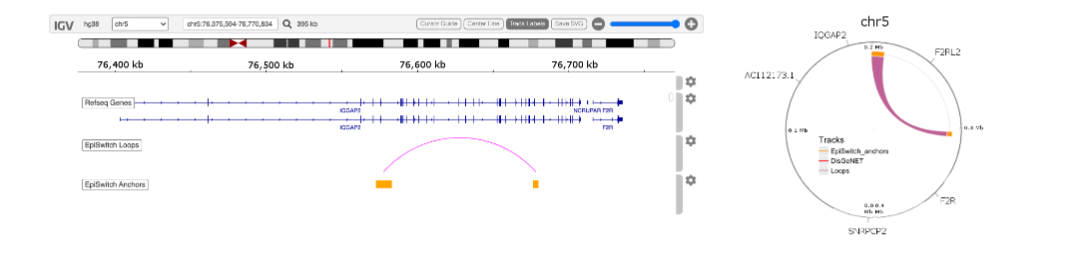
| hg38_5_76572659_76680168_RF | F2R, F2RL2, IQGAP2 |
| hg38_1_203182882_203350382_FR | BTG2, CHI3L1, CHIT1, FMOD, NPM1P40 |
| hg38_19_55711884_55778461_RF | NLRP9, RFPL4A, RFPL4AL1, RFPL4AP1 |
| hg38_1_203182882_203368482_FF | AL359837.1, BTG2, CHI3L1, CHIT1, FMOD, NPM1P40 |
| hg38_11_93057516_93237221_RR | SLC36A4; MTNR1B; DEUP1 |
Classifier calls for high-risk COVID-19 disease outcomes are shown in Table 4. Clinical outcomes for the Test cohort included 10 mild cases or 28 severe cases requiring ventilation and/or ICU support. EpiSwitch® prognostic calls based on the 6-marker model demonstrated performance of 90.9% positive predictive value for high-risk disease outcomes in the Test cohort. Interestingly, two of the mild case patients (COVID 0696 and 0213), identified as high risk by the EpiSwitch® test subsequently died in the hospital within 28 days of admission. This suggests an early, pre-symptomatic detection of a hyperinflammatory state leading to fatal outcomes. The test for high-risk disease outcome demonstrates a positive predictive value (PPV) of 92.9%, 88% sensitivity, 87% specificity, and a balanced accuracy of 87.9% for all 116 patients used in this study.
| Cohort | SampleID | COVID Severity | EpiSwitch Prognostic Call for High-Risk Ventilation | ICU | No | Yes | Final Call |
|---|---|---|---|---|---|---|---|
| Test | COVID0732 | No | 0.624535561 | 0.3754644 | No | ||
| Test | COVID0129 | No | 0.989352465 | 0.0106475 | No | ||
| Test | COVID0636 | No | 0.810631394 | 0.1893686 | No | ||
| Test | COVID0189 | No | 0.96364671 | 0.0363533 | No | ||
| Test | COVID0708 | No | 0.918016613 | 0.0819834 | No | ||
| Test | COVID0117 | No | 0.760194659 | 0.2398053 | No | ||
| Test | COVID0207 | No | 0.740656555 | 0.2593434 | No | ||
| Test | COVID0380 | No | 0.990677834 | 0.0093222 | No | ||
| Test | COVID0696 | No | 0.020404769 | 0.9795952 | Yes* | ||
| Test | COVID0213 | No | 0.04568797 | 0.954312 | Yes* | ||
| Test | COVID0606 | Yes | 0.809160769 | 0.1908392 | No | ||
| Test | COVID0648 | Yes | 0.987436414 | 0.0125636 | No | ||
| Test | COVID0642 | Yes | 0.665544152 | 0.3344558 | No | ||
| Test | COVID0516 | Yes | 0.601811945 | 0.3981881 | No | ||
| Test | COVID0564 | Yes | 0.942398548 | 0.0576015 | No | ||
| Test | COVID0450 | Yes | 0.885789573 | 0.1142104 | No | ||
| Test | COVID0714 | Yes | 0.888814926 | 0.1111851 | No | ||
| Test | COVID0408 | Yes | 0.700852036 | 0.299148 | No | ||
| Test | COVID0558 | Yes | 0.056852765 | 0.9431472 | Yes | ||
| Test | COVID0540 | Yes | 0.26985541 | 0.7301446 | Yes | ||
| Test | COVID0444 | Yes | 0.012335699 | 0.9876643 | Yes | ||
| Test | COVID0456 | Yes | 0.34420839 | 0.6557916 | Yes | ||
| Test | COVID0468 | Yes | 0.26985541 | 0.7301446 | Yes | ||
| Test | COVID0498 | Yes | 0.045760725 | 0.9542393 | Yes | ||
| Test | COVID0576 | Yes | 0.057154838 | 0.9428452 | Yes | ||
| Test | COVID0504 | Yes | 0.006351133 | 0.9936489 | Yes | ||
| Test | COVID0600 | Yes | 0.106978044 | 0.893022 | Yes | ||
| Test | COVID0672 | Yes | 0.08792568 | 0.9120743 | Yes | ||
| Test | COVID0588 | Yes | 0.028880829 | 0.9711192 | Yes | ||
| Test | COVID0654 | Yes | 0.029438535 | 0.9705615 | Yes | ||
| Test | COVID0666 | Yes | 0.124919437 | 0.8750806 | Yes | ||
| Test | COVID0726 | Yes | 0.198130682 | 0.8018693 | Yes | ||
| Test | COVID0474 | Yes | 0.077650517 | 0.9223495 | Yes | ||
| Test | COVID0432 | Yes | 0.145361423 | 0.8546386 | Yes | ||
| Test | COVID0462 | Yes | 0.06204395 | 0.9379561 | Yes | ||
| Test | COVID0510 | Yes | 0.248548523 | 0.7514515 | Yes | ||
| Test | COVID0768 | Yes | 0.377659917 | 0.6223401 | Yes | ||
| Test | COVID0427 | Yes | 0.349406302 | 0.6505937 | Yes |
Discovery using 3D-genomic biomarkers associated with fatigue-dominant Post-COVID Syndrome. Genome wide association studies (GWAS) define 10 loci uniquely associated with patients suffering fatigue-dominant PCS (long COVID). Interestingly, these loci are also associated with fatigue syndromes such as myalgic encephalomyelitis/chronic fatigue syndrome (ME/CFS), for which the largest risk of onset is associated with infectious diseases and sepsis-like conditions. Interrogating the EpiSwitch® Data and Knowledge Graph Space, containing over a billion 3D-genomic datapoints (chromosome conformation signatures) from more than 20 clinical studies and >33 million abstracts semantical parsed from Pubmed (Bern2) that together are integrated with pathway databases, drug DBs, dbSNP, eQTLs, Enhancer DBs, Disease ontologies and Transcription Factors binding sites reveals that 882 3D markers are close to these 10 genes.
GWAS associated with TPST1 and TNS1 are most commonly associated with fatigue-dominant PCS being present in 84% and 83% of patients. TPST1 is one of the top 100 prognostic 3D genomic biomarkers associated with the development of severe acute COVID-19 in all cohorts interrogated. TNS1 is discovered only in subsets of patient cohorts suggesting it might reflect certain sub-types of acute COVID disease. For each 3D biomarker associated with these genes, it is possible to use the EpiSwitch® Data and Knowledge Graph Space to produce networks of pathways, diseases and therapies, to provide unbiased insights, and to clarify potential relationships between the acute infection and PCS. For example TPST1 is associated with hemostasis pathways, known to be associated with long COVID, while TNS1 reveals links to fatigue. This type of analysis helps to clarify the relationship between acute COVID infection and PCS, and to establish PCS as a defined state, potentially distinct from a slow post-infectious recovery in individual patients.
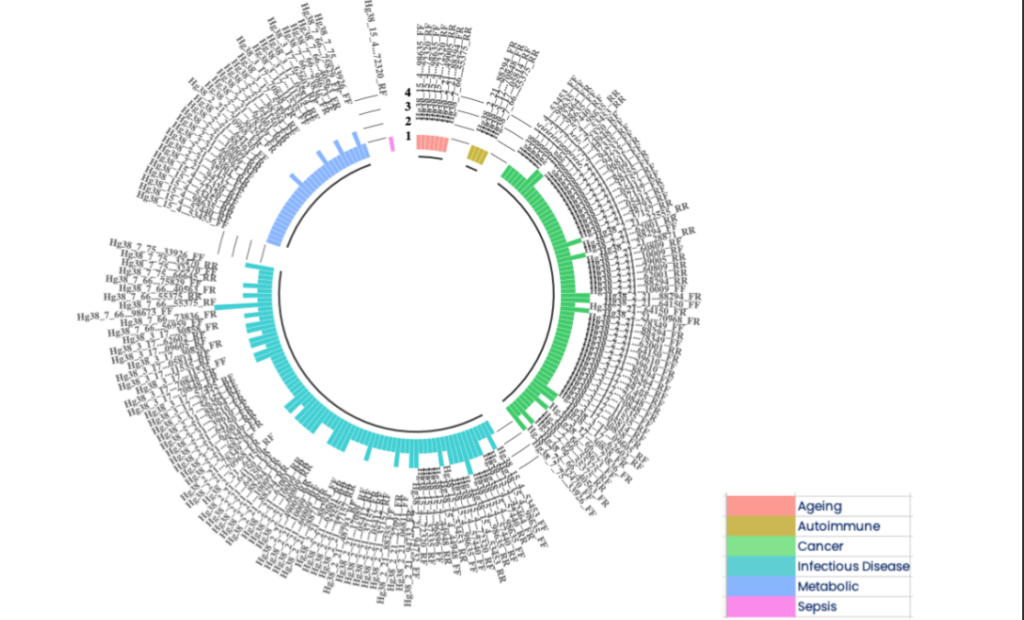
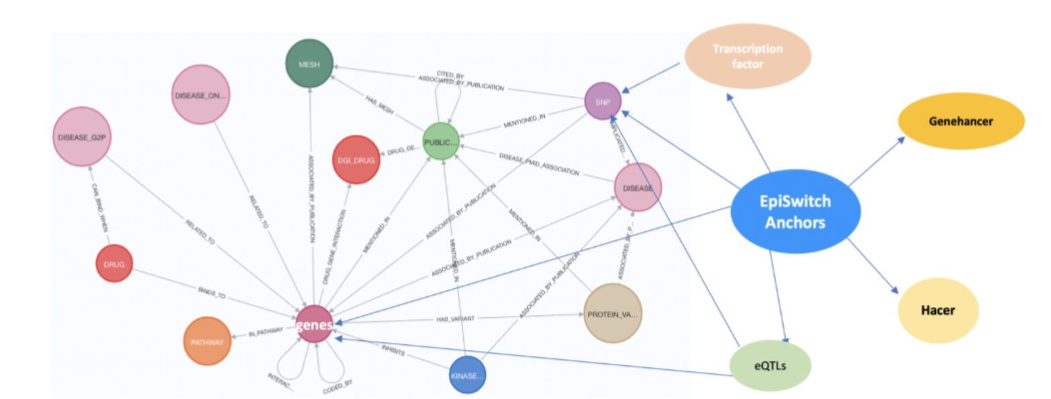
Figure 6B Using the EpiSwitch Data and Knowledge Graph Space to characterise the 77 3D genomic biomarkers associated with acute COVID infections also located close to the top 10 genetic markers associated with fatigue-dominant PCS 10. The nomenclature of 3D biomarkers is shown on the outside of the ring with the coloured bars on the inner ring representing the 6 conditions associated with these biomarkers that also have fatigue as a symptom.
GWAS associated with TPST1 and TNS1 are most commonly associated with fatigue-dominant PCS being present in 84% and 83% of patients 10. TPST1 is one of the top 100 prognostic 3D genomic biomarkers associated with the development of severe acute COVID-19 in all cohorts interrogated (Figure 6C).
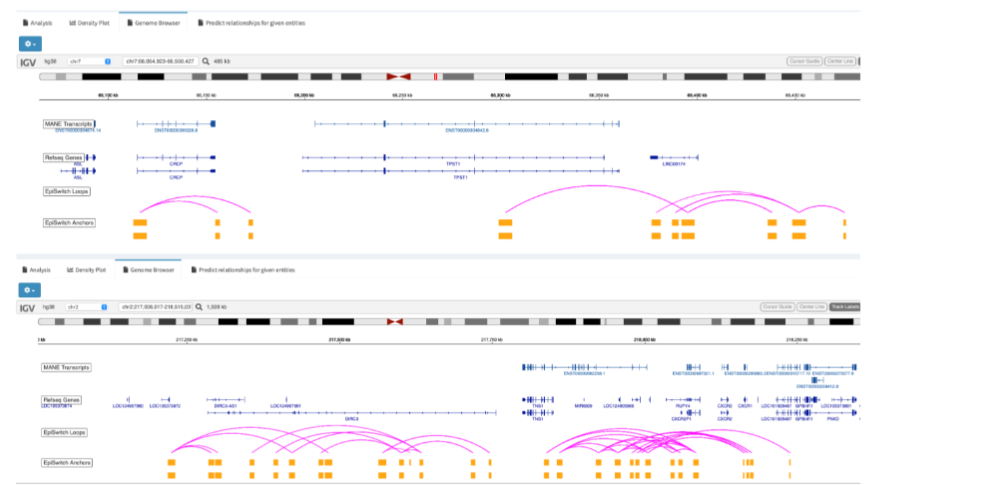
Figure 6C 3D genomic markers associated with TPST1 and TNS1, the top genetic loci associated with fatigue-dominant PCS 10 and also discriminating biomarkers for severe or mild acute COVID-19 infections. Note that each distinct biomarker (the loop between any two anchors in purple and gold respectively) at these loci can show different associations with phenotype and thus the precise annotation is important.
By contrast, TNS1 is discovered only in subsets of patient cohorts suggesting it might reflect certain sub-types of acute COVID disease. For each 3D biomarker associated with these genes, it is possible to use the EpiSwitch® Data and Knowledge Graph Space (Figure 6A) to produce networks of pathways, diseases and therapies (Figure 6D,E), to provide unbiased insights, and to clarify potential relationships between the acute infection and PCS. For example TPST1 is associated with hemostasis pathways, known to be associated with long COVID 66,67, while TNS1 reveals links to fatigue. This type of analysis helps to clarify the relationship between acute COVID infection and PCS, and to establish PCS as a defined state, potentially distinct from a slow post-infectious recovery in individual patients.
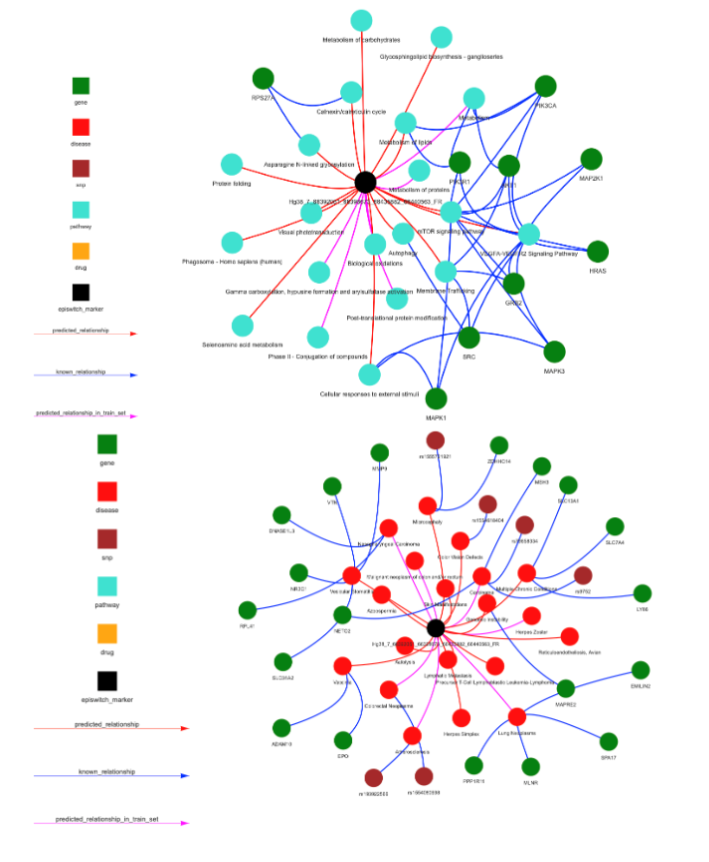
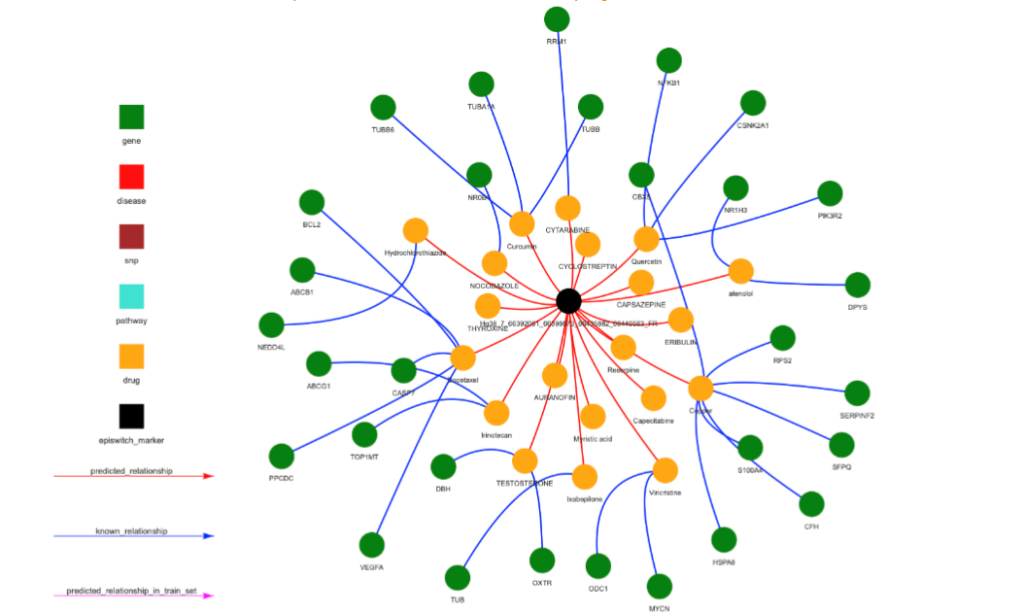
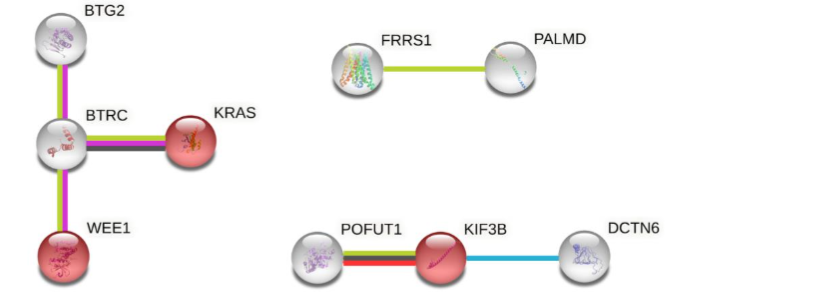
Figure 6D For each of the EpiSwitch CCSs associated with TPST1, networks representing pathways (top), diseases (middle) and therapies (drugs) (bottom) can be produced. Up to 30 recommendations are used to create the networks, if there are less than 30, genes are used to fill up the space. The 3 networks for the Hg38_7_66392051_66398673_66435882_66440563_FR 3D marker are shown.
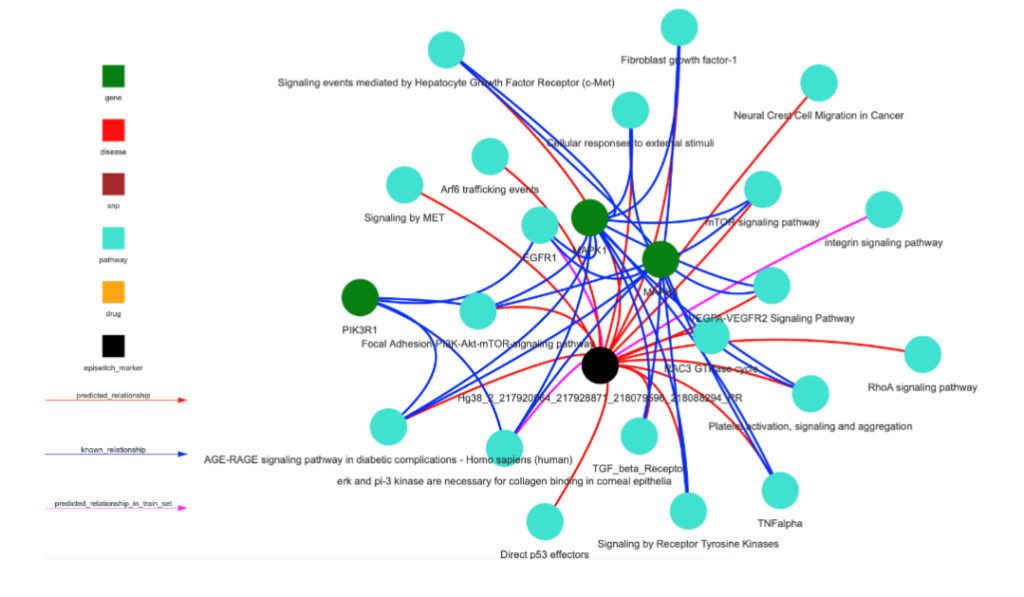
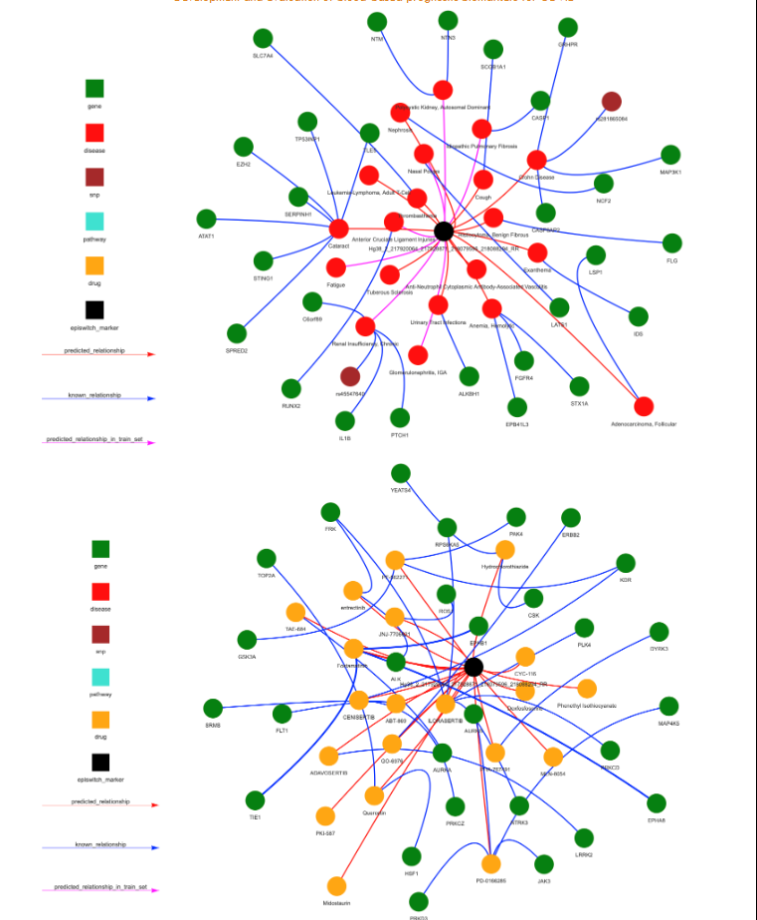
Figure 6E For each of the EpiSwitch CCSs associated with TNS1, networks representing pathways (top), diseases (middle) and therapies (drugs) (bottom) can be produced. Up to 30 recommendations are used to create the networks, if there are less than 30, genes are used to fill up the space. The 3 networks for the Hg38_2_217920064_217928871_218079596_218088294_RR marker are shown.
Discussion
COVID infections lead to highly heterogeneous courses of disease, from asymptomatic, mild or severe where there is a considerable risk of death. Although the SARS-CoV-2 viruses responsible for COVID-19 show genetic diversity, there is little evidence for the viral heterogeneity being responsible for disease heterogeneity. The genetics of the host, together with their environment, appear to be the major factors in defining disease severity. In the host, differently pre-programed innate immune cells coupled with differences in cellular responses from the very early stages of infection may underlie different outcomes. Indeed, blood samples collected from control patients involved in other studies, and before the onset of the COVID-19 pandemic, reveal high-risk profiles for severe disease in some individuals. This suggests that changes in the 3D genome are not emerging in response to COVID-19 infection, but rather represent a pre-existing default state, explaining how they can be used as prognostic biomarkers. These consistent 3D genomic states are present in patients regardless of when they were diagnosed with COVID-19, varying from very early pre-symptomatic to advanced disease, and the samples of blood or PBMCs taken.
The 3D genome is proposed to integrate genetic risk with the environmental factors that influence epigenetic modifications, sites of nascent transcription and metabolic signalling to reflect clinical outcome. Thus, differences in the conformation of the 3D genomic structure represent a novel class of molecular readouts to provide diagnostic, prognostic, and predictive patient stratifications in a wide range of therapeutic areas, including COVID-19. The robustness of 3D genomic biomarkers observed here is similarly observed in other clinical tests for response to immunotherapy treatment, prediction of response to treatment in rheumatoid arthritis, early prostate cancer detection, prognosis of DLBCL, diagnosis and prognosis of ALS, and early multi-choice cancer detection in canines.
The original 200 biomarkers associated with mild or severe COVID-19 infections were reduced to 21 using machine learning, and a subset of these markers translated into a MIQE-compliant qPCR-detectable format for use in the clinic. Analysis of the genes associated with these classifying biomarkers, including SWAP70 and genes involved in haemostasis and blood clotting, link prognostic changes in the 3D genome to known clinical outcomes. SWAP70, also known as DEF6, encodes a non-conventional guanine nucleotide exchange factor (GEF) which acts downstream of the T-cell receptor and binds and negatively regulates the transcription factor IRF4, which is required for isotype class switch recombination, differentiation of B cells into Ig-secreting plasma cells and their long-term survival. This finding is consistent with the recent reports of ongoing isotype switching in patients who are critically ill with COVID-19 and the association of differential immunoglobulin M (IgM)/IgG/IgA epitope diversity in mild or severe COVID-19, especially in patients who succumbed to SARS-CoV-2 infection. Genes involved in haemostasis and blood clotting are consistent with clinical reports of severe COVID-19 patients presenting clinically with a ‘microvascular injury syndrome’ with an associated procoagulant state as well as clinical reports of hypercoagulation in patients with severe COVID-19. The involvement of B-cell activation and haemostasis support systemic inflammation and the cardiovascular injury all lie at the root of the clinical symptomology seen in severe COVID-19 cases.
This analysis also identifies novel therapeutic strategies for managing COVID-19. Interestingly, several of the drugs identified here as potential therapeutic tools have been tested independently in clinical trials for COVID-19, including mTOR inhibitors (rapamycin and tacrolimus) and general immunosuppressants (dexamethasone and hydrocortisone). In addition, the signalling lipid prostaglandin E2 (PGE2), the cell signalling mediator calcium, the acute inflammatory phase cytokine CCL3 (also known as MIP1α) and the T-cell derived chemotactic cytokine CCL5 (also known as RANTES) are on a potential pathway for therapy. PGE2 exerts its cellular effects though binding to one of four cell membrane receptors (EP1-4). Binding to the EP1 or EP3 receptors increases intracellular calcium, while binding to EP2 and EP4 receptors triggers cyclic AMP mediated signalling events. While PGE2 can act as a potent anti-inflammatory ligand, inhibiting the production of CCL3 in dendritic cells in vivo and the production of CCL5 mRNA and protein expression in LPS-activated macrophages in vitro, it can also be proinflammatory in certain lung conditions such as COPD, lung cancer, and several viral infections. Elevated levels of PGE2 have been observed in SARS-CoV-2 infected patients and increased PGE2 has been postulated to correlate with enhanced COVID-19 severity in males. Although initial efforts at reducing PGE2 synthesis in COVID-19 through the use of non-steroidal anti-inflammatory drugs (NSAIDs) such as aspirin and ibuprofen have been controversial, our results suggest that prostaglandin signalling in immune cells may play an important role in mediating disease severity.
An interesting overlap exists between ME/CFS (a multisystem neuroimmune illness that includes profound fatigue, post-exertional malaise, and cognitive impairment) and PCS. The similarities include T-cell exhaustion, neuroinflammation, and vascular and endothelial dysfunction and dysautonomia. To date there is no diagnostic marker for ME/CFS, and the diagnosis remains clinical and often by exclusion of other causes. The pathways identified in this study may have potential utility in ME/CFS diagnosis and treatment. Prognosis of COVID-19 disease severity remains a valuable risk-mitigation tool for a significant part of the population, particularly those unwilling or unable to be vaccinated. The simple low-cost PCR-based assay described here using whole blood to predict disease severity has wide ranging applications. Advanced knowledge of likely disease severity can aid patients and their physicians. When applied on a larger scale, knowledge of pooled individual risk profiles can help health systems make informed decisions about staffing and infrastructure needs in the event of a pandemic resurgence.
Conclusions
This work demonstrates the utility and potential of systemic 3D-genomic biomarkers for the development of unbiased prognostic tests to predict severe disease outcomes, here illustrated for SARS-Cov-2 infection. Starting with a whole blood sample taken at the time of diagnosis, a predictive classifier model was developed, containing six 3D-genomic biomarkers able to stratify individuals at the highest risk of acute severe COVID disease, with a positive predictive value of 93% and balanced accuracy of 88%. 3D-genomic biomarkers represent genome regulation around particular genetic loci, affecting neighbouring genes and enabling detailed network and pathway analysis across the genome. As 964,631 data points per patient are generated on whole 3D-genome microarray at the point of screening, this rich dataset enables discovery and development of highly efficacious systemic biomarkers. Such biomarkers provide further insight into COVID-19 disease processes, confirm variability in host immune responses, provide evidence of systemic modulation beyond viral genetics or viral load as the primary determinant of disease outcome, and facilitate the discovery of therapeutic targets. The Data Knowledge and Graph Space analysis of multiomic network controls, linked to the genomic position of 3D-genomic biomarkers, reveals genetic risks, pathways and protein networks intertwined prognostically with severe COVID outcomes, which are also genetically linked to Post-COVID Syndrome (PCS), Chronic Fatigue Syndrome (CFS), and other conditions with a clinical manifestation of fatigue. All these conditions share significant aspects of abnormal 3D-genomic dysregulation. The EpiSwitch technology platform offers unbiased discovery of 3D-genomic biomarkers with diagnostic and prognostic powers, unique insights into debilitating disease conditions, and links each specific biomarker signature to a potential therapy, such as dexfosfoserine in patient cases with fatigue condition.
Declarations
E.H. and A.A. are full-time employees of, and J.M. acts as an advisor to, Oxford BioDynamics plc. The authors declare no other competing financial or other interests.
Author Contributions
EH, AA conceived the study, EH, JM and DP extended its analysis into biological and clinical outcomes associated with mild, severe and PCS, as well as molecular implications for ME/CFS. AA and JM wrote and reviewed the manuscript.
Supporting information
SUPPLEMENTAL TABLE 1 DATA AVAILABILITY The data that support the findings of this study are openly available and can be found on the Github repo: https://github.com/oxfordBiodynamics/medrxiv/tree/main/CST%20publication. The datasets used and/or analysed during the current study are available from the corresponding author on reasonable request.
CONSENT FOR PUBLICATION
Written informed consent for publication was obtained from all authors.
ETHICAL CONSENT AND GUIDELINES
All patients signed informed consent forms prior to providing blood samples. All ethical guidelines were followed.
Funding
This work was funded by Oxford BioDynamics plc.
Acknowledgements
The authors would like to thank members of OBD Reference Facility for help and support in preparing this manuscript.
References
- Hojyo S, Uchida M, Tanaka K, et al. How COVID-19 induces cytokine storm with high mortality. Inflamm Regen. 2020;40:37. doi:10.1186/s41232-020-00146-3
- Huang C, Wang Y, Li X, et al. Clinical features of patients infected with 2019 novel coronavirus in Wuhan, China. Lancet. Feb 15 2020;395(10223):497-506. doi:10.1016/S0140-6736(20)30183-5
- Cascella M, Rajnik M, Aleem A, Dulebohn SC, Di Napoli R. Features, Evaluation, and Treatment of Coronavirus (COVID-19). StatPearls. 2024.
- Berlin DA, Gulick RM, Martinez FJ. Severe Covid-19. N Engl J Med. Dec 17 2020;383(25):2451-2460. doi:10.1056/NEJMcp2009575
- Couzin-Frankel J. The mystery of the pandemic’s ‘happy hypoxia’. Science. May 1 2020;368(6490):455-456. doi:10.1126/science.368.6490.455
- Wang Z, Tang K. Combating COVID-19: health equity matters. Nat Med. Apr 2020;26(4):458. doi:10.1038/s41591-020-0823-6
- Chippa V, Aleem A, Anjum F. Postacute Coronavirus (COVID-19) Syndrome. StatPearls. 2024.
- Davis HE, McCorkell L, Vogel JM, Topol EJ. Long COVID: major findings, mechanisms and recommendations. Nat Rev Microbiol. Mar 2023;21(3):133-146. doi:10.1038/s41579-022-00846-2
- Liew F, Efstathiou C, Fontanella S, et al. Large-scale phenotyping of patients with long COVID post-hospitalization reveals mechanistic subtypes of disease. Nat Immunol. Apr 2024;25(4):607-621. doi:10.1038/s41590-024-01778-0
- Taylor K, Pearson M, Das S, Sardell J, Chocian K, Gardner S. Genetic risk factors for severe and fatigue dominant long COVID and commonalities with ME/CFS identified by combinatorial analysis. J Transl Med. Nov 1 2023;21(1):775. doi:10.1186/s12967-023-04588-4
- Driggs D, Selby I, Roberts M, et al. Machine Learning for COVID-19 Diagnosis and Prognostication: Lessons for Ampl