


Choline and Betaine’s Impact on Obesity and Gut Health
Gut microbiota and immunometabolic response to Choline and Betaine supplementation in a Mouse Model of Diet-Induced Obesity
Néstor D. Portela¹,², Natalia Eberhardt³,⁴,⁵, Gastón Bergero³,⁴, Yanina L. Mazzocco³,⁴, Maria P. Aoki³,⁴, Cristian Galván¹,², Roxana C. Cano²,⁴, Susana A. Pesoa¹
- Departamento de Diagnóstico Molecular, LACE Laboratorios, Córdoba, Argentina
- Unidad Asociada Área Ciencias Agrarias, IN-geniar, Ciencias Biológicas y de la Salud, Consejo Nacional de Investigaciones Científicas y Tecnológicas (CONICET), Facultad de Ciencias Químicas, Universidad Católica de Córdoba, Córdoba, Argentina
- Centro de Investigaciones en Bioquímica Clínica e Inmunología (CIBICI), Consejo Nacional de Investigaciones Científicas y Tecnológicas (CONICET), Córdoba X5000HUA, Argentina
- Departamento de Bioquímica Clínica, Facultad de Ciencias Químicas, Universidad Nacional de Córdoba
- Current address: Department of Medicine,Division of Cardiology, New York University,Cardiovascular Research Center, New York,University School of Medicine, New York,NY, United States
OPEN ACCESS
PUBLISHED: 31 August 2025
CITATION:Portela N.D., et al., 2025. Gut microbiota and immunometabolic response to Choline and Betaine supplementation in a Mouse Model of Diet-Induced Obesity.Medical Research Archives, [online] 13(8).
https://doi.org/10.18103/mra.v13i7.6877
COPYRIGHT: © 2025 European Society of Medicine. This is an open-access article distributed under the terms of the Creative Commons Attribution License, which permits unrestricted use, distribution, and reproduction in any medium, provided the original author and source are credited.
DOI https://doi.org/10.18103/mra.v13i7.6877
ISSN 2375-1924
Abstract
Obesity is a chronic, recurring and multifactorial disease characterized by systemic inflammation, visceral adipose tissue dysfunction and gut microbiota dysbiosis. While Omega-3 fatty acids have shown beneficial effects in this context, the potential of other dietary modulators remains underexplored. Our aim was to investigate the effects of dietary supplementation with choline and betaine on weight gain, gut microbiota composition and visceral immunometabolic profiles in a mouse model of diet-induced obesity. Mice fed with choline and betaine supplemented diets, exhibited significantly reduced weight gain compared to obesity fat diet, at weeks 4, 12 and 24 after differential feeding was started. Beta-diversity analyses revealed sustained divergence in microbial communities between diet groups. Fat diet supplemented with choline and betaine feeding generated enrichment of SCFA-producing taxa such as Parabacteroides, Oscillospira, Flavonifractor, Harryflintia and Christensenellaceae R7 group while Fat diet feeding promoted the expansion of pro-inflammatory genera such as Helicobacter and Negativibacillus. In parallel, in the choline and betaine supplementation group immune data point toward an anti-inflammatory visceral adipose tissue phenotype, with IL-10 skewed T regulatory cell signatures producing high levels of IL-10. Choline and betaine supplementation modulates the gut adipose immune axis by reshaping gut microbial community and enhancing host immunometabolic homeostasis. These findings support the potential of methyl-donor nutrients as dietary strategy to mitigate obesity-related inflammation and metabolic dysfunction. Multiblock analysis with DIABLO identified a coordinated microbial immune metabolic signature that distinguished diet groups, linking Fat diet supplemented with choline and betaine-enriched taxa with IL-10 producing Tregs and adiponectin levels. These findings highlight the systemic impact of choline and betaine supplementation.
Keywords: Obesity, choline, betaine, gut microbiota, visceral adipose tissue, methyl donors, short-chain fatty acids, regulatory T cells, diet-induced obesity, immunometabolism
1. Introduction
Obesity is a chronic, recurring and multifactorial disease associated with systemic low-grade inflammation, metabolic dysfunction and an increased risk of non-communicable diseases. A growing body of evidence implicates visceral adipose tissue (VAT) dysfunction and gut microbiota (GM) dysbiosis as critical contributors to obesity-related complications. VAT in obesity is marked by adipocyte hypertrophy, increased infiltration of pro-inflammatory immune cells such as M1 macrophages and reduced numbers of regulatory T cells (Tregs), resulting in a pro-inflammatory microenvironment that exacerbates metabolic disturbance.
Diet is a central modulator of both GM composition and host immunometabolic responses. In previous studies, we demonstrated that a sustained dietary supplementation with Omega-3 fatty acids modulates GM composition, favors anti-inflammatory immune profiles in VAT and improves metabolic markers in mice fed a medium-fat-content diet in a dose dependent manner. However, the search for additional dietary components capable of exerting beneficial metabolic and immunological effects remains a priority in obesity research.
Choline and betaine are methyl-donor nutrients involved in one-carbon metabolism, epigenetic regulation and lipid homeostasis. Both compounds have been shown to influence inflammation, lipid metabolism and intestinal barrier function. Moreover, their metabolism by the GM generates bioactive compounds that may modulate host physiology and immunity. Despite their recognized physiological roles, the potential of choline and betaine as modulators of the gut VAT immune axis in the context of diet induced obesity (DIO) remains underexplored.
In the present study, we used our established medium-fat-content mouse model of obesity maintaining a constant low dosage of Omega-3 content, to isolate the effects of choline and betaine supplementation. We aimed to assess the impact of these compounds on the GM composition and their influence on VAT immune cell populations, with a particular focus on Tregs. Additionally, we evaluated changes in metabolic biomarkers to gain insight on the potential systemic effects of these dietary interventions.
By integrating microbiota profiling, immune phenotyping in VAT and metabolic biomarkers, this exploratory study seeks to elucidate the role of choline and betaine in shaping immunometabolic responses in obesity. Our findings may contribute to the development of novel dietary strategies aimed at restoring metabolic balance and preventing adipose tissue inflammation in obesity.
2. Materials and Methods
2.1. ANIMALS AND EXPERIMENTAL DESIGN
Male C57BL/6J (B6) mice, 6 weeks old, were obtained from the Facultad de Ciencias Veterinarias, Universidad Nacional de La Plata (Buenos Aires, Argentina). All animals were housed in isolation rooms within the Animal Facilities of the Facultad de Ciencias Químicas, Universidad Católica de Córdoba. Mice were randomly assigned to two groups (n = 4 per group) and were allowed to acclimate to the experimental conditions for two weeks. Following this period, animals were fed for 24 weeks with one of the following diets: Obesity-Inducing Diet (FD): 11% fat, 28% protein, 4.5% crude fiber and 7.5% total minerals (TIT Can Gross) or Obesity-Inducing Diet supplemented with choline and betaine (FDCB): 16% fat, 26% protein, 3% crude fiber and 7% total minerals (Sieger Pet Foods).
All groups were maintained under standard housing conditions, including a 12-hour light/dark cycle, controlled temperature (21 ± 2 °C) and ad libitum access to food and water. Food was replaced every two days to ensure freshness. This study was approved by the Institutional Committee for the Care and Use of Laboratory Animals (CICUAL) of the Facultad de Ciencias Químicas, Universidad Nacional de Córdoba (Resolution No. 939, EXP-UNC: 0023836/2018). Environmental conditions were maintained according to CICUAL guidelines. All experimental procedures adhered to the Directive 2010/63/EU of the European Parliament on the protection of animals used for scientific purposes.
2.2. EVALUATION OF OBESITY DEVELOPMENT
Body weight was measured at weeks 0, 4, 12 and 24 after the start of differential feeding. DIO was defined as a body weight exceeding the mean at week 0 plus three standard deviations across all groups.
2.3. GUT MICROBIOTA ANALYSIS
Fecal samples were collected individually in metabolic cages at week 0, 4, 12 and 24, immediately frozen and stored at -40 °C until analysis. DNA was extracted from 220 mg of feces under sterile conditions using the QIAamp DNA Stool Mini Kit (Qiagen, Germantown, MD, USA), following the manufacturers protocol. Extracted DNA was stored at -40 °C. Microbial profiling was conducted using the Ion 16S Metagenomics Kit and sequenced on the Ion Torrent PGM platform (Thermo Fisher Scientific). A mock community composed of ATCC bacterial strains was included as a sequencing control. Data processing was carried out in R v4.1.2 using DADA2 (v1.22.0), phyloseq (v1.38.0) and microbiome (v1.16.0) packages. Taxonomic assignment was based on the SILVA database v138.1 (updated March 2021). Sequencing data are available in the NCBI BioProject database (accession number: PRJNA1292224).
2.4. BLOOD METABOLIC PROFILE AND VAT IMMUNE CELL EVALUATION
At week 24, mice were anesthetized with inhaled isoflurane (FORANE). After 8 hours of fasting, blood was collected via cardiac puncture into heparinized tubes, centrifuged (3000 rpm, 5 min) and plasma was stored at -20 °C. Plasma concentrations of glucose, triglycerides, total cholesterol, AST, ALT, total proteins and albumin were determined using a COBAS 8000 autoanalyzer (Roche Diagnostics). Adiponectin and leptin levels were measured using ELISA kits (Abcam and Invitrogen, respectively), following the manufacturers instructions. Following blood collection, mice were euthanized by cervical dislocation and visceral adipose tissue (VAT) was collected for stromal vascular fraction (SVF) analysis. Epididymal adipose tissue was processed as described by Portela et al. Surface markers included: CD11b (PeCy5), F4/80 (PeCy7), CD45 (APC) and CD4 (APC-Cy7). Intracellular markers included FOXP3 (PerCp-Cy5.5) and IL-10 (PE), following permeabilization with BD Cytofix/Cytoperm. Samples were acquired on a FACS Canto II cytometer (BD Biosciences) and data were reported as percentage of positive cells.
2.5. STATISTICAL ANALYSIS
All statistical analyses and visualizations were conducted using R software v4.1.2. Data normality was assessed using the Shapiro-Wilk test. For comparisons between two groups, t-test or Wilcoxon test was used depending on data distribution. For analyses involving more than two groups, ANOVA or Kruskal-Wallis tests were applied. When significant differences were found, post hoc pairwise comparisons were performed using the t-test (after ANOVA) or Wilcoxon signed-rank test (after Kruskal-Wallis), with Bonferroni correction for multiple testing. A p-value < 0.05 was considered statistically significant. Data visualization was carried out using the ggplot2 v3.4.0 and ggpubr v0.5.0 packages. Alpha diversity metrics (Observed ASVs, Chao1, Shannon, Simpson) and beta diversity (weighted and unweighted UniFrac) were calculated using the microbiome package v1.6.0. Differences in microbiota composition between dietary groups were evaluated with ANOSIM. Differential abundance analysis was performed using LEfSe via the microbiomeMarker package v1.9.0, considering features significant when LDA scores ≥3 and p<0.05. Correlation analyses were conducted using the corrplot package v0.9.2. A multiblock integrative analysis was conducted using the DIABLO (Data Integration Analysis for Biomarker discovery using Latent Components) framework, implemented in the mixOmics package v6.20.0. This method enabled the identification of correlated features across gut microbiota, immune, and metabolic datasets, facilitating the discrimination between dietary groups (FD vs. FDCB). Model tuning was performed through cross-validation to determine the optimal number of components and selected variables per block. Circus plots and relevance networks were used to visualize the key multi-omic correlations driving group separation.
3. Results
3.1 EFFECT OF DIETS ON THE BODY WEIGHT OF MICE
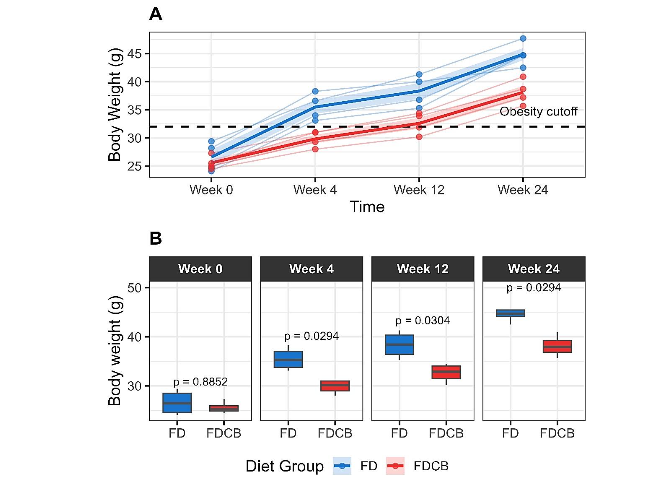
Body weight increased progressively in both groups of mice over the 24-week period, but the increase of weight in FD-fed mice was consistently higher than in FDCB fed mice (Figure 1A). At baseline (Week 0), there was no significant difference between the two groups; however, after four weeks of differential feeding, FD-fed mice exhibited significantly higher weight than their FDCB-fed counterparts. This trend persisted at both 12 and 24 weeks (Figure 1B). Notably, from Week 4 onward, 100% of FD-fed mice had developed obesity, whereas this proportion was only reached in the FDCB group after 24 weeks of feeding.
3.2 GUT MICROBIOTA ANALYSIS
3.2.1 Alpha diversity
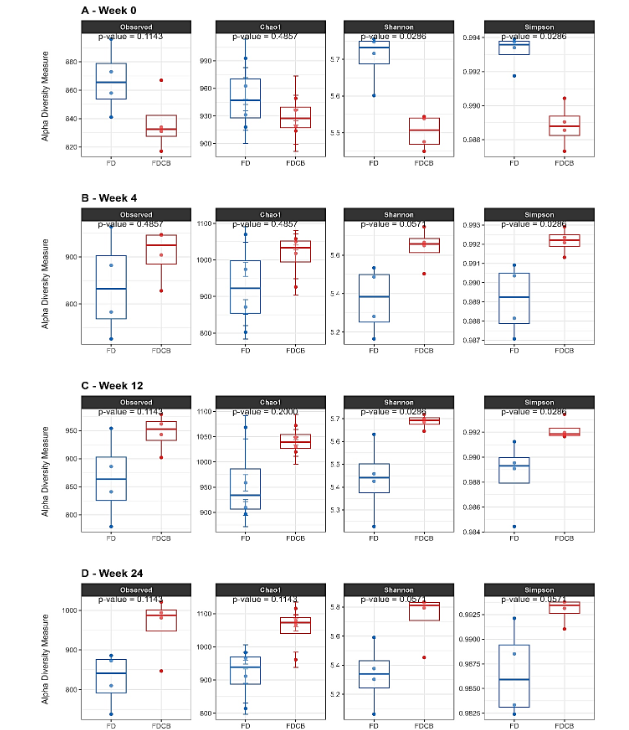
A comprehensive comparison of Alpha diversity between FD and FDCB fed mice showed that, at baseline (week 0), richness metrics did not differ significantly (Observed ASVs and Chao1 indexes), while diversity indices were slightly higher in FD fed group (Shannon and Simpson). By week 4, only the Simpson index remained significantly elevated in the FD group, whereas Observed ASVs, Chao1 and Shannon, showed no differences. At Week 12, FD fed mice again displayed higher Shannon and Simpson indices, but no differences in Observed ASVs or Chao1. Finally, after 24 weeks of differential feeding, none of the Alpha diversity measures differed significantly between groups (Figure 2).
3.2.2 Beta diversity
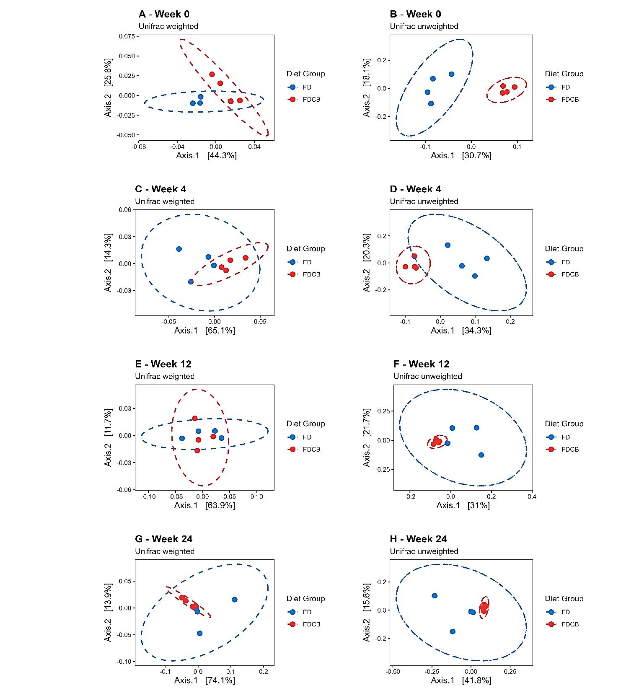
To evaluate the effects of dietary choline and betaine on gut microbiota dynamics, we performed principal coordinates analysis (PCoA) using unweighted and weighted UniFrac distances at weeks 0, 4, 12 and 24. In the unweighted UniFrac PCoA (Figure 3 B, D, F, H), samples were intermixed at week 0 but formed two well-separated clusters at weeks 4, 12 and 24, indicating that presence absence differences in low-abundance taxa underlie the diet effect. Weighted UniFrac PCoA (Figure 3 A, C, E, G), which accounts for relative abundance, also showed no grouping at baseline and clear separation at Weeks 4 and 12; however, at week 24 the clusters overlapped partially, suggesting that differences in dominant taxa had narrowed even though rare taxa continued to discriminate the diets. Supplementary Table S3 shows results of ANOSIM statistic values.
3.3 DIFFERENTIAL ANALYSIS OF GUT MICROBIOTA
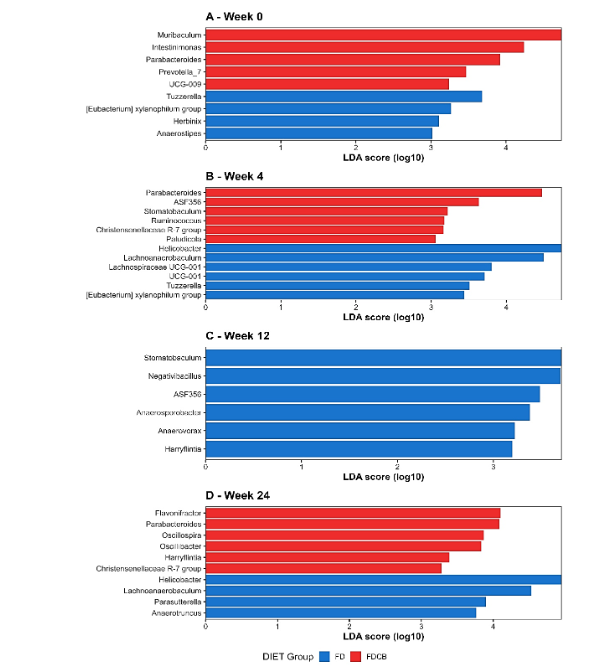
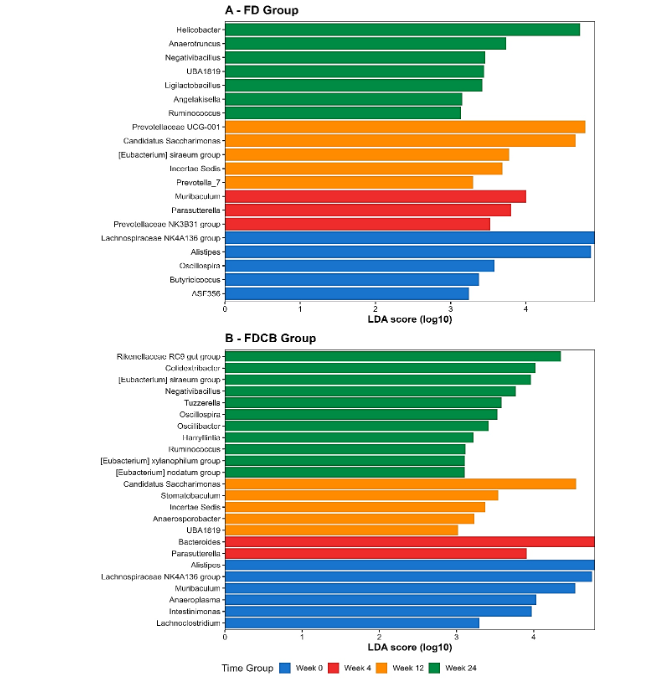
Differential abundance analysis using LEfSe was performed to identify microbial biomarkers associated with diet and time. The first analysis compared the FD and FDCB diet groups at different time points (weeks 0, 4, 12 and 24). At each time point, distinct microbial features were identified as differentially abundant between the two groups. From week 4 onwards, the number and magnitude of these differences increased, indicating a progressive divergence in microbial composition between diets groups (Figure 4A-D).
The second analysis assessed longitudinal changes within each diet group. In both FD and FDCB groups, specific microbial profiles were observed at each time point. In the FD group, the most pronounced differences were detected at the later stages of the experiment. In the FDCB group, significant temporal shifts were observed, with several biomarkers unique to each time point (Figure 5A-B).
3.4 METABOLIC STATUS AND IMMUNE CELL POPULATIONS PROFILING IN VISCERAL ADIPOSE TISSUE
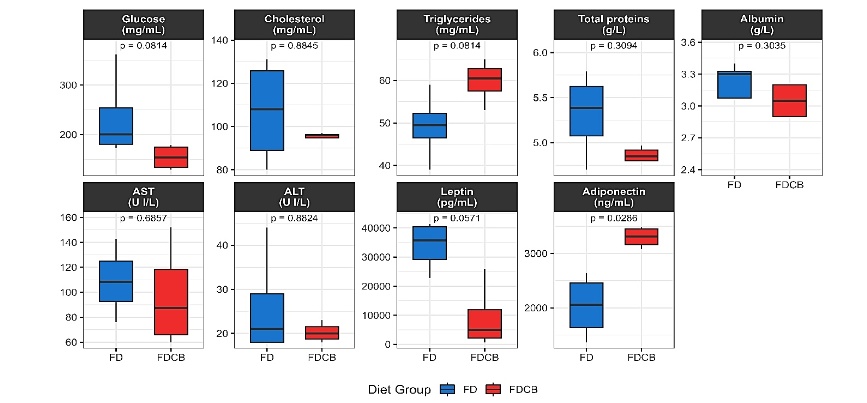
Metabolic profiling at week 24 revealed that most serum parameters did not differ significantly between FD and FDCB fed mice (Figure 6). Glucose tended to be lower in FDCB animals, but this drop did not reach significance. Cholesterol was unchanged; triglycerides showed a modest increase under FDCB, total proteins and albumin were also comparable. Liver enzymes AST and ALT showed no diet related elevations. In contrast, the two adipokines measured diverged markedly: Leptin was substantially lower in FDCB fed mice and Adiponectin was significantly higher in this group.
Immune phenotyping of VAT at week 24 demonstrated diet-specific shifts in Tregs markers, whereas the myeloid cell subsets remained largely unaffected (Figure 7). The overall frequency of CD4⁺ T cells (% CD45⁺ CD4⁺) was lower in FDCB-fed mice compared with FD controls, but this did not reach statistical significance. In contrast, the proportion of FOXP3⁺ Tregs (% CD45⁺ CD4⁺ FOXP3⁺) was markedly reduced by FDCB feeding, while the fraction of IL-10 producing Tregs (% CD45⁺ CD4⁺ FOXP3⁺ IL-10⁺) trended lower in FDCB mice, but this difference was not significant. Strikingly, the per cell expression of IL-10 (MFI) in the FOXP3⁺ subset was substantially higher under FDCB versus FD, indicating that although lower in number, FDCB Tregs produce more IL-10 per cell. By contrast, markers of the myeloid lineage and F4/80+ macrophages were unaffected.
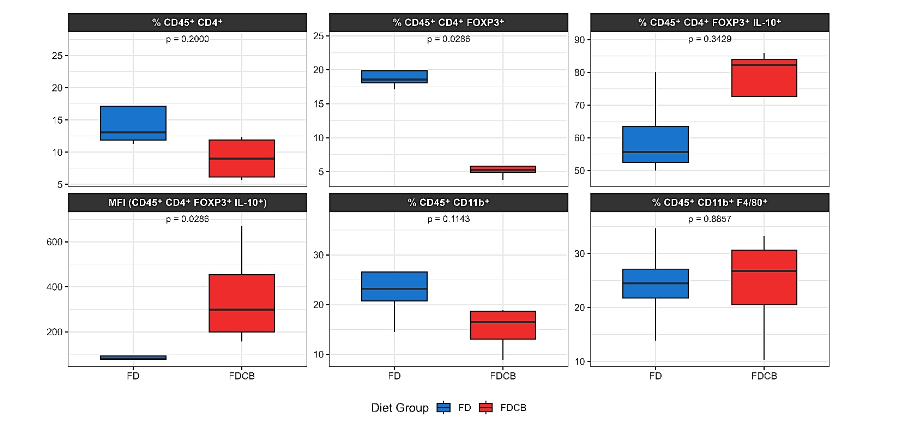
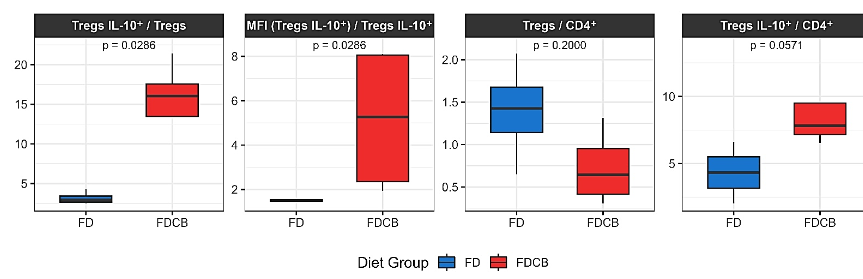
Figure 8. Boxplots represent the proportions and fluorescence based ratios of IL-10⁺ Tregs in mice fed a FD (blue) or a FDCB (red) at week 24. Shown are: the percentage of IL-10⁺ Tregs among total Tregs, IL-10 median fluorescence intensity (MFI) per IL-10⁺ Treg, Treg/CD4⁺ ratio and IL-10⁺ Tregs per CD4⁺ T cells.
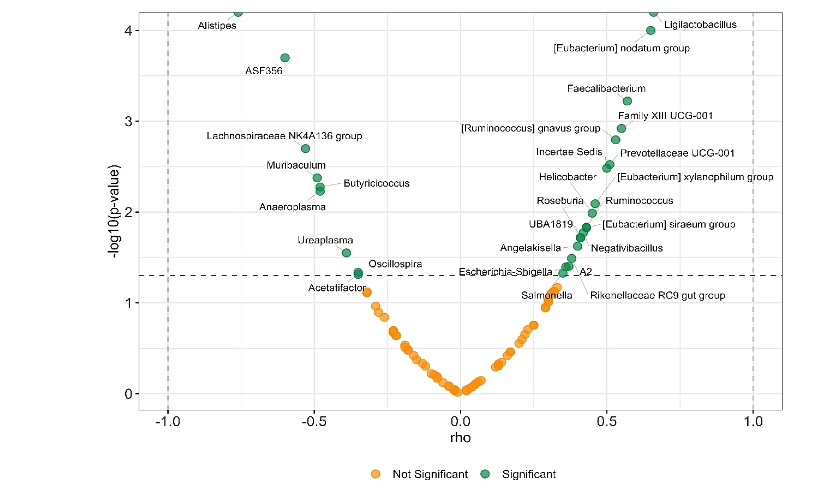
3.5 CORRELATION BETWEEN GUT MICROBIOTA COMPOSITION AND BODY WEIGHT
The relationship between animal body weight and the relative abundance of bacterial genera is presented in Figure 9. A subset of taxa showed statistically significant associations (p < 0.05, green dots), with notable positive correlations observed for genera such as Ligilactobacillus, [Eubacterium] nodatum group, Faecalibacterium, Roseburia, and [Ruminococcus] gnavus group, among others. These microorganisms were associated with increased body weight. Conversely, significant negative correlations were observed for genera such as Alistipes, ASF356, Muribaculum, Butyricicoccus and Anaeroplasma, whose lower abundance was related to higher body weight.
3.5.1 Integrative immuno-metabolic and microbiota analysis using DIABLO multiblock framework
To explore coordinated responses across microbiota composition, immune profiles in VAT and systemic metabolic parameters, we applied a DIABLO integrative multiblock analysis. The model robustly discriminated mice according to diet (FD vs. FDCB), achieving clear group separation across all three data blocks: microbiota, immunity and metabolism (Supplementary Figure S1). Variable loading plots revealed that the genera Harryflintia, Lachnospiraceae UCG-009, Oscillibacter, Oscillospira and Flavonifractor contributed most strongly to the microbiota signature of FDCB fed mice. In contrast, Helicobacter was uniquely enriched in FD animals considering Component 1. Immune variables that drove separation included elevated IL-10 expression on Tregs (Tregs IL-10⁺/Tregs and MFI (Tregs IL10⁺) in FDCB mice, whereas the overall Tregs percentage was higher in the FD group. On the metabolic axis, FDCB mice were associated with higher adiponectin and triglycerides, while FD mice showed higher leptin, glucose and total protein levels.
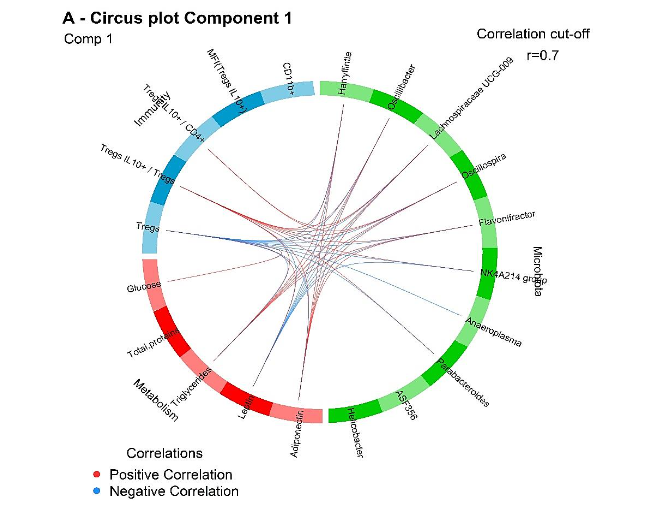
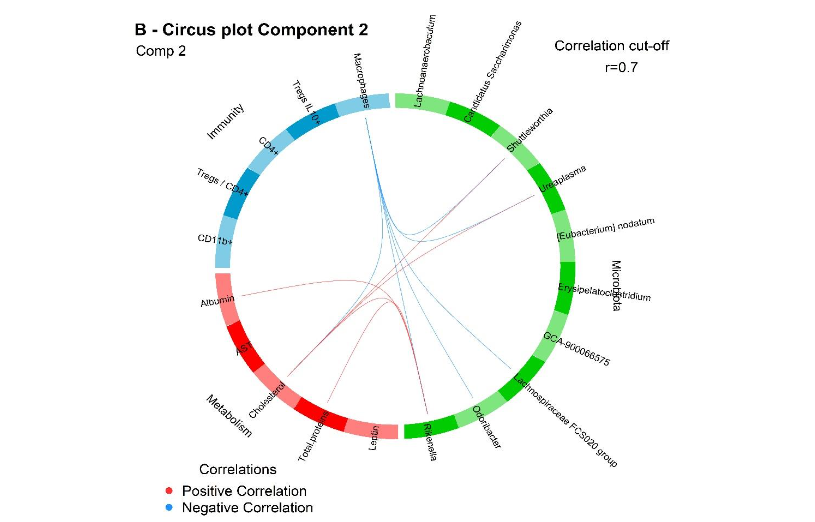
Figure 10. Circus plots from the multiblock DIABLO analysis showing correlations (|r| > 0.7) among discriminant variables from microbiota (green), metabolic (red) and immune (blue) blocks. (A) Component 1; (B) Component 2. Red ribbons indicate positive correlations, while blue ribbons indicate negative correlations. Only variables with high contributions to group separation are included.
Discussion
Our findings demonstrate that dietary supplementation with choline and betaine exerts beneficial, multi-layered effects in a mouse model of DIO, including delayed weight gain, modulation of gut microbiota composition, improved adipokine profiles and the emergence of anti-inflammatory immune signatures in VAT. This exploratory study supports the growing notion that methyl-donor nutrients can influence host immunometabolic homeostasis by acting through the gut VAT immune axis.
FDCB fed mice exhibited significantly reduced body weight gain across the 24-week period, despite similar caloric intake to FD fed controls, highlighting a marked delay in obesity onset associated with choline and betaine supplementation. This observation aligns with previous reports suggesting that choline and betaine modulate energy metabolism through epigenetic regulation of genes involved in lipid handling, insulin sensitivity and adipogenesis such as PPARγ and FASN. Beyond body weight, FDCB fed mice showed lower serum leptin and higher adiponectin levels, consistent with improved adipocyte function and systemic metabolic tone.
Another key anti-inflammatory mechanism induced by choline/betaine is elevation of IL-10, an anti-inflammatory cytokine closely tied to regulatory immune responses in VAT. While IL-10 is not an adipokine per se, its production by immune cells in adipose tissue and gut is enhanced indirectly via the microbiota and metabolite changes brought by choline and betaine. In DIO mice, improved metabolic status often correlates with higher production of IL-10, reflecting a reduction in systemic inflammation and suggesting remodeling of immune regulation toward fewer but functionally enhanced Tregs. This can be partly attributed to SCFAs produced by gut microbes; these metabolites stimulate differentiation of Tregs which secrete IL-10, thereby buffering obesity-related inflammation. Butyrate, for instance, has been shown to upregulate FOXP3 in Tregs and drive IL-10 production, while concurrently suppressing pro inflammatory Th17 cells.
Therefore, by promoting a gut environment rich in SCFAs (through microbiota changes), choline and betaine supplementation can increase IL-10 and other anti-inflammatory mediators. Indeed, experimental evidence suggests that SCFAs and their downstream signals (e.g. GPR41/43 receptors and HDAC inhibition) induce Tregs and IL-10, contributing to reduced adipose and systemic inflammation.
Microbiota analysis in samples taken 24 weeks post diet revealed that FDCB feeding led to the enrichment of genera with known SCFA producing or immunomodulatory capacities, these includes Parabacteroides, Oscillospira, Flavonifractor, Harryflintia, and Christensenellaceae R7 group. Besides, these taxa have been associated with metabolic flexibility, mucosal integrity and lean phenotypes in both preclinical and human studies. Moreover, Parabacteroides and Alistipes genera have consistently been associated with reduced adiposity, lean phenotypes, anti-inflammatory properties, increased mucin production and enhanced intestinal barrier function supporting that the FDCB diet fosters a gut microbial environment conducive to metabolic resilience. Conversely, genera enriched in the FD group (Helicobacter, Negativibacillus) have been linked to pro-inflammatory phenotypes and adverse metabolic profiles.
The systems level implications of these shifts were captured using a multiblock integrative approach. The DIABLO model robustly discriminated mice by diet across gut microbiota, immune and metabolic domains. Taxa enriched in FDCB fed group (Flavonifractor, Lachnospiraceae UCG-009, Oscillibacter, Oscillospira, Harryflintia) showed strong positive correlations with IL-10 producing Tregs and adiponectin levels, key hallmarks of anti-inflammatory and metabolically protective states. This integrative analysis underscores that choline and betaine supplementation does not exert isolated effects, but rather orchestrates a coordinated remodeling of host microbe interactions that spans immune and metabolic compartments. The ability of DIABLO to identify key cross-domain drivers highlights the potential of using gut microbial features as biomarkers of dietary response or targets for precision nutrition strategies.
Importantly, while our findings support the therapeutic potential of choline and betaine, caution is warranted due to the possible production of trimethylamine (TMA) and its pro-atherogenic derivative, trimethylamine N-oxide (TMAO). The production of TMA from choline depends on microbiota composition and is driven by specific taxa such as Clostridia, Desulfovibrio and Enterobacteriaceae. In contrast, certain Bacteroides species may limit TMA generation. Thus, the cardiometabolic safety of choline/betaine supplementation may require individual microbiota profiling or co-interventions (e.g., TMA-lyase inhibitors or SCFA-enhancing probiotics) to minimize TMAO related risks.
Our findings are consistent with recent clinical observations. A 2024 population-based study in China reported that individuals in the highest quartile of dietary betaine intake had significantly lower BMI, reduced hip circumference and decreased obesity prevalence. Furthermore, ongoing clinical trials (e.g., NCT06758856) are exploring the impact of choline-betaine supplementation on microbiota and metabolic outcomes in overweight adults, underscoring the translational relevance of our findings.
Beyond serving as a mediator of downstream metabolic and immune effects, the gut microbiota emerges in this study as a central hub through which choline and betaine exert their systemic influence. The distinct microbial signatures observed in FDCB fed mice, particularly the enrichment of SCFA-producing and immunoregulatory taxa, suggest that modulation of microbial community structure is not merely a consequence but a key mechanism of dietary intervention. These microbial changes may precede or even initiate host immunometabolic remodeling, positioning the microbiota as a therapeutic target in itself. Future mechanistic studies employing microbiota transfer or gnotobiotic models will be essential to unravel causality and identify specific microbial consortia or metabolites responsible for the observed effects. Moreover, the predictive value of microbial profiles uncovered through DIABLO integration reinforces the relevance of microbiota-based biomarkers for stratifying dietary responders and guiding precision nutritional interventions in obesity management.
While our results highlight biologically meaningful shifts in gut microbial composition, driving immune regulation in VAT and metabolic outcomes, it is important to acknowledge that this is an exploratory pilot study with a small sample size. Nevertheless, the consistency of the trends observed across multiple biological layers adds robustness to the integrative model and supports the rationale for conducting larger scale, longitudinal studies to validate and expand upon these observations.
5. Conclusion
In conclusion, the FDCB diet promotes a favorable shift in gut microbial ecology, enriches immune-regulatory taxa and enhances systemic metabolic parameters, notably through the expansion of SCFA producers and IL-10 associated Tregs. The use of DIABLO modeling reveals coherent microbiota immune metabolism interactions that may underpin these effects and supports the rationale for microbiota informed dietary interventions. Given the exploratory nature of this study and the limited number of animals per group, these results should be considered hypothesis generating. Larger, powered studies will be essential to confirm these findings and determine their translational relevance.
Supplementary Materials:
Supplementary Table S1A: Body weight analysis; Supplementary Table S2: Alpha diversity analysis; S3: Beta diversity analysis; Supplementary Table S4: Blood metabolic parameters analysis; Supplementary Table S4: Differential bacterial taxa identified by LEfSe analysis across dietary groups at different time points. Supplementary Table S5: Differential bacterial genera identified by LEfSe analysis across time points in response to dietary interventions. Supplementary Table S6. Circulating metabolic parameters in mice after 24 weeks of dietary intervention. Supplementary Table S7. Immune cell populations in the stromal vascular fraction of visceral adipose tissue after 24 weeks of dietary intervention. Supplementary Table S8. Correlation between bacterial genera and body weight. Supplementary Figure S1. Discrimination of diet groups across data blocks in DIABLO analysis. Supplementary Figure S2. Variable contributions from each data block (microbiota, immunity, and metabolism) to the DIABLO integrative model components.
Author Contributions:
Conceptualization, N.D.P., R.C.C., and S.A.P.; methodology, N.D.P., N.E., G.B., Y.L.M. and R.C.C.; software, N.D.P. and N.E.; validation, N.D.P., R.C.C., and S.A.P.; formal analysis, N.D.P.; investigation, N.D.P. and S.A.P; resources, C.A.G., R.C.C., M.P.A., and S.A.P.; data curation, N.D.P; writing original draft preparation, N.D.P. and S.A.P.; writing review and editing, C.A.G., R.C.C., M.P.A., and S.A.P.; visualization, N.D.P. and S.A.P.; supervision, R.C.C., M.P.A., and S.A.P.; project administration, R.C.C. and M.P.A.; funding acquisition, C.A.G., R.C.C., M.P.A., and S.A.P.. All authors have read and agreed to the published version of the manuscript.
Funding:
This work was supported in part by funding granted by Secretaría de Investigación y Vinculación Tecnológica from Universidad Católica de Córdoba. Accredited project: Nutritional Quality, a key factor that modulates the composition of the intestinal microbiota and the metabolic immune response in models of obesity. RR 2267-19. This work was supported in part by funding granted by Secretaría de Ciencia y Tecnología from Universidad Nacional de Córdoba (SECyT). Accredited projects: (A) Influence of nutritional quality, innate immunity, and acute infection with Trypanosoma cruzi in a diet-induced obesity model. Impact on development/prevention of non-communicable chronic diseases. Amount Res. SECyT-UNC 411/2018. (B) Identification of mononuclear cell metabolic state in T. cruzi infection and its impact on the inflammatory response. SECyT-UNC 113/2018. This work was supported in part by LACE Laboratories SA.
Institutional Review Board Statement:
This research has the authorization of the Institutional Committee for the Care and Use of Laboratory CICUAL-FCQ Universidad Nacional de Córdoba, Córdoba, Argentina. RESOLUTION N° 939, EXP-UNC:0023836/2018.
Informed Consent Statement:
Not applicable.
Data Availability Statement:
Sequencing data are accessible in the National Center for Bio-technology Information (NCBI) database under BioProject accession number PRJNA1292224.
Acknowledgments:
The authors acknowledge Eduardo Fernandez for continued support. The authors thank Pilar Crespo and Paula Abadie for the technical assistance at the CIBICI-CONICET FACS facility. M.P.A. is a member of the scientific community of Consejo Nacional de Investigaciones Científicas y Técnicas de la República Argentina (CONICET). Y.L.M. and G.B. thank CONICET for the fellowships.
Conflicts of Interest:
The authors declare no conflict of interest.
References:
- Bray GA, Kim KK, Wilding JPH, World Obesity Federation. Obesity: a chronic relapsing progressive disease process. A position statement of the World Obesity Federation. Obes Rev. 2017;18(7):715-723. doi:10.1111/obr.12551
- Weisberg SP, McCann D, Desai M, Rosenbaum M, Leibel RL, Ferrante AW. Obesity is associated with macrophage accumulation in adipose tissue. J Clin Invest. 2003;112(12):1796-1808. doi:10.1172/JCI200319246
- Chait A, den Hartigh LJ. Adipose Tissue Distribution, Inflammation and Its Metabolic Consequences, Including Diabetes and Cardiovascular Disease. Frontiers in Cardiovascular Medicine. 2020;7. Accessed July 25, 2023. https://www.frontiersin.org/articles/10.3389/fcvm.2020.00022
- Bradley D, Deng T, Shantaram D, Hsueh WA. Orchestration of the Adipose Tissue Immune Landscape by Adipocytes. Published online February 12, 2024. doi:10.1146/annurev-physiol-042222-024353
- Castoldi A, Naffah de Souza C, Câmara NOS, Moraes-Vieira PM. The Macrophage Switch in Obesity Development. Front Immunol. 2016;6:637. doi:10.3389/fimmu.2015.00637
- Feuerer M, Herrero L, Cipolletta D, et al. Lean, but not obese, fat is enriched for a unique population of regulatory T cells that affect metabolic parameters. Nature Medicine. 2009;15(8):930-939. doi:10.1038/nm.2002
- Nishimura S, Manabe I, Nagasaki M, et al. CD8+ effector T cells contribute to macrophage recruitment and adipose tissue inflammation in obesity. Nat Med. 2009;15(8):914-920. doi:10.1038/nm.1964
- Zatterale F, Longo M, Naderi J, et al. Chronic Adipose Tissue Inflammation Linking Obesity to Insulin Resistance and Type 2 Diabetes. Front Physiol. 2020;10:1607. doi:10.3389/fphys.2019.01607
- Agans R, Gordon A, Kramer DL, Perez-Burillo S, Rufián-Henares JA, Paliy O. Dietary Fatty Acids Sustain the Growth of the Human Gut Microbiota. Appl Environ Microbiol. 2018;84(21):e01525-18. doi:10.1128/AEM.01525-18
- Daniel H, Gholami AM, Berry D, et al. High-fat diet alters gut microbiota physiology in mice. ISME J. 2014;8(2):295-308. doi:10.1038/ismej.2013.155
- Shen W, Gaskins HR, McIntosh MK. Influence of dietary fat on intestinal microbes, inflammation, barrier function and metabolic outcomes. J Nutr Biochem. 2014;25(3):270-280. doi:10.1016/j.jnutbio.2013.09.009
- Xu AA, Kennedy LK, Hoffman K, et al. Dietary Fatty Acid Intake and the Colonic Gut Microbiota in Humans. Nutrients. 2022;14(13):2722. doi:10.3390/nu14132722
- Schoeler M, Caesar R. Dietary lipids, gut microbiota and lipid metabolism. Rev Endocr Metab Disord. 2019;20(4):461-472. doi:10.1007/s11154-019-09512-0
- Portela ND, Galván C, Sanmarco LM, et al. Omega-3-Supplemented Fat Diet Drives Immune Metabolic Response in Visceral Adipose Tissue by Modulating Gut Microbiota in a Mouse Model of Obesity. Nutrients. 2023;15(6):1404. doi:10.3390/nu15061404
- Portela ND, Eberhardt N, Bergero G, et al. Dietary Omega-3 Supplementation Shapes Gut Microbiota and Regulates Immunometabolism in a Mouse Model of Obesity. Medical Research Archives. 2025;13(5). doi:10.18103/mra.v13i5.6623
- Choi SW, Friso S. Modulation of DNA methylation by one-carbon metabolism: a milestone for healthy aging. Nutr Res Pract. 2023;17(4):597-615. doi:10.4162/nrp.2023.17.4.597
- Sivanesan S, Taylor A, Zhang J, Bakovic M. Betaine and Choline Improve Lipid Homeostasis in Obesity by Participation in Mitochondrial Oxidative Demethylation. Front Nutr. 2018;5:61. doi:10.3389/fnut.2018.00061
- Chen Q, Wang Y, Jiao F, et al. Betaine inhibits Toll-like receptor 4 responses and restores intestinal microbiota in acute liver failure mice. Scientific Reports. 2020;10(1):21850. doi:10.1038/s41598-020-78935-6
- Zhao G, He F, Wu C, et al. Betaine in Inflammation: Mechanistic Aspects and Applications. Front Immunol. 2018;9:1070. doi:10.3389/fimmu.2018.01070
- Ellacott KLJ, Morton GJ, Woods SC, Tso P, Schwartz MW. Assessment of feeding behavior in laboratory mice. Cell Metab. 2010;12(1):10-17. doi:10.1016/j.cmet.2010.06.001
- Callahan BJ, McMurdie PJ, Rosen MJ, Han AW, Johnson AJA, Holmes SP. DADA2: High resolution sample inference from Illumina amplicon data. Nat Methods. 2016;13(7):581-583. doi:10.1038/nmeth.3869
- McMurdie PJ, Holmes S. phyloseq: An R Package for Reproducible Interactive Analysis and Graphics of Microbiome Census Data. PLOS ONE. 2013;8(4):e61217. doi:10.1371/journal.pone.0061217
- Leo Lahti S. microbiome R package. Published online 2019. http://microbiome.github.io
- Quast C, Pruesse E, Yilmaz P, et al. The SILVA ribosomal RNA gene database project: improved data processing and web-based tools. Nucleic Acids Research. 2013;41(D1):D590-D596. doi:10.1093/nar/gks1219
- R Core Team. R Core Team (2022). R: A language and environment for statistical computing. Published online 2021. https://www.R-project.org/.
- Wickham H. ggplot2: Elegant Graphics for Data Analysis. 2016. Accessed January 25, 2023. https://link.springer.com/book/10.1007/978-3-319-24277-4
- Kassambara A. ggpubr: ggplot2 Based Publication Ready Plots. R package version 0.5.0. Published online 2022. https://CRAN.R-project.org/package=ggpubr
- Cao Y, Dong Q, Wang D, Zhang P, Liu Y, Niu C. microbiomeMarker: an R/Bioconductor package for microbiome marker identification and visualization. Bioinformatics. 2022;38(16):4027-4029. doi:10.1093/bioinformatics/btac438
- Wei T, Simko V. R package corrplot: Visualization of a Correlation Matrix. Published online 2021. https://github.com/taiyun/corrplot.
- Rohart F, Gautier B, Singh A, Cao KAL. mixOmics: An R package for omics feature selection and multiple data integration. Published online 2017. doi:10.1371/journal.pcbi.1005752
- Hu H, Tan L, Li X, et al. Betaine Reduces Lipid Anabolism and Promotes Lipid Transport in Mice Fed a High-Fat Diet by Influencing Intestinal Protein Expression. Foods. 2022;11(16):2421. doi:10.3390/foods11162421
- Wang X, Shang X, Pan Y, Fu Y, Zhu H, Yan S. Betaine alleviates obesity-related metabolic disorders in rats: insights from microbiomes, lipidomics, and transcriptomics. Published online 2025. doi:10.3389/fnut.2025.1604801
- Kathirvel E, Morgan K, Malysheva OV, Caudill MA, Morgan TR. Betaine for the prevention and treatment of insulin resistance and fatty liver in a high-fat dietary model of insulin resistance in C57BL mice. Front Nutr. 2024;11:1409972. doi:10.3389/fnut.2024.1409972
- Zeng Q, Zhao M, Wang F, et al. Integrating Choline and Specific Intestinal Microbiota to Classify Type 2 Diabetes in Adults: A Machine Learning Based Metagenomics Study. Front Endocrinol (Lausanne). 2022;13:906310. doi:10.3389/fendo.2022.906310
- Corbin KD, Zeisel SH. Choline Metabolism Provides Novel Insights into Non-alcoholic Fatty Liver Disease and its Progression. Curr Opin Gastroenterol. 2012;28(2):159-165. doi:10.1097/MOG.0b013e32834e7b4b
- Arpaia N, Campbell C, Fan X, et al. Metabolites produced by commensal bacteria promote peripheral regulatory T-cell generation. Nature. 2013;504(7480):451-455. doi:10.1038/nature12726
- Sun M, Wu W, Chen L, et al. Microbiota-derived short-chain fatty acids promote Th1 cell IL-10 production to maintain intestinal homeostasis. Nat Commun. 2018;9(1):3555. doi:10.1038/s41467-018-05901-2
- Chen L, Sun M, Wu W, et al. Microbiota Metabolite Butyrate Differentially Regulates Th1 and Th17 Cells Differentiation and Function in Induction of Colitis. Inflamm Bowel Dis. 2019;25(9):1450-1461. doi:10.1093/ibd/izz046
- Romano KA, Campo AM del, Kasahara K, et al. Metabolic, Epigenetic, and Transgenerational Effects of Gut Bacterial Choline Consumption. Cell Host Microbe. 2017;22(3):279-290.e7. doi:10.1016/j.chom.2017.07.021
- Kropp C, Le Corf K, Relizani K, et al. The Keystone commensal bacterium Christensenella minuta DSM 22607 displays anti-inflammatory properties both in vitro and in vivo. Sci Rep. 2021;11:11494. doi:10.1038/s41598-021-90885-1
- Tavella T, Rampelli S, Guidarelli G, et al. Elevated gut microbiome abundance of Christensenellaceae, Porphyromonadaceae and Rikenellaceae is associated with reduced visceral adipose tissue and healthier metabolic profile in Italian elderly. Gut Microbes. 2021;13(1):1880221. doi:10.1080/19490976.2021.1880221
- Yang J, Li Y, Wen Z, Liu W, Meng L, Huang H. Oscillospira – a candidate for the next-generation probiotics. Gut Microbes. 2021;13(1):1987783. doi:10.1080/19490976.2021.1987783
- Cui Y, Zhang L, Wang X, et al. Roles of intestinal Parabacteroides in human health and diseases. FEMS Microbiology Letters. 2022;369(1):fnac072. doi:10.1093/femsle/fnac072
- Wang K, Liao M, Zhou N, et al. Parabacteroides distasonis Alleviates Obesity and Metabolic Dysfunctions via Production of Succinate and Secondary Bile Acids. Published online 2019. Accessed July 16, 2025. https://www.cell.com/cell-reports/abstract/S2211-1247(18)31958-2
- Parker BJ, Wearsch PA, Veloo ACM, Rodriguez-Palacios A. The Genus Alistipes: Gut Bacteria With Emerging Implications to Inflammation, Cancer, and Mental Health. Frontiers in Immunology. 2020;11. Accessed February 18, 2024. https://www.frontiersin.org/journals/immunology/articles/10.3389/fimmu.2020.00906
- López-Montoya P, Rivera-Paredez B, Palacios-González B, et al. Dietary Patterns Are Associated with the Gut Microbiome and Metabolic Syndrome in Mexican Postmenopausal Women. Nutrients. 2023;15(22):4704. doi:10.3390/nu15224704
- Kountouras J, Papaefthymiou A, Polyzos SA, et al. Impact of Helicobacter pylori-Related Metabolic Syndrome Parameters on Arterial Hypertension. Microorganisms. 2021;9(11):2351. doi:10.3390/microorganisms9112351
- Koeth RA, Wang Z, Levison BS, et al. Intestinal microbiota metabolism of L-carnitine, a nutrient in red meat, promotes atherosclerosis. Nat Med. 2013;19(5):576-585. doi:10.1038/nm.3145
- Wang Z, Klipfell E, Bennett BJ, et al. Gut flora metabolism of phosphatidylcholine promotes cardiovascular disease. Nature. 2011;472(7341):57-63. doi:10.1038/nature09922
- Romano KA, Vivas EI, Amador-Noguez D, Rey FE. Intestinal Microbiota Composition Modulates Choline Bioavailability from Diet and Accumulation of the Proatherogenic Metabolite Trimethylamine-N-Oxide. mBio. 2015;6(2):10.1128/mbio.02481-14. doi:10.1128/mbio.02481-14
- Kuerbanjiang M, Yu W, Shang T, et al. Association between dietary betaine intake and overweight or obesity. Sci Rep. 2024;14:32031. doi:10.1038/s41598-024-83646-3