

Detecting Clinically Significant Prostate Cancer in PI-RADS
Insights on detecting clinically significant prostate cancer in PI-RADS v2.1 scores of 4 and 5
Reza Habibi Tirtashi¹˒², Narges Tamaskani¹, Fatemeh Salamat³˒, Behrouz Ghazimoghaddam⁴, Babak Niakan³, Nematollah Nematollahi⁵, Mohammad Hadi Gharib⁵˒*
- Clinical Research Development Unit (CRDU), 5th Azar Hospital, Golestan University of Medical Sciences, Gorgan, Iran.
- Metabolic Disorders Research Center, Golestan University of Medical Sciences, Gorgan, Iran.
- Cancer Research Center, Golestan University of Medical Sciences, Gorgan, Iran.
- Department of Urology, School of Medicine, 5th Azar Hospital, Golestan University of Medical Sciences, Gorgan, Iran.
- Department of Radiology, School of Medicine, 5th Azar Hospital, Golestan University of Medical Sciences, Gorgan, Iran.
[email protected]
OPEN ACCESS
PUBLISHED: 31 October 2024
CITATION: Tirtashi, R.H., Tamaskani, N., et al., 2024. Insights on detecting clinically significant prostate cancer in PI-RADS v2.1 scores of 4 and 5. Medical Research Archives, [online] 12(10). https://doi.org/10.18103/mra.v12i10.5974
COPYRIGHT © 2024 European Society of Medicine. This is an open-access article distributed under the terms of the Creative Commons Attribution License, which permits unrestricted use, distribution, and reproduction in any medium, provided the original author and source are credited.
DOI https://doi.org/10.18103/mra.v12i10.5974
ISSN 2375-1924
ABSTRACT
Background:
Previous studies have identified various predictors for clinically significant prostate cancer in biopsy-naïve patients.
Aims:
To identify clinical variables associated with clinically significant prostate cancer diagnosis using systematic biopsy combined with cognitive targeted biopsy.
Methods:
This retrospective study analyzed data from 76 biopsy-naïve men who underwent systematic biopsy combined with cognitive targeted biopsy due to Prostate Imaging Reporting and Data System (PI-RADS) 4 or 5 lesions detected on prebiopsy prostate multiparametric magnetic resonance imaging between March 2020 and September 2022. Binary logistic regression was used to identify independent predictors of clinically significant prostate cancer, with odds ratio and 95% confidence intervals.
Results:
The overall detection rate for clinically significant prostate cancer was 44.7%.
In univariable analyses, prostate-specific antigen density ≥0.16 ng/ml² (odds ratio 57.6 [95% confidence intervals 7.13–464.77]), PI-RADS 5 (odds ratio 10.41 [95% confidence intervals 3.47–31.2]), peripheral zone lesions (odds ratio 3.85 [95% confidence intervals 1.32–11.24]), and biopsy density ≥ 0.26 core/ml (odds ratio 2.95 [95% confidence intervals 1.09–8.01]) were significantly associated with clinically significant prostate cancer (p<0.05) and were entered to multivariable analysis.
Considering p<0.2 for selecting variables for multivariable analysis, a single lesion (odds ratio 2.09 [95% confidence intervals 0.81–5.34]) and transition zone lesions (odds ratio 0.45 [95% confidence intervals 0.17–1.14]) were also included.
According to multivariable analysis results, prostate-specific antigen density ≥0.16 ng/ml² (odds ratio 49.88 [95% confidence intervals 4.96–501.47]) and PI-RADS 5 (odds ratio 19.89 [95% confidence intervals 3.36–117.55]) were significant independent predictors of clinically significant prostate cancer, while peripheral zone lesions (odds ratio 0.97 [95% confidence intervals 0.09–10.05]), biopsy density ≥0.26 core/ml (odds ratio 3.44 [95% confidence intervals 0.46–25.68]), a single lesion (odds ratio 3.34 [95% confidence intervals 0.72–15.51]), and transition zone lesions (odds ratio 1.18 [95% confidence intervals 0.15–8.88]) were not.
Conclusions:
The clinical implementation of PI-RADS version 2.1 combined with systematic biopsy combined with cognitive targeted biopsy leads to an acceptable overall detection rate for clinically significant prostate cancer. Moreover, PI-RADS 5 and prostate-specific antigen density ≥0.16 ng/ml² were significant predictors of positive prostate biopsy among men with cognitive targeted biopsy results.
Keywords:
Prostate Cancer, Clinically Significant Prostate Cancer, Multiparametric Magnetic Resonance Imaging, Prostate-Specific Antigen Density, Biopsy Density, Prostate Imaging Reporting and Data System, PI-RADS v2.1, Cancer Detection Rate.
Introduction
Prostate cancer (PCa) is the second most diagnosed cancer and the fifth leading cause of cancer-related mortality among males, affecting 1.41 million individuals worldwide¹˒². Over the previous decades, PCa incidence showed a growing pattern in the Middle East and North Africa region³. Respecting this, PCa is ranked as one of the most common cancers among Iranian populations, with an increasing trend⁴.
Multiparametric magnetic resonance imaging (mp-MRI) has advanced clinically significant PCa (csPCa) diagnosis and risk stratification. In 2015, the Prostate Imaging Reporting and Data System version 2 (PI-RADS v2) was developed to address the worldwide standard for mp-MRI acquisition and interpretation. Subsequently, the revised version, PI-RADS v2.1, was publicized in 2019⁵˒⁶. According to previous clinical assessments, PI-RADS v2.1 interprets the prostate mp-MRI abnormalities in csPCa detection, especially among higher categories⁷˒⁸. Nevertheless, most studies were conducted in North America, European, and East Asian countries, utilizing 3T MRI scans.
The high cost of mp-MRI-required technology and the importance of imaging quality for accurate interpretation result in a considerable disparity in access to imaging equipment and expertise between developed and developing countries⁹˒¹⁰. As far as we are aware, only a few previous studies have investigated the clinical implementation of prebiopsy mp-MRI and PI-RADS v2.1 among the Middle Eastern population¹¹–¹³. However, all of them were conducted in Turkey with heterogeneities according to prior biopsy status, PI-RADS versions, and PI-RADS score categories.
Our initial report on implementing PI-RADS v2.1 in prebiopsy prostate mp-MRI for biopsy-naïve patients who received systematic biopsy followed by magnetic resonance (MR) cognitive-targeted biopsy (cog-MRGB) in northern Iran¹⁴ has revealed a comparatively diminished detection rate (DR) of PCa and csPCa compared to results from developed countries⁹. Therefore, we aimed to examine individuals with PI-RADS v2.1 scores of 4 and 5 to gain a deeper understanding of the potential characteristics associated with csPCa diagnosis at cog-MRGB, particularly the association between PI-RADS scores and the likelihood of detecting csPCa.
Methods
This single-center retrospective study in Gorgan, Golestan province, Iran, was approved by the Ethics Committee of Golestan University of Medical Sciences (Protocol no. IR.GOUMS.REC.1401.431) and was conducted in accordance with the ethical standards outlined in the 1964 Declaration of Helsinki and its subsequent amendments or comparable ethical standards. Informed consent, including consent for publication, was obtained from all participants.
After receiving ethical approval, our center’s data set was retrospectively investigated to identify biopsy-naïve men who were clinically (abnormal prostate-specific antigen [PSA] ≥ 4.0 ng/ml) suspected of having PCa and were assessed by mp-MRI before the biopsy procedure. Individuals with PI-RADS 4 and 5 lesions who underwent systematic prostate biopsy followed by cog-MRGB were initially included. After excluding individuals with missing data, 76 biopsy-naïve men with PI-RADS v2.1 scores ≥ 4 who underwent systematic biopsy and cog-MRGB between March 2020 and September 2022 were finally enrolled, a subset of our initial study published elsewhere previously¹⁴.
Demographic data, total PSA, prostate volume, and radiologic data (number of lesions, anatomical location, mean diameter, and PI-RADS score) were extracted from mp-MRI interpretation. Moreover, the pathology reports were reviewed to obtain the histopathological data (Gleason score [GS], length of biopsy cores and carcinoma within the core, proportion of prostate involvement, and focal invasion) and biopsy details (cores and positive cores numbers).
A 1.5T scanner (Philips Ingenia) was employed to prebiopsy mp-MRI acquisition. All patients received self-administration of a bowel preparation by 30 mg bisacodyl a night before the mp-MRI acquisition.
In addition, mp-MRI was performed with the administration of antispasmodytic (20 mg of Hyoscine-N-Butyl Bromide). Then, these sequences were acquired: T2 weighted image (T2WI) in the axial and coronal plane, axial diffusion-weighted imaging (DWI) (zoom DWI), and axial T1 volumetric interpolated breath-hold examination (VIBE) (T1 VIBE–Mdxion in Philips device). Then, gadolinium (0.1 mmol/kg) was administrated using the free-hand technique. Afterwards, dynamic contrast enhancement (DCE) 3D T1VIBE was started to be acquired in the axial plane in 15 seconds interval. In addition, a classic T1 postcontrast of the whole pelvis was also acquired. The mp-MRI sequence specifications are explained in Supplementary Table S1.
An experienced radiologist interpreted the mp-MRI based on the PI-RADS v2.1 guideline⁶, and all reports were recorded in a standardized PI-RADS reporting format. (Supplementary Figure S1) The radiologist was aware of patients’ clinical history and laboratory findings, such as PSA level. At first, based on T2WI in sagittal and axial planes, the following formula:
prostate height (maximum anterior-posterior) × prostate width (maximum mediolateral) × prostate length (maximum craniocaudal) × 0.52
was used to estimate the prostate volume. Then, PSA density (PSAD) was calculated by dividing the PSA level (ng/mL) by the prostate volume (mL). Additionally, biopsy density (BD) was computed by dividing the number of cores by the prostate volume (mL). Moreover, the transition zone (TZ) and peripheral zone (PZ) of the prostate were explored separately, and the PI-RADS score was reported for each region separately. The higher PI-RADS score was designated in the final conclusion for further evaluation among patients with multiple lesions. Moreover, the largest single-axis size on axial T2WI was measured for each lesion diameter, and the mean lesion diameter was calculated in multiple lesions. Finally, intra-prostatic hemorrhage and extraprostatic extension, i.e., involvement of seminal vesicle, lymph nodes, and bone, were evaluated and reported.
A single expert urologist performed all the biopsy procedures using a Siemens Acuson sonography device with an end-fire ultrasound endorectal probe (ER 5–9 Hz). At first, the systematic biopsy was conducted in the sagittal transrectal ultrasonography (TRUS) plane on the lateral decubitus position under rectal cleansing, antibiotic prophylaxis, and local anesthesia. After the standard systematic biopsy, a cog-MRGB was performed. In this regard, according to the radiologist’s mp-MRI-based topographic map of the prostate (Supplementary Figure S2), additional cognitive cores were obtained for each mp-MRI target lesion. All cores were separately labeled, documented, and sent for histopathology evaluation.
Formalin-fixed prostate cores specimens were received and underwent hematoxylin-eosin staining. Then, an expert genitourinary pathologist who was blinded to mp-MRI data evaluated all specimens based on the International Society of Urological Pathology recommendation. Benign prostate tissue, low-grade or high-grade prostate intraepithelial neoplasia (PIN), GS, length of biopsy core and carcinoma within the core, and the total and positive cores number were reported. The focal characteristics of prostate adenocarcinoma, including fat, lymphovascular, and perineural invasion, were also described. Furthermore, the proportion of prostatic tissue involved by the tumor was estimated by dividing the total linear length of carcinoma over the total biopsy cores length. Finally, the csPCa was considered GS ≥7⁵, and the histopathology result was classified into four groups: Benign, PIN (includes low-grade and high-grade), GS 6, and GS ≥7.
Statistical analysis
After assessing the normality distribution of the data using the Kolmogorov–Smirnov test, baseline characteristics were presented as mean (standard deviation [SD]) or median (interquartile range [IQR]) for continuous variables, and as frequencies (percentages) for categorical variables. Comparisons of baseline characteristics between participants with and without csPCa and between PI-RADS scores of 4 and 5 (Supplementary Table S2), as well as histopathological findings between PI-RADS scores of 4 and 5, were conducted using chi-squared tests for categorical variables, Mann-Whitney tests for continuous variables with non-normal distributions, and independent Student’s t-tests for continuous variables with approximately normal distributions. Additionally, a patient-based analysis was performed to determine the detection rate (DR) of PCa and csPCa overall, as well as within each PI-RADS category and prostate zone.
Before employing binary logistic regression to evaluate the association between various patient baseline characteristics and the likelihood of detecting csPCa, receiver operating characteristic (ROC) curves with the 95% confidence interval (CIs) were used to determine the cut-off point of continuous variables that had optimal sensitivity and reasonable specificity. After transforming continuous variables into categorical ones based on the estimated cut-off points, univariable binary logistic regression was performed. Covariates with a p-value < 0.02 were then entered into the multivariable logistic regression analysis. For each variable, the odds ratio (OR) and 95% CI were reported. SPSS 26 (SPSS Inc., Chicago, IL, USA) was employed to perform statistical analyses, with P < 0.05 considered significant, except for variable selection in the multivariable logistic regression.
Results
The study sample included 76 biopsy naïve patients (109 lesions) who underwent prebiopsy mp-MRI before combined systematic biopsy and cog-MRGB. Among them, 35 patients (46.1%) were assigned to PI-RADS scores of 4 (51 lesions) and 41 patients (53.9%) PI-RADS scores of 5 (58 lesions). (Figure 1) The study participants aged 68.74 (SD 8.83) years in mean, and the median of PSA level and PSAD were 9.47 (IQR 6.2-19.79) ng/mL and 0.2 (0.12-0.46) ng/mL², respectively. On average, the biopsy procedure was performed 11 days (IQR 9-14) after mp-MRI, with 2 additional cognitive cores obtained after systematic biopsy. Among the total 109 lesions, 43 (39.4%) lesions were confirmed as PCa and 42 (38.5%) lesions as csPCa. (csPCa per lesion was 38.5%)
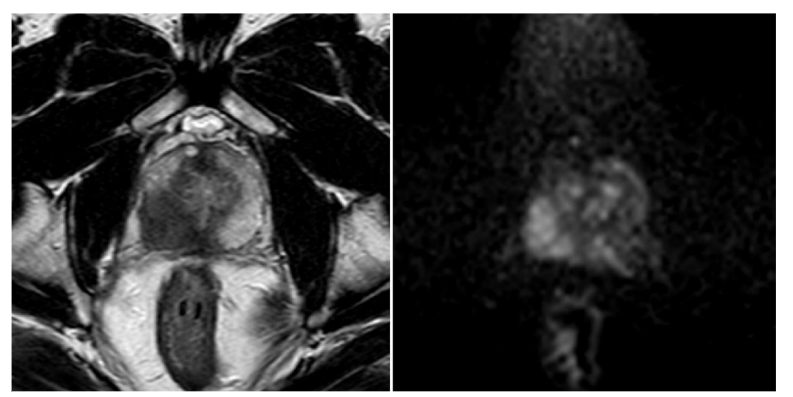
Figure 1.
The axial T2 image (left) and axial zoom DWI with b-value 1400 (right) show a large (>15 mm), poorly defined lesion with low T2 signal intensity in the right posterolateral mid-peripheral zone of the prostate. The lesion also exhibits restricted diffusion on the high b-value DWI, suggesting it is suspicious for clinically significant prostate cancer (PIRADS 5).
Baseline characteristics of the study population were compared based on the csPCa outcome in Table 1. One lesion (IQR 1–2) was found per patient, and the median of the calculated mean lesions diameter was 16 (IQR 13–23.75) mm per patient. The mp-MRI target lesions were observed in the PZ and TZ of the prostate in 51 (67.1%) and 35 (46.1%) of participants, respectively, and multiple lesions were found in 32 (42.1%) of patients. (Only one patient had three target lesions with PI-RADS 5.)
In addition, the TZ group contained more PI-RADS score of 4 (57.1%), whereas most of the PZ group constituted a PI-RADS score of 5 (64.7%). Details of other results are available in Table 1. Moreover, Supplementary Table S2 illustrates the study baseline characteristics according to PIRADS categories.
Patients with csPCa, compared with those without, had higher levels of PSA and PSAD, larger lesions, smaller prostate, and greater BD. The csPCa was more likely in individuals with a lesion on the PZ of the prostate and a higher prebiopsy mp-MRI PI-RADS score. (All p-value < 0.05) Moreover, among patients with csPCa, extraprostatic extension prevalence was 55.9%, and the seminal vesicle, bone, and lymph nodes involvements were observed in 11 (32.4%), 11 (32.4%), and 9 (26.5%) patients, respectively.
Table 1. Baseline characteristics of the study population
| Characteristics | Total population (n = 76) | Patient outcomes — With csPCa (n = 34) | Patient outcomes — Without csPCa (n = 42) | p-value |
|---|---|---|---|---|
| Age (years) | 68.74 (8.83) | 69.94 (8.73) | 67.76 (8.9) | 0.287 |
| PSA† (ng/ml) | 9.47 (6.2–19.79) | 19.24 (10.38–41.1) | 7.06 (5.63–11.86) | <0.001 |
| Prostate volume (ml) | 45.5 (35–76) | 38 (32.37–62.5) | 52 (38–82.25) | 0.029 |
| PSAD (ng/ml²) | 0.2 (0.12–0.46) | 0.45 (0.21–0.86) | 0.13 (0.1–0.21) | <0.001 |
| The number of lesions per patient | 1 (1–2) | 1 (1–2) | 1.5 (1–2) | 0.110 |
| Single lesion | 44 (57.9%) | 23 (67.6%) | 21 (50%) | 0.162 |
| Multiple lesions | 32 (42.1%) | 11 (32.4%) | 21 (50%) | 0.162 |
| The calculated mean of lesions diameter per patient (mm) | 16 (13–23.75) | 23.5 (15.75–36) | 13.75 (12–17.25) | <0.001 |
| Anatomical location of the lesion | ||||
| • Transition zone | 35 (46.1%) | 12 (35.3%) | 23 (54.8%) | 0.109 |
| • Peripheral zone | 51 (67.1%) | 28 (82.4%) | 23 (54.8%) | 0.014 |
| PI-RADS score | ||||
| • Score of 4 | 35 (46.1%) | 6 (17.6%) | 29 (69%) | <0.001 |
| • Score of 5 | 41 (53.9%) | 28 (82.4%) | 13 (31%) | <0.001 |
| Number of biopsy cores per patient | 14 (13–15) | 14 (13–15) | 14 (14–15) | 0.154 |
| The total biopsy cores length (mm) | 226.51 (40.3) | 217.35 (37.56) | 233.93 (41.35) | 0.072 |
| Biopsy density (core/ml) | 0.3 (0.17–0.38) | 0.36 (0.24–0.43) | 0.27 (0.17–0.36) | 0.049 |
Values are expressed as mean (standard deviation) or median (interquartile range) for continuous variables and n (%) for categorical variables.
csPCa: clinically significant prostate cancer; PSA: prostate-specific antigen; PSAD: prostate-specific antigen density; mp-MRI: multiparametric magnetic resonance imaging; PI-RADS: Prostate Imaging Reporting and Data System.
Table 2 shows histopathological findings according to PI-RADS scores of 4 and 5. In total, benign prostate tissue was observed among 25 (32.9%) participants, followed by 7 (9.2%) PIN (four high-grade and three low-grade), most of them constitute of PI-RADS score of 4. The overall PCa and csPCa DRs were 57.9% (44 patients) and 44.7% (34 patients). Moreover, overall PCa and csPCa DRs based on the prostate zones and PI-RADS scores were 68.8% and 54.9% in the PZ, 42.9% and 34.3% in the TZ, 78% and 68.3% in PI-RADS 5, and 34.3% and 17.1% in PI-RADS 4. More details are provided in Table 2. Furthermore, the focal pathological evaluation revealed fat and perineural invasion were diagnosed among 3 (8.8%) and 27 (79.4%) patients, respectively, without lymphovascular invasion. Further details are available in Table 3.
Table 2. Systematic plus cognitive MRI-ultrasound fusion biopsy histopathological findings
| Characteristics | Total population (n = 76) | PI-RADS version 2.1 — PI-RADS 4 (n = 35) | PI-RADS 5 (n = 41) | p-value |
|---|---|---|---|---|
| Histopathology | ||||
| Benign | 25 (32.9%) | 17 (48.6%) | 8 (19.5%) | |
| Prostate intraepithelial neoplasia | 7 (9.2%) | 6 (17.1%) | 1 (2.4%) | <0.001 |
| GS 6 | 10 (13.2%) | 6 (17.1%) | 4 (9.8%) | |
| GS ≥7 (csPCa) | 34 (44.7%) | 6 (17.1%) | 28 (68.3%) | <0.001 |
| Prostate cancer | 44 (57.9%) | 12 (34.3%) | 32 (78%) | <0.001 |
Values are expressed as n (%) for categorical variables.
TRUS, transrectal ultrasound; MRI, magnetic resonance imaging; PI-RADS, Prostate Imaging Reporting and Data System; GS, Gleason score; csPCa, clinically significant prostate cancer.
Table 3. Focal pathological characteristics of prostate cancer
| Characteristics | PCa (n = 44) | csPCa (n = 34) |
|---|---|---|
| Number of positive biopsy cores per patient | 8.02 (3.52) | 9.03 (3.16) |
| The total linear length of carcinoma within the core (mm) | 60.93 (44.41) | 69.91 (44.15) |
| The estimated proportion of prostatic tissue involved by the tumor (%) | 28.1 (20.73%) | 32.33 (21.08%) |
| Prostatic fat invasion | 3 (7%)* | 3 (8.8%) |
| Perineural invasion | 28 (65.1%)* | 27 (79.4%) |
Values are expressed as mean (standard deviation) for continuous variables and n (%) for categorical variables.
PCa, prostate cancer; csPCa, clinically significant prostate cancer.
† There was one missing data for prostatic fat and perineural invasion among patients with prostate cancer.
The results obtained from binary logistic regression analyses are outlined in Table 4. In univariable analyses, the following factors were associated with a significantly higher risk of csPCa detection: PSAD ≥ 0.16 ng/ml² (OR 57.6 [95% CI 7.13–464.77]), PI-RADS score of 5 (OR 10.41 [95% CI 3.47–31.2]), peripheral zone lesions (OR 3.85 [95% CI 1.32–11.24]), and BD ≥ 0.26 core/ml (OR 2.95 [95% CI 1.09–8.01]). Additionally, age ≥ 60 years (OR 1.36 [95% CI 0.44–4.63]) and the presence of a single lesion (OR 2.09 [95% CI 0.81–5.34]) were linked to an elevated risk of csPCa diagnosis, although these associations were not statistically significant. Conversely, lesions on the prostate TZ (OR 0.45 [95% CI 0.17–1.14]) was associated with a lower csPCa risk, but this association was also not statistically significant.
In the multivariable analysis, a PSAD ≥ 0.16 ng/ml² (OR 49.88, 95% CI 4.96–501.47) and a PI-RADS score of 5 (OR 19.89, 95% CI 3.36–117.55) remained statistically significant as independent predictors for csPCa diagnosis. However, the association of BD ≥ 0.26 cores/ml (OR 3.44, 95% CI 0.46–25.68), the presence of a single lesion (OR 3.34, 95% CI 0.72–15.5), and a TZ lesion (OR 1.18, 95% CI 0.15–8.88) with an elevated risk of csPCa did not reach statistical significance. Additionally, the presence of a PZ lesion (OR 0.97, 95% CI 0.09–10.05) was associated with a lower risk of csPCa diagnosis, though without statistical significance.
Table 4. Univariable and multivariable logistic regression analyses for csPCa outcomes (n = 76)
| Characteristics | Patient outcomes — With csPCa (n = 34) | Without csPCa (n = 42) | Univariable analysis — OR (95% CI) | p-value | Multivariable analysis — OR (95% CI) | p-value |
|---|---|---|---|---|---|---|
| Age ≥ 60 years | 29 (85.3%) | 34 (81%) | 1.36 (0.4–4.63) | 0.618 | – | – |
| Age < 60 years | 5 (14.7%) | 8 (19%) | – | – | – | – |
| PSAD ≥ 0.16 ng/ml² | 32 (97%) | 15 (35.7%) | 57.6 (7.13–464.77) | <0.001 | 49.88 (4.96–501.47) | <0.001 |
| PSAD < 0.16 ng/ml² | 1 (3%) | 27 (64.3%) | – | – | – | – |
| Single lesion | 23 (67.6%) | 21 (50%) | 2.09 (0.81–5.34) | 0.124 | 3.34 (0.72–15.5) | 0.122 |
| Multiple lesions | 11 (32.4%) | 21 (50%) | – | – | – | – |
| PI-RADS 5 | 28 (82.4%) | 13 (31%) | 10.41 (3.47–31.2) | <0.001 | 19.89 (3.36–117.55) | <0.001 |
| PI-RADS 4 | 6 (17.6%) | 29 (69%) | – | – | – | – |
| With transition zone lesion | 22 (64.7%) | 19 (45.2%) | – | 0.093 | 1.18 (0.15–8.88) | 0.866 |
| Without transition zone lesion | – | – | – | – | – | – |
| With peripheral zone lesion | 28 (82.4%) | 23 (54.8%) | 3.85 (1.32–11.24) | 0.014 | 0.97 (0.09–10.05) | 0.98 |
| Without peripheral zone lesion | 6 (17.6%) | 19 (45.2%) | – | – | – | – |
| Biopsy density ≥ 0.26 core/ml | 26 (76.5%) | 22 (52.4%) | 2.95 (1.09–8.01) | 0.033 | 3.44 (0.46–25.68) | 0.227 |
| Biopsy density < 0.26 core/ml | 8 (23.5%) | 20 (47.6%) | – | – | – | – |
csPCa, clinically significant prostate cancer; OR, odds ratio; CI, confidence intervals; PSAD, prostate-specific antigen density; PI-RADS, Prostate Imaging Reporting and Data System.
Discussion
Our results showed an overall 44.7% DR for csPCa among 76 biopsy-naive men with PI-RADS v2.1 scores of 4 and 5 in prebiopsy mp-MRI who underwent systematic biopsy followed by cog-MRGB.
The PSA level, prostate volume, PSAD, lesion location and diameter, PI-RADS score, and BD significantly differed between participants according to csPCa outcome. csPCa was more frequently observed in men with a PI-RADS 5 score, whereas those with a PI-RADS score of 4 had more benign prostate histopathology. Furthermore, among the various variables, PSAD ≥ 0.16 ng/ml² and PI-RADS score of 5 were the only independent predictors for csPCa detection. PI-RADS v2.1 was developed to modify PI-RADS v2 and improve its limitations and inconsistencies, aiming to enhance PI-RADS diagnostic
performance⁶˒⁷. Previous studies using 1.5T mp-MRI to evaluate the diagnostic performance of PI-RADS v2.1 reported an overall csPCa DR ranging from 34.20% to 40.66%, depending on different biopsy procedures¹⁰˒¹⁵. Moreover, regarding the application of cog-MRGB based on the 3T MRI target lesions in all PI-RADS categories, Chen et al.¹⁶ reported an overall csPCa DR of 48.85%, while Kim et al.¹⁷ reported a 32.6% DR for csPCa in the prostate PZ. Our results from cog-MRGB based on PI-RADS 4 and 5 targeted lesions on 1.5T MRI were comparable to these reports. Considering previous studies conducted among the Middle Eastern population (Supplementary Table S3) with various magnetic field strengths, PI-RADS versions, biopsy methods, and participants’ biopsy statuses, Koparal et al.¹¹ reported an overall 24.6% csPCa DR for PI-RADS scores ≥2, Vural et al.¹² detailed an overall 60% csPCa DR for PI-RADS scores of 4 and 5, and Coşkun et al.¹³ demonstrated 80% and 89% csPCa DR for PI-RADS scores of 4 and 5, respectively. For PI-RADS scores of 4 and 5, our study showed a notably lower csPCa DR compared to previous studies in the Middle East, except for the study conducted by Koparal et al.
In the present study, a significantly higher csPCa DR was observed in patients with a PI-RADS score of 5. Additionally, PI-RADS 5 was found to be an independent predictor for csPCa in multivariable analysis, alongside other variables (OR 19.89 [95% CI 3.36–117.55]). In this context, a meta-analysis by Oerther et al.⁸ revealed that higher PI-RADS categories were significantly associated with increased csPCa DRs. Furthermore, several previous publications have identified the PI-RADS score as an independent predictor for detecting csPCa on biopsy, regardless of age, PSAD, lesion location, or abnormal digital rectal exam¹⁶˒¹⁸˒¹⁹. Similarly, in a multivariable meta-regression combining PI-RADS and clinical data, Haj-Mirzaian et al.²⁰ demonstrated that PI-RADS 5 was independently associated with an elevated risk of csPCa, in addition to PSAD.
According to a meta-analysis of 13 studies, among patients with positive prebiopsy mp-MRI, an elevated PSAD can double the likelihood of csPCa detection while also providing additional information for risk stratification²¹. Moreover, PSAD was identified as the only clinical variable significantly associated with csPCa in a multivariable meta-regression²⁰. Previous studies, across various cutoff values, have also shown that PSAD remained a significant independent predictor of csPCa diagnosis, regardless of age, PI-RADS score, lesion location, or abnormal digital rectal exam¹⁶˒¹⁸˒¹⁹˒²². Similarly, in our study, using a cutoff value of 0.16 ng/ml², PSAD was independently associated with csPCa at biopsy in multivariable regression, irrespective of a PI-RADS score of 5, the presence of prostate PZ lesions, and BD.
BD is defined as the ratio of biopsy cores to prostate volume. The study by Shen et al.²³ to determine the optimal number of samples needed to detect PCa during transperineal mapping biopsy highlighted BD as a reliable indicator of PCa, regardless of lesion findings in mp-MRI. They suggested that BD was correlated with biopsy results or higher GS scores, regardless of other factors such as age and PSA level. Furthermore, a strong correlation between higher BD and increased cancer DRs was observed in their evaluation of previous studies²³. Subsequently, Feng et al.²⁴ applied BD to PCa diagnoses using cog-MRGB and demonstrated that BD was an independent predictor of PCa, alongside age, PSAD, and PI-RADS score. They also proposed a cutoff value of 0.22 core/ml for BD. To the best of our knowledge, this study is the first to utilize BD for diagnosing csPCa under cog-MRGB. Our findings, using a cutoff value of 0.26 core/ml, revealed that BD was associated with a higher risk of csPCa at biopsy as a single indicator. However, this association did not reach statistical significance in multivariable logistic regression analyses when considered alongside other variables (OR 3.44 [95% CI 0.46–25.68]).
The noticeable strength of this study is that it represents the initial experiences of PI-RADS v2.1 implementation in a homogenous biopsy-naïve population from a developing country in the
Middle East. The study explored parameters associated with csPCa diagnoses using cog-MRGB, including PSAD and BD. Moreover, all procedures were performed by the same radiologist, urologist, and pathologist, which helped minimize variability in the results.
The current study was also exposed to several limitations. First, the study included a small sample size. However, PCa shows a growing pattern among North African and Middle Eastern populations, and also the Iranian male, the PCa burden is still low, in contrast to Western countries³˒⁴. Thus, a limited sample size was expected. Second, standard systematic plus cog-MRGB was considered the reference test, and mp-MRI findings did not compare with prostatectomy specimens due to the study’s retrospective design and lack of final pathology results.
Conclusion
Our initial experience demonstrated that implementation of PI-RADS v2.1 and cog-MRGB using 1.5T mp-MRI provide an acceptable overall DR for PCa and csPCa, especially in PI-RADS 5 cases. However, results should be interpreted with caution in patients with a PI-RADS score of 4 or lesions located at the prostate TZ. Moreover, PI-RADS 5 and PSAD, with a cutoff value of 0.16 ng/ml², were significant independent predictors of csPCa. In contrast, BD with a cutoff value of 0.26 core/ml did not show a statistically significant association with csPCa when combined with other parameters. Further studies are needed to assess the potential of BD in predicting csPCa and reducing unnecessary biopsies.
Conflict of Interest:
The authors have no relevant financial or non-financial interests to disclose.
Funding Statement:
No funds, grants, or other support were received during the preparation of this manuscript.
Acknowledgements:
This research did not receive any specific grant from any funding agency in the public, commercial, or not-for-profit sector.
Author contributions:
R.H.T., M.H.G., and N.T. planned the study, researched the data, and wrote the manuscript. Additionally, R.H.T. contributed to data analysis, and M.H.G. interpreted the prostate mp-MRI. F.S. analyzed the data and reviewed and edited the manuscript. B.G. performed the biopsy procedures and reviewed and edited the manuscript. B.N. evaluated the biopsy specimens and reviewed and edited the manuscript. N.N. reviewed and edited the manuscript.
References
1. Organization WH. Cancer. World Health Organization. Accessed 3 February, 2022. https://www.who.int/news-room/fact-sheets/detail/cancer
2. Bray F, Ferlay J, Soerjomataram I, Siegel RL, Torre LA, Jemal A. Global cancer statistics 2018: GLOBOCAN estimates of incidence and mortality worldwide for 36 cancers in 185 countries. CA: a cancer journal for clinicians. 2018;68(6):394-424.
3. Abbasi-Kangevari M, Ghamari S, Azangou-Khyavy M, Malekpour M, Rezaei N, Kolahi A, et al. The burden of prostate cancer in North Africa and Middle East, 1990-2019: Findings from the global burden of disease study. Frontiers in Oncology. 2022;12:961086-961086.
4. Moradi A, Zamani M, Moudi E. A systematic review and meta-analysis on incidence of prostate cancer in Iran. Health promotion perspectives. 2019;9(2):92.
5. Weinreb JC, Barentsz JO, Choyke PL, Cornud F, Haider MA, Macura KJ, et al. PI-RADS prostate imaging–reporting and data system: 2015, version 2. European urology. 2016;69(1):16-40.
6. Turkbey B, Rosenkrantz AB, Haider MA, Padhani AR, Villeirs G, Macura KJ, et al. Prostate imaging reporting and data system version 2.1: 2019 update of prostate imaging reporting and data system version 2. European urology. 2019;76(3):340-351.
7. Park KJ, Choi SH, Kim Mh, Kim JK, Jeong IG. Performance of Prostate Imaging Reporting and Data System Version 2.1 for Diagnosis of Prostate Cancer: A Systematic Review and Meta‐Analysis. Journal of Magnetic Resonance Imaging. 2021;54 (1):103-112.
8. Oerther B, Engel H, Bamberg F, Sigle A, Gratzke C, Benndorf M. Cancer detection rates of the PI-RADSv2. 1 assessment categories: systematic review and meta-analysis on lesion level and patient level. Prostate cancer and prostatic diseases. 2022;25(2):256-263.
9. Schlemmer H-P, Bittencourt LK, D’Anastasi M, Domingues R, Khong P-L, Lockhat Z, et al. Global challenges for cancer imaging. Journal of Global Oncology. 2017;4:1-10.
10. Cata E, Andras I, Ferro M, Kadula P, Leucuta D, Musi G, et al. Systematic sampling during MRI-US fusion prostate biopsy can overcome errors of targeting—prospective single center experience after 300 cases in first biopsy setting. Translational Andrology and Urology. 2020;9(6):2510.
11. Koparal MY, Sözen TS, Karşıyakalı N, Aslan G, Akdoğan B, Şahin B, et al. Comparison of transperineal and transrectal targeted prostate biopsy using Mahalanobis distance matching within propensity score caliper method: A multicenter study of Turkish Urooncology Association. The Prostate. 2022;82(4):425-432.
12. Vural M, Coskun B, Kilic M, Durmaz S, Gumus T, Cengiz D, et al. In-bore MRI-guided prostate biopsy in a patient group with PI-RADS 4 and 5 targets: A single center experience. European Journal of Radiology. 2021;141:109785.
13. Coşkun M, Dönmez EMH, Akın Y, Öcal İ, Gümüş C, Uluç ME. Predictors of Clinically Significant Prostate Cancer: A Comparative Study of PSA, PSA Density, and MRI Parameters. Istanbul Medical Journal. 2021;22(1)
14. Tirtashi RH, Gharib MH, Tamaskani N. The real-life challenges in prebiopsy prostate mp-MRI: Experiences from a Middle Eastern Country. Medical Research Archives. 2024;12(5)
15. Brancato V, Di Costanzo G, Basso L, Tramontano L, Puglia M, Ragozzino A, et al. Assessment of DCE utility for PCa diagnosis using PI-RADS v2. 1: Effects on diagnostic accuracy and reproducibility. Diagnostics. 2020;10(3):164.
16. Chen Y, Ruan M, Zhou B, Hu X, Wang H, Liu H, et al. Cutoff Values of Prostate Imaging Reporting and Data System Version 2.1 Score in Men With Prostate-specific Antigen Level 4 to 10 ng/mL: Importance of Lesion Location. Clinical Genitourinary Cancer. 2021;19(4):288-295.
17. Kim HS, Kwon GY, Kim MJ, Park SY. Prostate imaging-reporting and data system: comparison of the diagnostic performance between version 2.0 and 2.1 for prostatic peripheral zone. Korean Journal of Radiology. 2021;22(7):1100.
18. Wei X, Xu J, Zhong S, Zou J, Cheng Z, Ding Z, et al. Diagnostic value of combining PI-RADS v2. 1 with PSAD in clinically significant prostate cancer. Abdominal Radiology. 2022;47(10):3574-3582.
19. Ge Q, Zhang S, Xu H, Zhang J, Fan Z, Li W, et al. Development and validation of a novel nomogram predicting clinically significant prostate cancer in biopsy‐naive men based on multi‐institutional analysis. Cancer Medicine. 2023;12 (24):21820-21829.
20. Haj-Mirzaian A, Burk KS, Lacson R, Glazer DI, Saini S, Kibel AS, et al. Magnetic Resonance Imaging, Clinical, and Biopsy Findings in Suspected Prostate Cancer: A Systematic Review and Meta-Analysis. JAMA Network Open. 2024;7 (3):e244258-e244258.
21. Wang S, Kozarek J, Russell R, Drescher M, Khan A, Kundra V, et al. Diagnostic performance of prostate-specific antigen density for detecting clinically significant prostate cancer in the era of magnetic resonance imaging: a systematic review and meta-analysis. European Urology Oncology. 2023;
22. Ma Z, Wang X, Zhang W, Gao K, Wang L, Qian L, et al. Developing a predictive model for clinically significant prostate cancer by combining age, PSA density, and mpMRI. World Journal of Surgical Oncology. 2023;21(1):83.
23. Stone NN, Crawford ED, Skouteris VM, Arangua P, Metsinis P-M, Lucia MS, et al. The ratio of the number of biopsy specimens to prostate volume (biopsy density) greater than 1.5 improves the prostate cancer detection rate in men undergoing transperineal biopsy of the prostate. The Journal of Urology. 2019;202(2):264-271.
24. Feng J, Chen K, Tian H, Abdulkarem A-qM, Tuo Y, Wang X, et al. Investigation of the Effectiveness of Prostate Biopsy Density in Predicting Prostate Cancer Under Cognitive and Systematic Biopsy in Multi-Parametric Magnetic Resonance Imaging (mpMRI). Cancer Management and Research. 2024:883-890.
Supplementary
MULTIPARAMETRIC MRI OF PROSTATE (with dynamic post contrast images)
History: elevated PSA level of 8.95
Findings:
Size: 5 × 4 × 3.5 cm = 36.5 cc
Hemorrhage: None
Peripheral zone: heterogeneous high T2 sagittal
Transition zone: heterogeneous in T2, consistent with BPH changes
Seminal vesicle: Not involved
Lymph nodes: Not involved
Bones: Not involved
Lesions:
Peripheral zone: mostly compatible with PI-RADS 5 features.
There is a 24 mm focus of restriction in DWI & signal decrease in ADC, in the right posterolateral & posteromedial aspect of mid & lower peripheral zones, with concordant signal decrease in T2 & early initial enhancement in post contrast sequences, considered suspicious for clinically significant cancer in peripheral zone.
However, there is diffuse infiltration of prostate gland with low T2 signal intensity lesion but with no concordant significant restriction in DWI, esp in left side of mid & lower transitional zones suggestive of associated diffuse prostatic gland cancerous involvement, but with non-clinically significant cancer.
Prostate is enlarged as a result of BPH changes.
Bladder wall is thickened & there is mild mucosal irregularity.
PI-RADS – 5
Very high (clinically significant cancer is highly likely to be present)
Impression:
Tissue biopsy is recommended for evaluation of possible underlying clinically significant cancer in prostate. (P–5)
Supplementary Figure S1. Multiparametric magnetic resonance imaging report according to the PI-RADS v2.1 outlined standard reporting format.
PSA, prostate-specific antigen; BPH, benign prostatic hyperplasia; DWI, diffusion-weighted imaging; ADC, Apparent diffusion coefficient; EPE, extraprostatic extension; PI-RADS, Prostate Imaging Reporting and Data System.
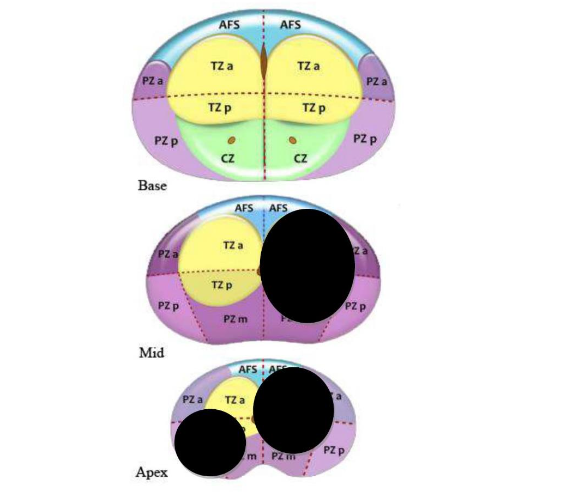
Supplementary Figure S2. Topographic map of the prostate according to PI-RADS v2.1 sector map diagram
PZ, peripheral zone; TZ, transition zone; CZ, central zone; AFS, anterior fibromuscular stroma; a, anterior; p, posterior, PI-RADS v2.1, Prostate Imaging Reporting and Data System version 2.1.
Supplementary Table S1. The prostate mp-MRI sequence specifications
| Sequences | TR (ms) | TE (ms) | Slice thickness (mm) | FOV (cm) | Matrix | b value (s/mm²) |
|---|---|---|---|---|---|---|
| Axial T2WI | 4200 | 100 | 3 | 15 | 352×352 | – |
| Coronal T2WI | 3600 | 100 | 3 | 15 | 352×352 | – |
| Axial DWI (zoom DWI) | 2100 | 100 | 4 | 15 | 96×96 | 0, 800, 1400 |
| Axial post contrast T1 classic | 660 | 10 | 5 | 35 | – | – |
| Axial DCE T1 VIBE (Mdxion) including precontrast | 4.8 | 0 | 3 | 15 | 320×320 | – |
mp-MRI, multiparametric magnetic resonance imaging; TR, repetition time; TE, echo time; FOV, field of view; T2WI, T2 weighted image; DWI, diffusion-weighted imaging; VIBE, volumetric interpolated breath-hold examination; DCE, dynamic contrast enhancement.
Supplementary Table S2. Baseline characteristics of the study population according to PIRADS categories
| Characteristics | PI-RADS v2.1 — PI-RADS 4 (n = 35) | PI-RADS 5 (n = 41) | p-value |
|---|---|---|---|
| Age (years) | 66.83 (8.32) | 70.37 (9.03) | 0.082 |
| PSA† (ng/ml) | 7.5 (5.32–12.36) | 16.1 (7.52–30.72) | <0.001 |
| PSAD (ng/ml²) | 0.15 (0.11–0.27) | 0.30 (0.13–0.61) | 0.008 |
| Prostate volume (ml) | 45 (35–69) | 46 (35.5–81) | 0.393 |
| The number of lesions per patient | 1 (1–2) | 1 (1–2) | 0.628 |
| Single lesion | 19 (54.3%) | 25 (61%) | 0.643 |
| Multiple lesions | 16 (45.7%) | 16 (39%) | 0.643 |
| The calculated mean of lesions diameter per patient (mm) | 13 (11.5–14) | 20 (17.5–32.5) | <0.001 |
| Anatomical location of the lesion | |||
| • Transitional zone | 20 (57.1%) | 15 (36.6%) | 0.106 |
| • Peripheral zone | 18 (51.4%) | 33 (80.5%) | 0.013 |
| Number of additional cognitive cores per patient | 2 (1–3) | 2 (1–3) | 0.857 |
| The total biopsy cores length (mm) | 231.71 (41.79) | 222.07 (38.95) | 0.302 |
| Biopsy density (core/ml) | 0.3 (0.21–0.39) | 0.29 (0.15–0.38) | 0.338 |
Values are expressed as mean (standard deviation) or median (interquartile range) for continuous variables and n (%) for categorical variables.
csPCa, clinically significant prostate cancer; PSA, prostate-specific antigen; PSAD, PSA density; mp-MRI, multiparametric magnetic resonance imaging; PI-RADS, Prostate Imaging Reporting and Data System.
† There was one missing data for PSA among the study population.