

DNA Methylation and Telomere Length in Metabolic Disorders
Global deoxyribonucleic acid methylation and telomere length in patients with systemic metabolic disorders
Olena V. Kolesnikova¹, Anastasiia O. Radchenko¹, Olga Ye. Zaprovalna¹, Valentina Yu. Galchinskaya²
- Department of study of aging processes and prevention of metabolic-associated diseases, L.T. Malaya Therapy National Institute of the National Academy of Medical Sciences of Ukraine, Kharkiv, Ukraine.
- Laboratory of immuno- biochemical and molecular-genetic research, L.T. Malaya Therapy National Institute of the National Academy of Medical Sciences of Ukraine, Kharkiv, Ukraine.
OPEN ACCESS
PUBLISHED: 31 December 2025
CITATION: Kolesnikova, O. V., Radchenko, A. O., et al. Global deoxyribonucleic acid methylation and telomere length in patients with systemic metabolic disorders. [online] 13(12).
https://doi.org/10.18103/mra.v13i12.7180
COPYRIGHT © 2025 European Society of Medicine. This is an open-access article distributed under the terms of the Creative Commons Attribution License, which permits unrestricted use, distribution, and reproduction in any medium, provided the original author and source are credited.
DOI https://doi.org/10.18103/mra.v13i12.7180
ISSN 2375-1924
Abstract
Background: Epigenetic mechanisms reflect biological ageing and cardiometabolic risk. In patients with systemic metabolic disorders (SMD), these processes are perturbed, yet joint dynamics of global 5-methylcytosine (5-mC) and telomere length remain insufficiently described.
Aims: To assess associations between 5-mC, telomere length and cardiometabolic profiles by SMD stage and over time.
Methods: We studied 78 SMD patients (median age 55.4 years; 56% men): stage 1 (n=59) and stage 2 (n=19). Global 5-mC was measured by enzyme-linked immunosorbent assay and telomere length by real-time quantitative polymerase chain reaction. 67 patients had a follow-up visit after a median of 63 weeks.
Results: Stage 2 patients showed higher body mass index, aspartate/alanine aminotransferases, alkaline phosphatase, glucose, triglycerides, very-low-density lipoprotein cholesterol, and lower high-density lipoprotein cholesterol (all p<0.05). Only trends toward hypermethylation and shorter telomere length were observed in stage 2. Within stage 1, 5-mC associated with hematocrit; telomere length associated with red blood cell count, platelet distribution width, and total cholesterol. Within stage 2, alkaline phosphatase inversely predicted 5-mC; telomere length was predicted by age, body weight, erythrocyte sedimentation rate, mean corpuscular hemoglobin concentration, alkaline phosphatase, creatinine, and uric acid (all p<0.05). Change in 5-mC related to baseline body mass index, mean corpuscular volume, glucose, red cell distribution width, mean platelet volume, creatinine, and low-density lipoprotein cholesterol; telomere length change related to baseline glucose, direct bilirubin, and albumin (all p<0.05).
Conclusions: Stage 2 SMD reflects greater metabolic burden with unfavorable 5-mC, telomere length trends. Cardiometabolic indices show independent links with 5-mC, telomere length, supporting composite biomarker strategies for ageing-risk monitoring in SMD.
Keywords: Systemic metabolic disorders, 5-methylcytosine, telomere length, cardiometabolic risk factors
Introduction
The shared pathophysiological basis of various metabolic disorders particularly their association with excess adiposity leading to insulin resistance and systemic inflammation is linked to a substantial risk of serious long-term health consequences worldwide. This recognition has prompted recent changes in current management strategies, aiming to enhance the impact of treatment on risk reduction. As a result, patients have been recently stratified into three actionable stages of systemic metabolic disorder (SMD) to reflect disease progression and enable an earlier approach to prevention from metabolic abnormalities without organ damage (stage 1) to early organ damage (stage 2) and to late-stage organ disease (stage 3).1 Each individual component of SMD including prediabetes (pre-DM) and type 2 diabetes (T2DM), metabolic dysfunction associated steatotic liver disease (MASLD), hypertension (HPT), atherogenic dyslipidemia (DL), obesity (OB), and others has been associated with accelerated biological aging, which in turn reflects increasing cardiovascular risk and overall mortality.2-6 Among the molecular mechanisms underlying aging, alterations in epigenetic regulation such as deoxyribonucleic acid (DNA) methylation have emerged as powerful tools for identifying individuals with premature aging.7 Lifestyle factors including diet, physical activity, smoking, other environmental exposures, and metabolic load can induce changes in gene expression without altering the DNA sequence, primarily through the attachment of methyl groups to nitrogenous bases of specific genes. Over time, the human DNA methylation landscape accumulates substantial changes that have been associated with a wide spectrum of age-related diseases, including metabolic disorders. Thus, detecting epigenetic marks holds promise for the early identification of individuals at risk of age-related health decline and the onset and progression of chronic diseases. Various age-related DNA methylation patterns have been described from differential and variable methylation at individual cytosine-phosphate-guanine dinucleotides (CpG) sites to whole-methylome alterations, including changes in entropy and correlation networks.8 Among these, the most powerful biomarkers of aging are based on selected individual CpG sites strongly correlated with chronological age, forming the foundation of epigenetic clocks derived from DNA methylation profiles across multiple tissues with remarkable precision.9, 10 Although global (genome-wide) DNA methylation a measure of the overall methylation status across the genome may overlook critical promoter-specific CpG changes relevant to disease pathogenesis, it remains a standardized and widely applicable parameter that allows for population-level comparisons and provides an integrated view.11 Moreover, global methylation analysis is technically straightforward, does not require sequencing or library preparation, is cost-effective for large cohorts, and offers high reproducibility, which explains its continued widespread use.
In parallel, telomere length (TL) has been established as another hallmark of cellular and premature aging. Multiple studies consistently demonstrate that shorter telomeres are associated with metabolic syndrome, type 2 diabetes, and increased cardiometabolic risk.12 TL depends on both inherited telomerase activity and progenitor telomere length. Although TL is not a classical epigenetic marker (like DNA methylation, histone modifications, or non-coding ribonucleic acids), it can be considered an epigenetic trait.13 Furthermore, a significant relationship between differentially methylated CpG sites and shortened telomeres has been demonstrated.14 Another study reported a significant association between global DNA methylation level (% 5-methylcytosine) and leukocyte TL in females among 542 healthy adolescents (44.8% African Americans; 55.2% females, aged 14 18 years).15 While it remains unclear whether these two markers independently reflect altered aging dynamics or interact synergistically to accelerate existing epigenetic changes, accumulating evidence supports the role of both methylation level alterations and TL shortening in shaping.
Despite numerous studies investigating aging biomarkers in patients with individual SMD components or comorbid conditions, integrated analyses evaluating both global DNA methylation and TL particularly simultaneously and across different SMD stages are currently lacking. Moreover, the clinical relevance of these epigenetic markers in SMD remains uncertain, specifically whether they can complement traditional biomarkers in predicting cardiovascular risk and mortality. The value of such biomarkers is further enhanced by their dynamic nature, as both can deteriorate under adverse influences and improve in response to therapy.16 Finally, hematological parameters are often overlooked as potential covariates or mediators linking DNA methylation, TL, and metabolic state, despite their routine availability in clinical practice. Recently, an increasing number of aging calculators and assessment algorithms have been developed that rely solely on circulating blood phenotypic age.17,18,19 These markers could enhance the practical utility of composite models of aging within the SMD framework. Therefore, the aim of this study was to assess the associations between 5-methylcytosine (5-mC), TL, and cardiometabolic profiles according to SMD stage and over time.
Material and Methods
Our study included 78 patients with systemic metabolic disorders (SMD), with a median age of 55.4 [49.0; 61.4] years; 56% were male. The study population comprised individuals diagnosed with HPT, OB, MASLD, T2DM, pre-DM, and DL. Participants were stratified into two groups according to the disease stage:
- Group 1: stage 1 SMD (n = 59)
- Group 2: stage 2 SMD (n = 19).
The groups were well matched for age (54.0 [49.1; 60.7] vs. 56.1 [48.9; 62.9] years; p = 0.526) and sex distribution (53% vs. 68% males; p = 0.225). All participants underwent anthropometric assessment, including measurement of height and body weight, followed by calculation of the body mass index (BMI). A comprehensive clinical blood analysis and biochemical profiling were performed using standard laboratory methods. The biochemical panel included the following parameters: alanine aminotransferase, aspartate aminotransferase, alkaline phosphatase (ALP), gamma-glutamyltransferase, total and fractionated bilirubin, glucose, total cholesterol, triglycerides, very-low-density lipoprotein cholesterol, high-density lipoprotein cholesterol, low-density lipoprotein cholesterol, uric acid, urea, creatinine, total protein, and protein fractions.
In addition, all participants were assessed for global DNA methylation, expressed as the percentage of 5-mC in leukocyte DNA extracted from peripheral blood, using a commercial 5-mC DNA ELISA Kit (Zymo Research Corp., USA). Relative telomere length (TL) was determined in peripheral blood leukocytes by quantitative real-time polymerase chain reaction (PCR). Blood samples were collected in the morning after an overnight fast. Prior to amplification, DNA concentration was quantified fluorometrically using a Qubit 3.0 fluorometer (Life Technologies, USA) and adjusted to approximately 5 ng/µL. For global DNA methylation analysis, DNA concentration was re-measured with the Qubit dsDNA HS Assay Kit (Life Technologies, USA) and normalized to approximately 100 ng per ELISA well. Optical density for ELISA measurements was determined using a semi-automated Immunochem-2100 microplate reader (USA).
Quantitative PCR was performed using the SsoAdvanced Universal SYBR Green Supermix (Bio-Rad Laboratories, USA) and gene-specific primers (Thermo Fisher Scientific, USA).
Telomere primers:
Tel-G:
ACACTAAGGTTTGGGTTTGGGTTTGGGTTTGGGTTAGTGT
Tel-C:
TGTTAGGTATCCCTATCCCTATCCCTATCCCTATCCCTAACA
Reference gene (albumin) primers:
ALBU:
CGGCGGCGGGCGGCGCGGGCTGGGCGGAAATGCTGCACAGAATCCTTG
ALBD:
GCCCGGCCCGCCGCGCCCGTCCCGCCGGAAAAGCATGGTCGCCTGTT
Relative TL, expressed in arbitrary units, was calculated as the ratio of the number of telomeric repeat copies (T) to the number of copies of a single-copy reference gene (S), normalized to a reference DNA sample included in each run.
Follow-up and repeated measurements A total of 67 patients participated in the follow-up assessment (median age, 53.9 [45.7; 59.8] years; 56% male), of whom 13% (n = 9) had stage 2 SMD. Throughout the study period, all participants continued to receive standard pharmacological therapy according to current Ukrainian and European clinical guidelines, depending on comorbid conditions. The median interval between visits was 63 weeks (range: 26 160 weeks). Based on the duration of follow-up, participants were divided into two groups:
- Group 1: re-examination within less than 1 year (n = 19)
- Group 2: re-examination after more than 1 year (n = 48).
The groups did not differ significantly in age (54.6 [46.7; 63.1] vs. 56.9 [47.2; 62.9] years; p = 0.589) or sex distribution (60% vs. 54% males; p = 0.755). Among patients with stage 2 SMD, 4 belonged to Group 1 and 5 to Group 2. At the follow-up visit, all participants underwent reassessment of body weight, BMI, complete blood count, and selected biochemical parameters, including aspartate aminotransferase, alanine aminotransferase, glucose, total cholesterol, triglycerides, very-low-density lipoprotein cholesterol, high-density lipoprotein cholesterol, low-density lipoprotein cholesterol, uric acid, urea, creatinine, and albumin. In addition, global DNA methylation (5-mC level) and TL were re-evaluated in all patients according to the methods described above.
Statistical analysis
All statistical analyses were performed using STATISTICA software and Microsoft Excel for Windows. Given the non-normal distribution of the data, nonparametric statistical methods were applied. Continuous variables are presented as median [interquartile range] (Me [Q1; Q3]). Between-group comparisons for independent samples were performed using the Mann Whitney U test, and within-group (pre- vs. post-treatment) comparisons were evaluated using the Wilcoxon signed-rank test for paired data. Differences in categorical variables were assessed using -squared (χ²) test. To further explore predictors of the outcome variables, multiple linear regression models with stepwise inclusion of predictors were employed, provided that the model residuals met the assumptions of normality. A p-value < 0.05 was considered statistically significant.
Results
Comparative characteristics of patients with systemic metabolic disorders according to disease stage
Depending on the stage of SMD, significant differences were observed in body weight and BMI. Patients with stage 2 SMD had higher body weight (89.0 [81.0; 107.0] kg vs. 82.0 [74.0; 92.8] kg, p = 0.042) and BMI (32.1 [28.9; 34.4] kg/m² vs. 27.4 [25.7; 30.6] kg/m², p = 0.001) compared with those at stage 1. No significant intergroup differences were found in the complete blood count parameters. In contrast, the biochemical profile revealed that patients with stage 2 SMD had significantly higher levels of aspartate aminotransferase (26 [20; 35] U/L vs. 22 [18; 26] U/L; p = 0.015), alanine aminotransferase (42 [20; 54] U/L vs. 24 [19; 32] U/L; p = 0.005), ALP (73 [63; 91] U/L vs. 61 [48; 77] U/L; p = 0.014), glucose (5.84 [4.92; 6.44] mmol/L vs. 5.07 [4.70; 5.32] mmol/L; p = 0.002), triglycerides (1.65 [1.31; 2.16] mmol/L vs. 1.20 [0.89; 1.61] mmol/L; p = 0.003), very-low-density lipoprotein cholesterol (0.83 [0.59; 0.97] mmol/L vs. 0.54 [0.40; 0.72] mmol/L; p = 0.004), and lower high-density lipoprotein cholesterol levels (1.19 [0.96; 1.34] mmol/L vs. 1.41 [1.20; 1.63] mmol/L; p = 0.007).
No statistically significant differences were observed in 5-mC (4.69 [3.94; 5.58] % vs. 4.27 [3.17; 4.95]%; p = 0.088) or TL (1.02 [0.75; 1.24] r.u. vs. 1.06 [0.82; 1.37] r.u.; p = 0.425) between stage 2 and stage 1 SMD, respectively, although a tendency toward increased global methylation and shorter telomeres was noted in patients with stage 2 disease. A stepwise multiple linear regression model assessing predictors of 5-mC level among all SMD patients (R² = 0.277; adjusted R² = 0.226) identified erythrocyte-related parameters mean corpuscular hemoglobin concentration (MCHC), mean corpuscular volume, hematocrit, and plateletcrit as independent determinants. Higher MCHC was positively associated with increased 5-mC levels (B = 0.032; β = 0.297; p = 0.012), whereas higher mean corpuscular volume was inversely associated (B = 0.074; β = 0.297; p = 0.012). Hematocrit (B = 0.006; β = 0.272; p = 0.019) and plateletcrit (B = 0.467; β = 0.253; p = 0.029) also showed significant positive associations with 5-mC level. Within the stage 1 SMD subgroup, a statistically significant positive association between hematocrit and 5-mC content was observed (R² = 0.086; adjusted R² = 0.066), where higher hematocrit correlated with greater global DNA methylation (B = 0.006; β = 0.293; p = 0.041). Among patients with stage 2 SMD, ALP was the only independent predictor of 5-mC levels (R² = 0.418; adjusted R² = 0.365). Higher ALP activity was associated with lower global DNA methylation (B = 0.040; β = 0.646; p = 0.017).
In the stepwise multiple linear regression model assessing predictors of relative TL among all patients with SMD (R² = 0.186; adjusted R² = 0.159), the independent determinants were red blood cell count and platelet distribution width (PDW). Higher red blood cell count was associated with longer TL (B = 0.002; β = 0.369; p = 0.003), whereas increased PDW was linked to shorter TL (B = 0.073; β = 0.255; p = 0.034). Within the stage 1 SMD subgroup, independent predictors of TL included red blood cell count, total cholesterol, and PDW (R² = 0.342; adjusted R² = 0.298). Elevated red blood cell count was positively associated with TL (B = 0.002; β = 0.469; p = 0.001), while higher total cholesterol (B = 0.132; β = 0.313; p = 0.019) and PDW (B = 0.090; β = 0.284; p = 0.028) were inversely associated. Analysis of TL determinants among patients with stage 2 SMD demonstrated that the independent predictors were age category (<45 years, 45 60 years, >60 years), body weight, ALP, erythrocyte sedimentation rate, creatinine, MCHC, and uric acid (R² = 0.999; adjusted R² = 0.997). Elongation of TL was associated with higher erythrocyte sedimentation rate (B = 0.024; β = 0.943; p < 0.001), MCHC (B = 0.003; β = 0.137; p = 0.003), and uric acid (B = 0.0001; β = 0.092; p = 0.007), whereas older age category (B = 0.160; β = 0.558; p < 0.001), increased body weight (B = 0.004; β = 0.290; p < 0.001), higher ALP (B = 0.009; β = 0.720; p < 0.001), and elevated creatinine (B = 0.004; β = 0.257; p < 0.001) were associated with shorter TL.
Dynamics of parameters over time and according to the duration of follow-up
Significant differences between the first and follow-up visits among patients with SMD were observed only in serum albumin levels (43.5 [41.5; 47.5] g/L vs. 41.9 [38.1; 45.3] g/L; p = 0.042). Levels of 5-mC (5.25 [4.04; 6.51] % vs. 4.50 [3.74; 5.66] %; p = 0.168) and TL (1.06 [0.83; 1.16] r.u. vs. 1.04 [0.79; 1.33] r.u.; p = 0.759) did not change significantly. The median individual change in 5-mC was 0.66 [ 1.66; 0.40] % and in TL was 0.02 [ 0.22; 0.29] r.u., indicating a trend toward decreasing global DNA methylation over time without substantial telomere alterations. When comparing subgroups by follow-up duration, no significant differences in studied parameters were observed among patients re-examined within one year. In those followed for more than one year, improvements were noted in aspartate aminotransferase (21 [17; 28] U/L vs. 26 [20; 36] U/L; p = 0.047), glucose (5.13 [4.70; 5.42] mmol/L vs. 5.44 [5.18; 5.67] mmol/L; p = 0.020), and albumin (41.5 [38.0; 44.4] g/L vs. 44.3 [41.8; 48.8] g/L; p = 0.004). No significant differences between patients followed for <1 year and >1 year were found for median individual changes in 5-mC ( 0.66 [ 1.67; 0.21] % vs. 0.66 [ 1.70; 0.41] %; p = 0.515) or TL (0.18 [ 0.08; 0.28] r.u. vs. 0.04 [ 0.25; 0.34] r.u.; p = 0.515). Distribution analysis showed that 62% of patients exhibited a decrease in 5-mC, while 38% showed an increase after the follow-up period. These subgroups were comparable in age (53.9 [44.9; 61.7] vs. 59.3 [54.0; 62.8] years; p = 0.169) but differed by sex (71% vs. 31% males; p = 0.020), suggesting a potential sex-related influence on DNA methylation dynamics. When grouped by TL change, 50% of patients demonstrated telomere shortening. The two subgroups did not differ significantly in age (59.3 [49.6; 63.3] vs. 55.0 [46.4; 60.4] years; p = 0.496) or sex (41% vs. 71% males; p = 0.084).
In the stepwise multiple linear regression model with 5-mC level at follow-up as the dependent variable and all second-visit parameters as independent variables, direct bilirubin and PDW emerged as independent predictors (R² = 0.307; adjusted R² = 0.259). Higher direct bilirubin (B = 0.485; β = 0.468; p = 0.006) and increased PDW (B = 0.351; β = 0.369; p = 0.025) were associated with lower 5-mC levels. Among patients re-examined within one year, white blood cells (WBC) count, glucose, and triglycerides were identified as independent predictors of 5-mC (R² = 0.927; adjusted R² = 0.891). Higher triglycerides (B = 1.684; β = 0.663; p = 0.001) and glucose (B = 0.557; β = 0.321; p = 0.035) were associated with lower 5-mC, while higher WBC (B = 0.385; β = 0.612; p = 0.002) associated with increased 5-mC. No significant predictors of 5-mC were identified among patients with a follow-up interval longer than one year. For TL, the only independent predictor at follow-up across all patients was MCHC (R² = 0.141; adjusted R² = 0.112), where higher MCHC was associated with longer TL (B = 0.011; β = 0.376; p = 0.034). Among patients with a follow-up of less than one year, WBC was the sole independent predictor of TL (R² = 0.520; adjusted R² = 0.461): higher WBC was associated with shorter TL (B = 0.103; β = 0.721; p = 0.019). No significant TL predictors were identified among patients with longer follow-up. Correlation analysis revealed that changes in 5-mC were significantly associated with age (r = 0.356; p = 0.039), sex (r = 0.477; p = 0.004), and baseline 5-mC level (r = 0.533; p = 0.001). Changes in TL showed a positive association with baseline 5-mC (r = 0.440; p = 0.009) and an inverse association with baseline TL (r = 0.449; p = 0.008). In the subgroup of patients followed for less than one year, no such correlations were observed. However, in those with a follow-up exceeding one year, patterns were similar to those in the total cohort: changes in 5-mC correlated significantly with sex (r = 0.514; p = 0.010) and baseline 5-mC (r = 0.541; p = 0.006), while changes in TL were associated with baseline 5-mC (r = 0.488; p = 0.015) and baseline TL (r = 0.519; p = 0.009).
Table 1 summarizes baseline variables included in -mC as the dependent variable (R² = 0.786; adjusted R² = 0.753). Although the interval between visits was initially a significant predictor (p = 0.040), it was not retained in the final model due to a reduction in partial correlation and overlap with other predictors, suggesting that the effect of observation duration is mediated by other metabolic and cellular parameters.
| Predictors | B | β | p |
|---|---|---|---|
| 5-mC | 0.859 | 0.856 | < 0.001 |
| RDW | 0.556 | 0.682 | < 0.001 |
| MPV | 1.153 | 0.452 | < 0.001 |
| TL | 2.634 | 0.447 | < 0.001 |
| Glucose | 0.445 | 0.189 | 0.022 |
| MCV | 0.091 | 0.376 | < 0.001 |
| Creatinine | 0.036 | 0.357 | < 0.001 |
| VLDL-C | 0.417 | 0.299 | < 0.001 |
| BMI | 0.079 | 0.214 | 0.033 |
Independent predictors of changes in TL identified in the stepwise regression model (R² = 0.532; adjusted R² = 0.494) are presented in Table 2.
| Predictors | B | β | p |
|---|---|---|---|
| TL | 0.706 | 0.468 | < 0.001 |
| 5-mC | 0.087 | 0.337 | 0.001 |
| Direct bilirubin | 0.021 | 0.227 | 0.012 |
| Albumin | 0.024 | 0.221 | 0.019 |
| Glucose | 0.110 | 0.182 | 0.045 |
Discussion
The comparison of patients at different stages of SMD revealed a deterioration in anthropometric profile and less favorable markers of metabolic status particularly those reflecting disturbances in carbohydrate and lipid metabolism as well as liver function tests. These differences may result from disease progression, including transition from steatosis to steatohepatitis or hepatic fibrosis, from pre-DM to T2DM, and the development of subclinical atherosclerosis against the background of DL and increasing OB severity. At the same time, the patterns of 5-mC and TL likely reflect long-term metabolic stress under the influence of the therapy carried out so far, which may account for the lack of significant differences.20 These findings emphasize the need for more detailed categorization of patients, considering the duration and severity of each condition contributing to SMD stage, as well as incorporating follow-up duration to better estimate the timing of meaningful epigenetic alterations.
In the context of MASLD and liver fibrosis, the lack of significant group differences may be partly explained by the relatively young age of the study population. According to Rattan et al. (2022), the association between TL and liver disease particularly advanced fibrosis was observed only in 21. In the context of T2DM, the absence of major differences between patients with stage 2 and stage 1 SMD (including prediabetes), despite significant differences in glucose levels, could be due to well-controlled disease and maintenance of normoglycemia in most patients (as suggested by the median glucose levels presented above). Supporting this hypothesis, Lyu et al. (2020) reported that TL was inversely related to hemoglobin A1c, interleukin-6, tumor necrosis factor alpha, and that a link between telomere shortening and mitochondrial dysfunction was evident only under hyperglycemia, a key pathogenic mechanism underlying many age-related and cardiometabolic disorders.22 With respect to HTN, telomere shortening is typically observed and is concomitantly associated with the development of heart failure another component of stage 2 SMD. Among 646 hypertensive patients under 65 years with cardiovascular risk factors (Zhang A. et al., 2025), heart failure prevalence increased with shorter TL (15.7%, 11.2%, and 7.9% across leukocyte TL tertiles; p = 0.037) at 5-year follow-up.23 Thus, the absence of significant differences in our study may stem from the low prevalence of heart failure among patients with stage 2 SMD. However, this assumption requires further investigation, as we did not assess the specific contribution of each comorbidity to the observed outcomes, given that it was not the primary aim of this analysis. Moreover, Zhang et al. reported that participants in the short-TL group, compared with those with long telomeres, had a higher prevalence of male sex, hyperlipidemia, diabetes, and CHD, along with elevated blood pressure and fasting glucose factors that would be expected to be more common and pronounced in stage 2 than in stage 1 SMD. Therefore, further studies are warranted not only across SMD stages but also considering within-stage stratification by TL to better understand its role in cardiometabolic aging.
In addition, the high interindividual variability of 5-mC and TL levels driven by underlying influencing factors rather than the disease itself: genetic background, lifestyle factors (stress, diet, physical activity), and pharmacological impact (patient compliance, treatment modality, and therapy duration) not assessed in this study may also explain the absence of statistically significant between-group differences.24, 25 Overall, 5-mC levels and TL in patients with SMD were determined primarily by hematologic and metabolic parameters, but the pattern of associations varied substantially by SMD stage and over time (Fig. 1).
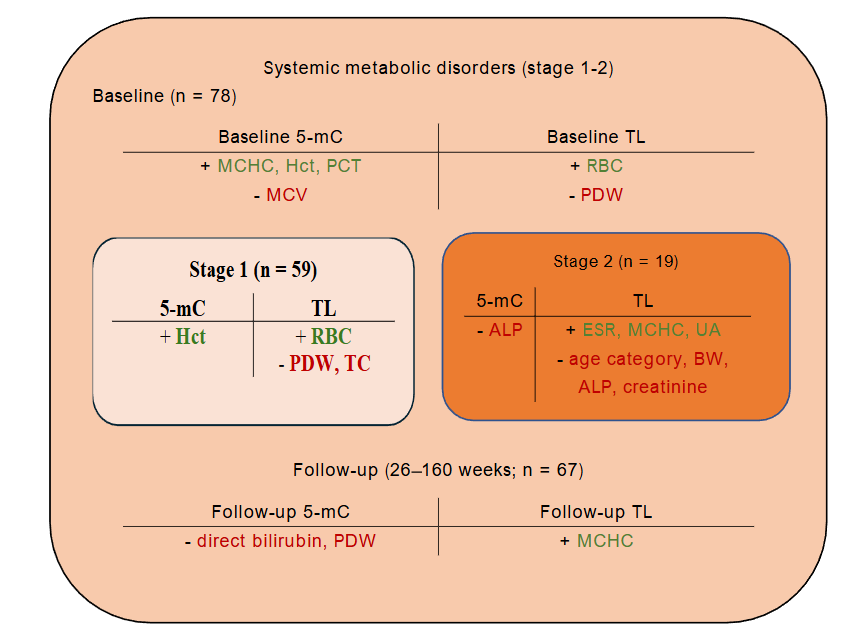
Levels of 5-mC were mainly driven by erythropoietic and platelet-related markers (MCHC, mean corpuscular volume, hematocrit, plateletcrit) in the overall cohort, with hematocrit remaining the key determinant in stage 1 and ALP emerging as the single predictor in stage 2. At follow-up, the determinants shifted toward markers of hepatobiliary function and platelet activity (direct bilirubin, PDW). In patients re-examined within one year, metabolic and inflammatory indicators (WBC, glucose, triglycerides) became dominant predictors, suggesting that treatment- or disease-related metabolic changes modulate DNA methylation dynamics. In the entire cohort, TL was influenced by erythropoietic and thrombopoietic activity (red blood cell count, PDW), with stage-specific profiles: red blood cell count, total cholesterol, and PDW predicted TL in stage 1, whereas in stage 2 TL reflected a broader set of age-, metabolic-, inflammatory, and erythropoietic-related determinants (age category, body weight, ALP, erythrocyte sedimentation rate, creatinine, MCHC, uric acid). At follow-up, TL was largely dependent on MCHC overall, while WBC predicted TL shortening in patients with <1-year intervals, indicating that inflammatory status and possible therapy-related changes influence telomere dynamics over time.
Conclusions
Stage 2 systemic metabolic disorder (SMD) exhibited a less favorable anthropometric and biochemical profile, together with a shift toward deoxyribonucleic acid hypermethylation and telomere attrition, suggesting potential exhaustion of compensatory epigenetic mechanisms. Predictors of 5-methylcytosine (5-mC) levels differed by stage: hematocrit (p = 0.041) in stage 1 and alkaline phosphatase (p = 0.017) in stage 2. In stage 1 SMD, telomere length (TL) was positively associated with red blood cell count (p = 0.001) and negatively associated with platelet distribution width (p = 0.028) and total cholesterol (p = 0.019). In stage 2, TL elongation correlated with higher erythrocyte sedimentation rate (p < 0.001), mean corpuscular hemoglobin concentration (p = 0.003), and uric acid (p = 0.007), whereas TL shortening was associated with older age (p < 0.001), greater body weight (p < 0.001), elevated alkaline phosphatase (p < 0.001), and increased creatinine (p < 0.001).
Longitudinal analyses indicated that a decline in 5-mC was predicted by higher baseline 5-mC, TL, glucose, mean corpuscular volume, and body mass index. In contrast, increases in 5-mC were associated with higher red cell distribution width, mean platelet volume, creatinine, and low-density lipoprotein cholesterol (p < 0.05 for all pairs). Telomere shortening over follow-up was associated with elevated baseline glucose (p = 0.045) and direct bilirubin (p = 0.012), together with lower albumin (p = 0.019). Conversely, higher 5-mC promoted TL elongation (p = 0.001), while longer baseline TL predicted more pronounced subsequent shortening (p < 0.001).
These findings support the potential utility of composite biomarkers integrating anthropometric and biochemical parameters for early detection and prediction of adverse epigenetic shifts in patients with SMD.
Conflict of Interest:
The authors declare no conflicts of interest related to the publication of this article.
Funding Statement:
The authors received no financial support for the research, authorship, and/or publication of this article.
References:
- Romeo S, Vidal-Puig A, Husain M, et al. Clinical staging to guide management of metabolic disorders and their sequelae: a European Atherosclerosis Society consensus statement. Eur Heart J. 2025 May 7;ehaf314. doi:10.1093/eurheartj/ehaf314
- Wu N, Fu J. Association of biological age acceleration with mortality in adults with diabetes or prediabetes: a mediating role of physical activity. Aging Clin Exp Res. 2025 Oct 30;37(1):310. doi:10.1007/s40520-025-03204-3
- He QJ, Li YF, Zhao LT, Lin CT, Yu CY, Wang D. Recent advances in age-related metabolic dysfunction-associated steatotic liver disease. World J Gastroenterol. 2024 Feb 21;30(7):652. doi:10.3748/wjg.v30.i7.652
- Abugroun A, Shah SJ, Fitzmaurice G, et al. The association between accelerated biological aging and cardiovascular outcomes in older adults with hypertension. Am J Med. 2025 Mar 1;138(3):487-94. doi:10.1016/j.amjmed.2024.10.029
- Xiang Q, Tian F, Xu J, Du X, Zhang S, Liu L. New insight into dyslipidemia-induced cellular senescence in atherosclerosis. Biol Rev Camb Philos Soc. 2022 Oct;97(5):1844-67. doi:10.1111/brv.12866
- Kivimäki M, Frank P, Pentti J, et al. Obesity and risk of diseases associated with hallmarks of cellular ageing: a multicohort study. Lancet Healthy Longev. 2024 Jul 1;5(7):e454-63. doi:10.1016/S2666-7568(24)00087-4
- Bernabeu E, McCartney DL, Gadd DA, et al. Refining epigenetic prediction of chronological and biological age. Genome Med. 2023 Feb 28;15(1):12. doi:10.1186/s13073-023-01161-y
- Seale K, Horvath S, Teschendorff A, Eynon N, Voisin S. Making sense of the ageing methylome. Nat Rev Genet. 2022 Oct;23(10):585-605. doi:10.1038/s41576-022-00477-6
- Liang R, Tang Q, Chen J, Zhu L. Epigenetic clocks: beyond biological age, using the past to predict the present and future. Aging Dis. 2024 Dec 13;16(6):3520. doi:10.14336/AD.2024.1495
- Margiotti K, Monaco F, Fabiani M, Mesoraca A, Giorlandino C. Epigenetic clocks: in aging-related and complex diseases. Cytogenet Genome Res. 2023 Dec 28;163(5-6):247-56. doi:10.1159/000534561
- Wu YL, Lin ZJ, Li CC, et al. Epigenetic regulation in metabolic diseases: mechanisms and advances in clinical study. Signal Transduct Target Ther. 2023 Mar 2;8(1):98. doi:10.1038/s41392-023-01333-7
- Gavia-García G, Rosado-Pérez J, Arista-Ugalde TL, Aguiñiga-Sánchez I, Santiago-Osorio E, Mendoza-Núñez VM. Telomere length and oxidative stress and its relation with metabolic syndrome components in the aging. Biology (Basel). 2021 Mar 24;10(4):253. doi:10.3390/biology10040253
- Henriques CM, Ferreira MG. Telomere length is an epigenetic trait Implications for the use of telomerase-deficient organisms to model human disease. Dis Model Mech. 2024 Mar 1;17(3):dmm050581. doi:10.1242/dmm.050581
- Carlund O, Norberg A, Osterman P, Landfors M, Degerman S, Hultdin M. DNA methylation variations and epigenetic aging in telomere biology disorders. Sci Rep. 2023 May 16;13(1):7955. doi:10.1038/s41598-023-34922-1
- Dong Y, Huang Y, Gutin B, Raed A, Dong Y, Zhu H. Associations between global DNA methylation and telomere length in healthy adolescents. Sci Rep. 2017 Jun 23;7(1):4210. doi:10.1038/s41598-017-04493-z
- Haupt S, Niedrist T, Sourij H, Schwarzinger S, Moser O. The impact of exercise on telomere length, DNA methylation and metabolic footprints. Cells. 2022 Jan 4;11(1):153. doi:10.3390/cells11010153
- Kolesnikova OV, Radchenko AO, Zaprovalna OY. The association of clinical and biochemical indicators with the rate of aging in patients with arterial hypertension during wartime. Arter Hypertens. 2025;29:45-52. doi:10.5603/ah.102288
- Levine ME, Lu AT, Quach A, et al. An epigenetic biomarker of aging for lifespan and healthspan. Aging (Albany NY). 2018 Apr 17;10(4):573. doi:10.18632/aging.101414
- Bortz J, Guariglia A, Klaric L, et al. Biological age estimation using circulating blood biomarkers. Commun Biol. 2023 Oct 26;6(1):1089. doi:10.1038/s42003-023-05456-z
- Mostafavi Abdolmaleky H, Zhou JR. Gut microbiota dysbiosis, oxidative stress, inflammation, and epigenetic alterations in metabolic diseases. Antioxidants (Basel). 2024 Aug 14;13(8):985. doi:10.3390/antiox13080985
- Rattan P, Penrice DD, Ahn JC, et al. Inverse association of telomere length with liver disease and mortality in the US population. Hepatol Commun. 2022 Feb;6(2):399-410. doi:10.1002/hep4.1803
- Lyu L, He S, Zhang H, et al. TNFα mediates the interaction of telomeres and mitochondria induced by hyperglycemia: a rural community-based cross-sectional study. Oxid Med Cell Longev. 2020;2020:8235873. doi:10.1155/2020/8235873
- Zhang A, Tang Z, Chang AC, et al. Leukocyte telomere length and risk of heart failure with preserved ejection fraction in high-risk Chinese patients with hypertension under 65 years. GeroScience. 2025 Oct 31:1-3. doi:10.1007/s11357-025-01979-x
- Yin H, Pickering JG. Telomere length: implications for atherogenesis. Curr Atheroscler Rep. 2023 Mar;25(3):95-103. doi:10.1007/s11883-023-01082-6
- Maleknia M, Ahmadirad N, Golab F, Katebi Y, Haj Mohamad Ebrahim Ketabforoush A. DNA methylation in cancer: epigenetic view of dietary and lifestyle factors. Epigenetics Insights. 2023 Sep;16:25168657231199893. doi:10.1177/25168657231199893
- Van Der Spek A, Karamujić-Čomić H, Pool R, et al. Fat metabolism is associated with telomere length in six population-based studies. Hum Mol Genet. 2022 Apr 1;31(7):1159-70. doi:10.1093/hmg/ddab281
- Lejawa M, Osadnik K, Osadnik T, Pawlas N. Association of metabolically healthy and unhealthy obesity phenotypes with oxidative stress parameters and telomere length in healthy young adult men: analysis of the MAGNETIC study. Antioxidants (Basel). 2021 Jan 11;10(1):93. doi:10.3390/antiox10010093
- Tzounakas VL, Anastasiadi AT, Arvaniti VZ, et al. Supplementation with uric and ascorbic acid protects stored red blood cells through enhancement of non-enzymatic antioxidant activity and metabolic rewiring. Redox Biol. 2022 Nov 1;57:102477. doi:10.1016/j.redox.2022.102477
- Copur S, Demiray A, Kanbay M. Uric acid in metabolic syndrome: does uric acid have a definitive role? Eur J Intern Med. 2022 Sep 1;103:4-12. doi:10.1016/j.ejim.2022.04.022
- Allaire P, He J, Mayer J, et al. Genetic and clinical determinants of telomere length. Hum Genet Genom Adv. 2023 Jul 13;4(3):100201. doi:10.1016/j.xhgg.2023.100201
- Marti A, de la Puente MF, Canudas S, et al. Effect of a 3-year lifestyle intervention on telomere length in participants from PREDIMED-Plus: a randomized trial. Clin Nutr. 2023 Sep 1;42(9):1581-7. doi:10.1016/j.clnu.2023.06.03