


Epigenetic Impact of Iron Deficiency on Cancer Risk
Part II: The Sound of Silence, Latent Iron Deficiency: Orchestrating Epigenetic Tunes of Neoplastic Transformation
Glenn Tisman, M.D.1
- Associate in Pathology, Columbia University; Fellow, Medicine-Hematology-Oncology, Bronx VA/ Mount Sinai/Mt. Sinai Hospital Joint Program; Fellow, Medical Oncology, Keck School of Medicine, USC
OPEN ACCESS
PUBLISHED: 31 December 2025
CITATION: Tisman, G., 2025. Part II: The Sound of Silence, Latent Iron Deficiency: Orchestrating Epigenetic Tunes of Neoplastic Transformation. Medical Research Archives, [online] 13(12). https://doi.org/10.18103/mra.v13i12.7129
COPYRIGHT © 2025 European Society of Medicine. This is an open-access article distributed under the terms of the Creative Commons Attribution License, which permits unrestricted use, distribution, and reproduction in any medium, provided the original author and source are credited.
DOI https://doi.org/10.18103/mra.v13i12.7129
ISSN 2375-1924
Abstract for Part II: The Sound of Silence, Latent Iron Deficiency Orchestrating Epigenetic Tunes of Neoplastic Transformation
Background: While chronic oxidative stress is an established driver of carcinogenesis, the mechanisms by which transient molecular insults are converted into stable, heritable pro-malignant states are a key area of investigation. Epigenetic modifications provide a plausible link between environmental or metabolic stressors and the long-term alterations in gene expression that precede overt cancer.
Objective: This review explores how chronic oxidative stress, often initiated by latent micronutrient deficiencies, orchestrates a durable epigenetic reprogramming that silences tumor-suppressor genes and activates oncogenic pathways. It details the transition from a reversible stress response to a fixed “epigenetic lock-in” that defines the premalignant state.
Findings: The manuscript details how persistent reactive oxygen species (ROS) disrupt the function of critical epigenetic-modifying enzymes, including iron-dependent TET and JmjC demethylases. This impairment leads to aberrant DNA hypermethylation at CpG islands and the deposition of repressive histone marks (e.g., H3K27me3), which silence key tumor-suppressor genes. Concurrently, non-coding RNAs (ncRNAs) guide these repressive complexes, reinforcing a malignant gene expression program that can be passed through cell divisions. This epigenetic memory explains the long latency periods observed in premalignant lesions and establishes a molecular foundation for field cancerization.
Conclusion: Epigenetic alterations function as the central mechanism translating chronic metabolic stress into a durable, cancer-prone cellular identity. These modifications are not only biomarkers for early risk assessment but also represent a crucial, druggable checkpoint. Therapeutic strategies targeting epigenetic regulators, such as DNMT, HDAC, and BET inhibitors, offer a promising avenue to reset the aberrant epigenetic landscape, thereby preventing or reversing malignant progression.
Keywords
latent iron deficiency, epigenetic transformation, oxidative stress, neoplastic transformation, tumor-suppressor genes, oncogenic pathways
Introduction
Many patients have undetected biochemical stresses that cause chronic oxidative stress due to micronutrient deficiencies, inflammation, or environmental exposures. These stresses lead to the production of reactive oxygen species (ROS) that damage DNA, proteins, and lipids. DNA damage includes oxidized bases, missing bases, and strand breaks, with incomplete repair often causing mutations. Oxidative stress changes gene expression through chromatin and epigenetic modifications, suppressing protective genes and activating survival pathways, which can push cells toward malignancy. Iron deficiency, affecting nearly one of every four Americans despite normal hemoglobin levels, weakens enzymes that remove repressive epigenetic marks, silencing genes crucial for differentiation, immunity, and metabolic stability, thereby promoting metabolic disruption and a pre-cancerous state.
Reactive Oxygen and Nitrogen Species
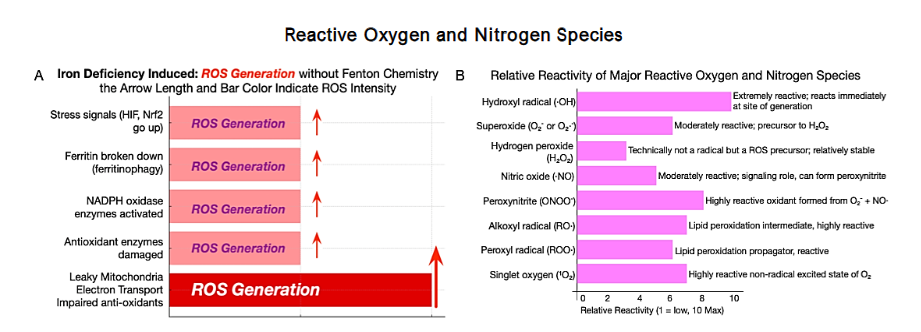
Reactive oxygen species (ROS) as the common pathway linking lifestyle exposures to epigenetic and metabolic dysregulation. Multiple everyday exposures may converge to sustain a persistent ROS excess that damages DNA and imprints epigenetic changes, thereby lowering the threshold for potential malignant transformation. Shortened and Simplified Oxidative Stress and Reactive Oxygen and Nitrogen Species as Harbingers of Carcinogenesis. Hidden biochemical changes precede tumors. Chronic oxidative stress from micronutrient deficiencies, inflammation, or environmental exposures disrupts normal physiology. Reactive oxygen species (ROS) and reactive nitrogen species (RNS) from mitochondria, immune responses, or environmental insults damage DNA, proteins, and lipids, altering metabolism and immunity.
Three key transcription factor pathways are involved:
NF-κB, chronically activated by oxidative stress, regulates inflammation and immune genes; HIF-1α and HIF-2α, stabilized in hypoxia or iron deficiency, promote glycolysis and angiogenesis; and Nrf2, which activates antioxidant genes but can support tumor survival. These factors form a network driving inflammation, metabolism, and survival, contributing to cancer. Persistent stressors like iron deficiency, obesity, smoking, or chronic inflammation (Figure 3) cause error-prone DNA repair, leading to mutations. Epigenetic marks on DNA and histones lock in maladaptive gene expression. HIFs, Nrf2, and NF-κB amplify each other, reinforcing a cancer-prone metabolic state that persists even if stressors subside.
Epigenetic Mechanisms of Malignant Transformation
The first part of this series of three manuscripts emphasized how oxidative stress, if unresolved, disrupts normal cellular adaptation. This manuscript represents the next step in understanding how these disturbances become ingrained in the cell’s long-term memory through epigenetic mechanisms, such as DNA methylation and histone tail modification.
Epigenetics thus refers to chemical modifications, including DNA methylation and histone modifications, that regulate gene activity without altering the underlying DNA sequence. Epigenetic marks like DNA methylation and histone modifications act as switches, opening or compacting chromatin. In healthy cells, these marks adapt to oxygen, nutrients, and redox balance, reversing under acute oxidative stress. Chronic stress reduces plasticity: repressive methylation accumulates in malignant tissue and adjacent normal epithelium (field involvement), silencing tumor-suppressor genes while oncogenic programs remain accessible. This shifts transient signaling to heritable regulation, persisting through cell divisions. Oxidative stress creates a lasting epigenetic record, lowering the malignancy threshold over time. Clinically: (1) epigenetic changes precede visible dysplasia, altering gene expression in microscopically normal cells; (2) these reversible marks are diagnostic and therapeutic targets via diet or drugs; (3) micronutrient deficiencies, like iron, impair Fe²⁺/α-ketoglutarate-dependent demethylases (TET and Jumonji-C), causing persistent methylation and tumor-suppressor silencing. Chronic oxidative imbalance reprograms the genome. Aberrant marks are copied through cell divisions, perpetuating malignancy even after stress resolves, explaining why silent deficiencies and inflammation precede cancer by years.
Reactive Oxygen Species Bridge Epigenetic Change and Inflammatory Activation
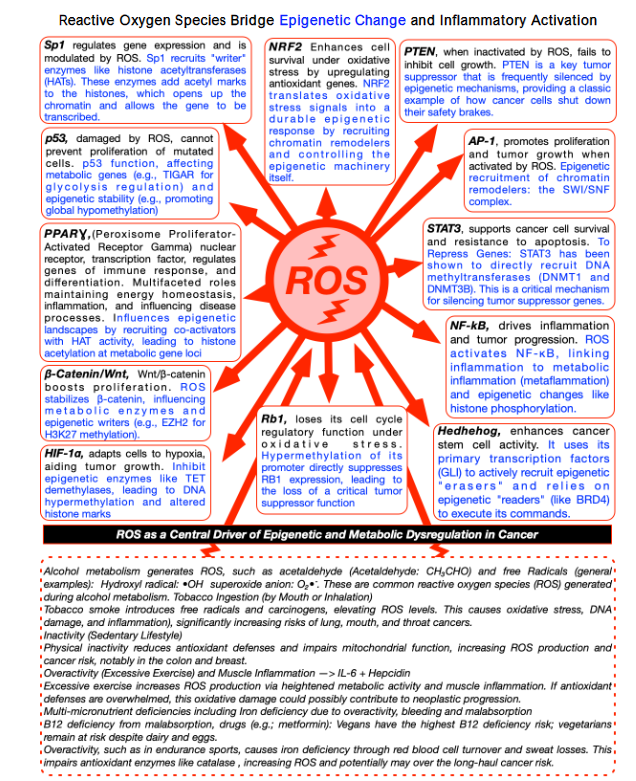
Reactive oxygen species link epigenetics and inflammation. Oxidative stress is linked to molecular injury, epigenetic reprogramming, and chronic inflammation. Reactive oxygen species act as second messengers, signaling to transcription factors and chromatin-modifying enzymes, altering inflammatory responses and gene regulation. Persistent ROS induce stable DNA methylation and histone modifications, locking in gene expression patterns that predispose to neoplastic changes. Physiologically, ROS modulate hypoxia-inducible factor (HIF) signaling, linking redox state to normal cellular adaptation. Dysregulated ROS amplify HIF and inflammatory signaling, driving carcinogenic potential. Chronic oxidative stress disrupts the tumor-suppressor defenses of p53, which safeguards against DNA damage, RB1, which acts as a brake on the cell cycle, and PTEN, which blocks excessive growth signals. At the same time, it amplifies pro-cancer pathways: inflammatory signaling that promotes survival and proliferation, cell-to-cell adhesion changes that encourage invasion, and metabolic reprogramming that fuels tumor progression. These converge on the epigenome, shifting DNA methylation, histone modifications, and chromatin accessibility, silencing protective genes and unlocking growth programs. Chronic inflammation and reactive oxygen species form self-reinforcing cycles, worsened by conditions such as gastritis, colitis, or iron deficiency, progressively lowering the threshold for oncogenic development over time. Silent silencing of tumor-suppressor genes precedes histologic dysplasia. At the same time, survival, metabolic, angiogenic, and immune evasion pathways lock in. Initially reversible, these changes may become permanent, explaining slow progression in premalignant lesions (Barrett’s esophagus, colon adenomas, atypical breast lesions).
From Oxidative Stress to Epigenetic Lock-In
Chronic oxidative stress disrupts redox homeostasis, overwhelming antioxidant defenses and driving molecular reprogramming. Transcription factors (NF-κB, HIF-1α/HIF-2α, NRF2) stay active, and epigenetic marks lock in aberrant states, silencing tumor-suppressor genes, impairing DNA repair, and redirecting metabolism toward proliferation. These changes, often silent for years, may predispose premalignant conditions (e.g., ductal/lobular carcinoma in situ, Barrett’s esophagus, high-grade prostatic intraepithelial neoplasia) to dangerous neoplasia despite appearing stable. Latency to cancer varies from 3 to over 20 years, with epigenetic changes preceding detectable genetic alterations and passing to daughter cells. Per Ames’s triage theory, micronutrient deficiencies (iron, vitamin B₁₂, folate) prioritize survival over genomic maintenance, causing DNA damage and epigenetic shifts that set the stage for advanced neoplastic lesions. Early ROS and inflammatory signaling rewire metabolism, angiogenesis, and immune evasion, consolidating via epigenetic lock-in with repressive histone and CpG methylation at tumor-suppressor loci, while oncogenic programs gain chromatin accessibility. Iron- and 2-oxoglutarate-dependent demethylases are inhibited, stabilizing hypoxia signaling and suppressing anticancer mechanisms. Chronic ROS from inflammation, smoking, obesity, or alcohol boosts NF-κB and HIF, fostering a tumor-friendly microenvironment. Low folate and vitamin B₁₂ impair DNA methylation, while iron deficiency silences anticancer genes. Addressing these may not reverse epigenetic marks but can slow neoplastic progression. Premalignant lesions vary in progression risk. Lobular carcinoma in situ shows methylation changes like early breast cancer, marking an elevated risk. Gallstone-related cholecystitis has low transformation risk unless high-risk features exist. Bronchial squamous dysplasia or high-grade vulvar intraepithelial neoplasia progresses faster, within ~3 years, while indolent lesions may take >20 years. Age, comorbidities, and lifestyle (smoking, alcohol, obesity) accelerate progression to oncogenesis. Molecular alterations increase risk even in “low-grade” histology.
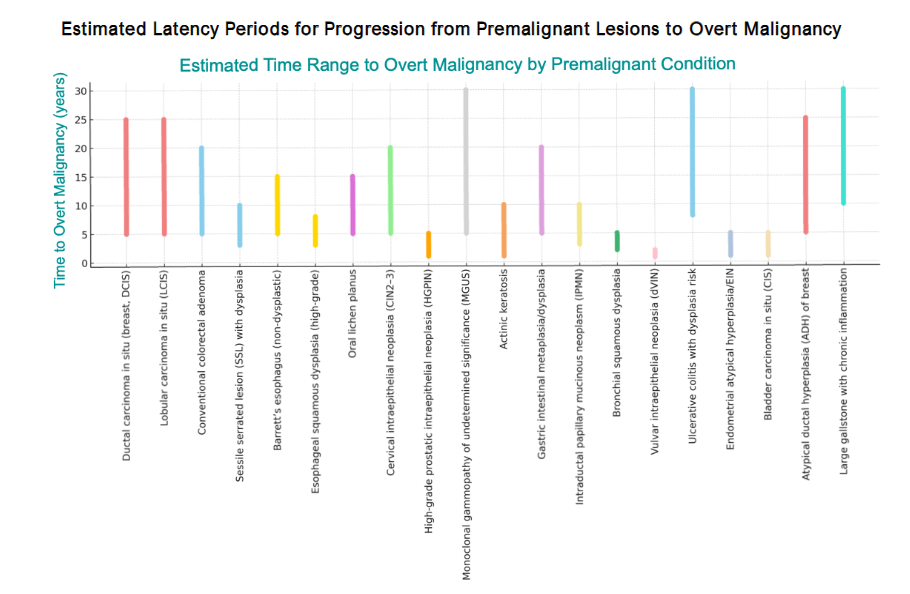
Premalignant Lesions and Estimated Risks of Progression to Malignancy
| Premalignant Lesion | Estimated Risk of Malignant Transformation |
|---|---|
| Ductal Carcinoma in Situ (DCIS) | If unmanaged, historical series suggest ~14-53% progress to invasive cancer over 10 years (low-grade ~35-50% over decades). |
| Lobular Carcinoma in Situ (LCIS) | Annual invasive breast cancer incidence ~1-2% (15-30% over 10-20 y) without chemoprevention. |
| Traditional Serrated Adenoma (Colorectal) | Dysplastic serrated polyp with significant malignant potential; complete excision and surveillance recommended. |
| Sessile Serrated Lesion with Dysplasia | High risk: series report frequent synchronous advanced neoplasia and not-infrequent coexistent carcinoma at diagnosis. |
| Barrett’s Esophagus (Non-Dysplastic) | ~0.12-0.3% per year to EAC; higher with dysplasia. |
| Esophageal Squamous Dysplasia (High-Grade) | Approx. 6-9% annual risk of ESCC; ~4% per year for mild moderate. |
| High-Grade Prostatic Intraepithelial Neoplasia (HGPIN) | Modern series: ~25% detection of carcinoma on repeat biopsy overall; higher (30-40%) if multifocal. |
| Oral Lichen Planus | Pooled malignant transformation risk ~0.5-1% (varies by subtype and criteria). |
| Cervical Intraepithelial Neoplasia (CIN3) | Long-term untreated CIN3 carries substantial risk; cohort estimates ~30%+ progression over extended follow-up. |
| Intraductal Papillary Mucinous Neoplasm (Pancreas) | Risk varies by type; ~5-10% over 5 y in branch-duct IPMN without high-risk features; higher in main-duct or with worrisome features. |
| Monoclonal Gammopathy of Undetermined Significance (MGUS) | Average progression ~1% per year to myeloma or related disorders. |
| Actinic Keratosis | Per-lesion annual progression to invasive SCC typically 0.025-0.6%; higher in high-risk patients. |
| Gastric Intestinal Metaplasia | Average annual gastric cancer risk ~0.25-0.6%; elevated with extensive IM, incomplete subtype, or H. pylori. |
| Bronchial Squamous Dysplasia (High-Grade) | High-grade and persistent lesions carry markedly increased risk of SCC on follow-up. |
| Vulvar Intraepithelial Neoplasia (VIN) | Transformation estimates vary; roughly 10-15% if untreated, higher in differentiated VIN. |
| Ulcerative Colitis with Low-Grade Dysplasia | Meta-analyses: CRC ~0.8%/y; advanced neoplasia ~1.8%/y following LGD. |
| Endometrial Atypical Hyperplasia / EIN | Concurrent carcinoma at hysterectomy ~30-50%; progression risk ~8% per y without treatment. |
| Bladder Carcinoma in Situ (CIS) | If untreated, up to ~50% progress to muscle-invasive disease; high-risk NMIBC category. |
| Atypical Ductal Hyperplasia (ADH) | ~7% at 5 y; ~13% at 10 y; ~29-30% at 25 y (long-term cohort). |
| Chronic Cholecystitis with Large Gallstone | Absolute annual risk low (<1%/y), but large stones (>3 cm) confer distinctly higher gallbladder cancer risk. |
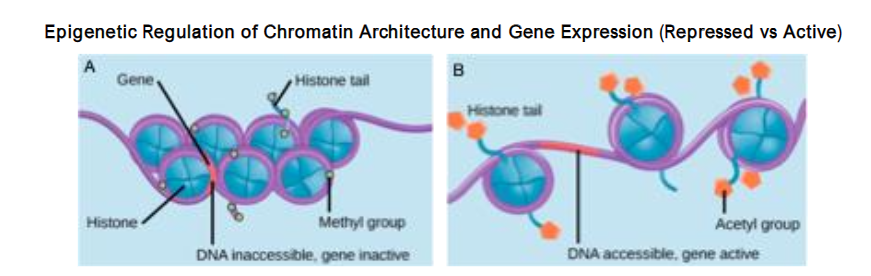
Epigenetic Regulation of Chromatin and Gene Expression
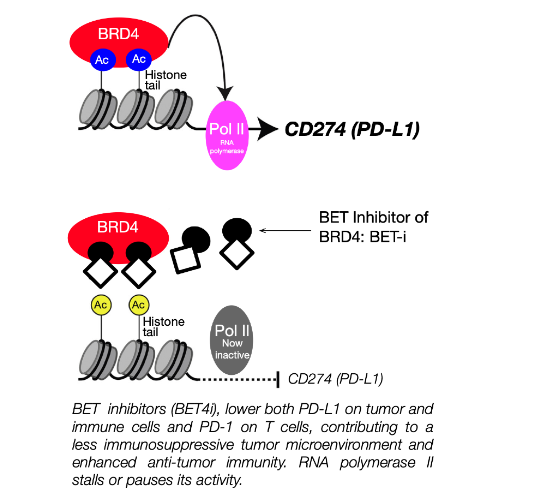
Epigenetic changes regulate gene activity through chromatin without altering the underlying DNA sequence. Histone tails in repressed chromatin (heterochromatin) carry marks (H3K27me3, H3K9me3), condensing DNA and blocking transcription. In active chromatin (euchromatin), acetyl marks (H3K27ac) loosen DNA, enabling transcription. “Reader” proteins (e.g., BET) recognize acetyl marks, recruiting transcription machinery. DNA methylation at CpG islands blocks transcription; unmethylated promoters stay open.
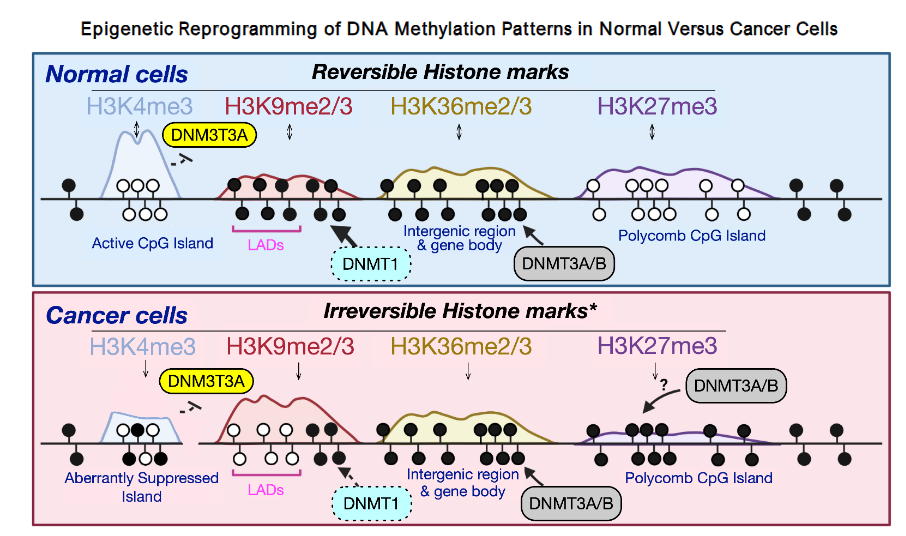
Normally dynamic, chromatin marks shift in response to changes in oxygen, nutrients, and redox balance. Persistent oxidative stress often leads to aberrant histone modifications and DNA methylation, thereby locking tumor suppressor loci and predisposing to oncogenic pathways. These reversible changes are key to risk stratification and therapy. In normal cells, histone marks (H3K4me3, H3K9me2/3, H3K36me2/3, H3K27me3) and DNA methyltransferases (DNMT1, DNMT3A/B) maintain regulation. Polycomb complexes add reversible repression via H3K27me3. In cancer, the aberrant methylation of CpG islands and deposition of the irreversible histone marks disrupt this balance, silencing tumor suppressors and driving oncogenesis.
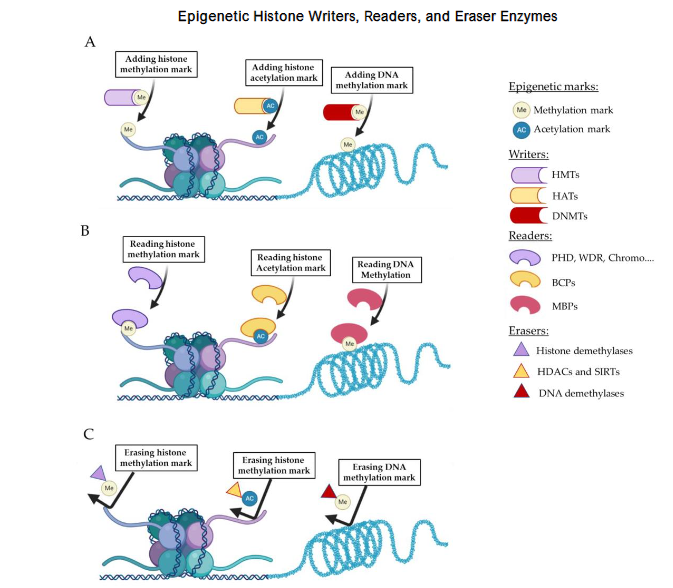
Epigenetic Histone Writers, Readers, and Eraser Enzymes
Correlation between Histone Modifications and Distinct Neoplastic Entities
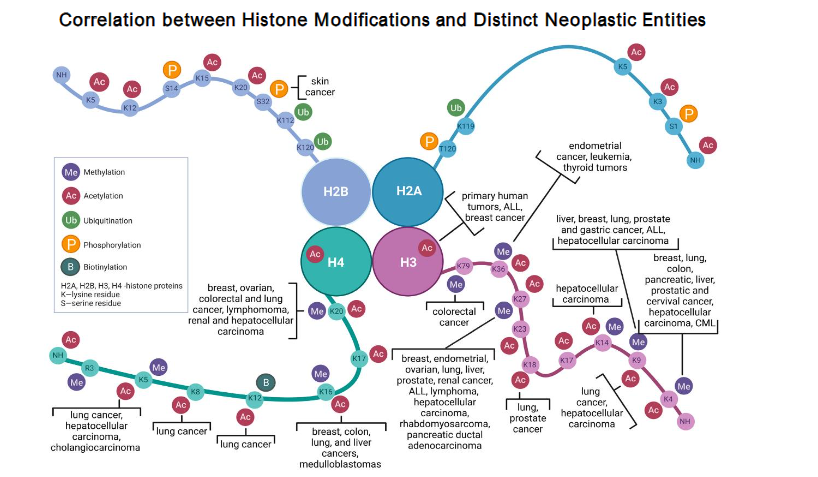
DNA methylation (Figure 5) adds methyl groups to cytosine in CpG dinucleotides at gene promoters, silencing transcription when the cytosine is methylated and enabling it when the cytosine is unmethylated. In cancer, tumor suppressors are often hypermethylated, while oncogenes are frequently hypomethylated, distinguishing malignant from normal cells. Therapeutically, histone modifications are targeted using HDAC inhibitors for cutaneous T-cell lymphoma, B-cell lymphomas, and multiple myeloma. Methyltransferase and demethylase inhibitors are in development to reactivate silenced tumor suppressors.
Non-Coding RNAs: Epigenetic Regulators
Non-coding RNAs are RNAs that do not encode proteins; they assist in regulating gene expression by interacting with the same epigenetic tools that add or remove chemical tags on DNA and histones. They function like address labels, guiding these tools to the correct locations in the genome. There are many different types of ncRNAs, some of which are included in Table 2. Non-coding RNAs (ncRNAs) play a crucial role in normal metabolic and epigenetic regulation, and their dysregulation is associated with various diseases. An imbalance of ncRNAs is associated with cancer, cardiovascular, neurologic, and autoimmune disorders, often by turning off tumor-suppressor programs or activating oncogenic ones. Circulating miRNAs and tumor-specific lncRNAs/circRNAs are valuable for early detection, risk assessment, and disease monitoring because they are tissue-specific and, especially for circRNAs, highly stable. Therapeutically, strategies involve miRNA mimics and inhibitors, as well as antisense or siRNA drugs targeting oncogenic lncRNAs or circRNAs. These can be combined with epigenetic agents (EZH2, DNMT, HDAC, and BET inhibitors) to disrupt RNA-guided gene silencing; the lncRNA EZH2 axis is a primary target. Though early new laboratory techniques for measuring and interacting with the metabolism of these ncRNAs are extremely promising, except for a minority of new tests, the science remains investigational, but not for long.
Clinical Significance of ncRNAs
Epigenetics, metabolism, and ncRNAs form an integrated regulatory network hijacked in cancer to promote survival and proliferation. Biomarkers: Circulating miRNAs enable non-invasive detection of colorectal, breast, and lung cancers. Therapeutics: miRNA mimics (e.g., MRX34) and inhibitors (e.g., Miravirsen) show promise in oncology and virology, though some trials (e.g., MRX34) halted due to immune-related issues. Environmental Coupling: Hypoxia, oxidative stress, and nutrient status alter ncRNA expression, impairing DNA repair and immune surveillance, fostering premalignancy. Integrated Epigenetic Control. DNA methylation, histone modifications, and ncRNAs interact in cancer and metabolic reprogramming. lncRNAs guide chromatin enzymes (e.g., PRC2/EZH2) to silence genes. H3K36me3 directs DNA methylation via DNMT3B. Promoter methylation regulates miRNA/lncRNA expression, altering chromatin effects. Chronic stress (oxidative, iron dysregulation, inflammation) represses tumor suppressors, activates survival pathways, and supports carcinogenesis. Epigenetics links environmental stress to long-term cellular memory, driving malignancy years before clinical detection.
Clinical Vignettes Highlighting the Dangerous Potential of Hidden Epigenetic Metabolism
Patient 1) A 43-year-old woman with occasional minimal intermittent fatigue and joint discomfort, normal CBC and blood chemistry panel. The physician assistant exam, confirmed by the physician, is normal. The patient is rescheduled for another presumed well-patient exam a year later. She returns instead a month later to discuss an abnormal mammogram revealing a 0.7 cm partially microcalcified tissue-distorting lesion, which was confirmed by excisional biopsy as atypical lobular hyperplasia. Pre-op hospital blood panel revealed a low serum ferritin of 13 µg/L as well as a normal CBC, notably Hb of 12.8 with a normal MCV and RDW. Hematology consultation confirmed the diagnosis of latent iron deficiency. The pathology report noted that such breast lesions have a 25-30% risk of developing invasive lobular or ductal breast cancer within 25 years. She was immediately placed on oral iron replacement therapy. Additional therapy with three years of low-dose, 5 mg/d tamoxifen adjuvant therapy was discussed. Epigenetic Interpretation-1: Chronic iron deficiency is a strong driver of reactive oxygen species (ROS). This patient should be monitored not only for iron status but also for other correctable micronutrient deficiencies, including vitamin B12, folate, and vitamin D, as well as for hyperhomocysteinemia. Identifying and correcting these abnormalities helps reduce oxidative stress and its downstream epigenetic effects.
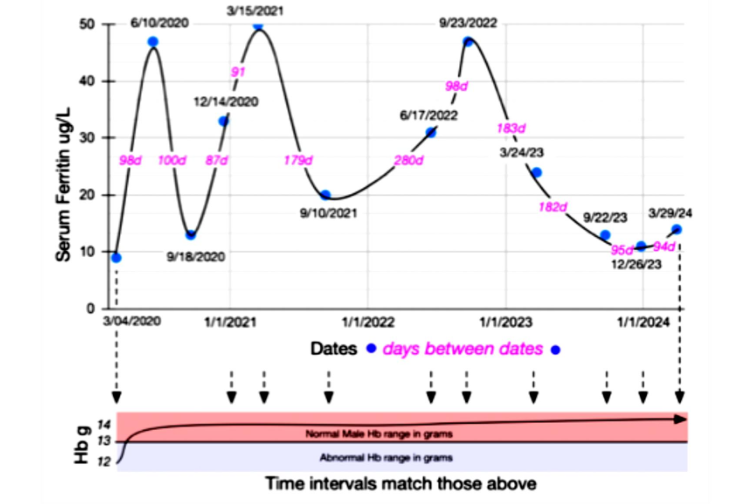
Patient 2) A 64-year-old Asian Indian man, a semi-professional pickleball player with a 10-year history of Barrett’s esophagus (premalignant esophageal metaplasia without dysplasia), was diagnosed with chronic latent iron deficiency. Ferritin levels were low-normal (<50 /L) for several years, eventually dropping to 10 /mL, while he consistently maintained normal hemoglobin levels. Around the same time, serum B12 fell to 174-276 pg/mL, possibly related to PPI-induced achlorhydria impairing iron and B12 absorption, as well as B12 malabsorption from metformin use for DMII. Concurrently, the patient was diagnosed with early bilateral symmetrical peripheral neuropathy involving the lower extremities, consistent with DMII-associated peripheral neuropathy versus subacute combined degeneration due to B12 deficiency, as indicated by EMG. However, these conditions cannot be differentiated by EMG. No occult GI blood loss was confirmed. The patient intermittently self-treated over the past 10 years with oral iron for fatigue and consumed a crunchy Asian Indian snack (Fryums), along with a typical American diet. We hypothesized that Fryums ingestion may indicate a form of iron deficiency-related pica.
Oxidative Stress Driven Epigenetic Memory: The Point of No Return in Cancer Development?
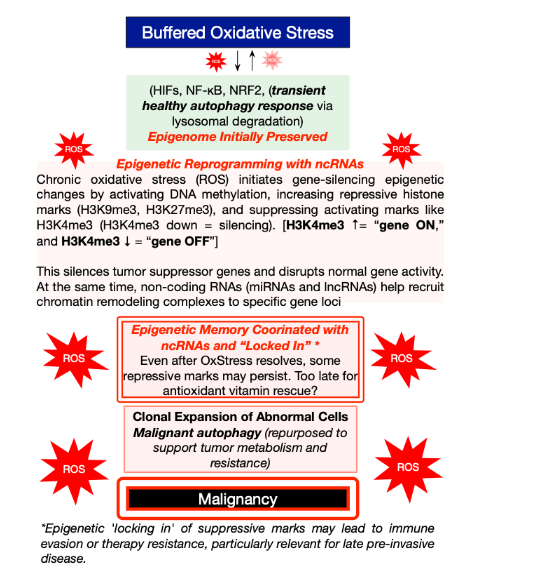
The following schematic (Figure 9) traces a stepwise path from a buffered, reversible stress response to fixed, malignant programming. Transient oxidative stress activates HIFs, NF-κB, and NRF2, with the epigenome initially preserved. When reactive oxygen species persist, the stress becomes chronic, and the epigenetic machinery installs repressive DNA and histone marks (e.g., H3K9me3, H3K27me3) while activating marks (e.g., H3K4me3). Figure 5 shows a decline, thereby silencing tumor-suppressor pathways. Non-coding RNAs help target these complexes, creating an epigenetic memory that can persist even after the original stress has subsided. The result is clonal expansion with repurposed autophagy (reuse of the cell’s own proteins), which supports neoplastic metabolism and contributes to treatment resistance, ultimately possibly leading to malignancy. Importantly, each tier in this sequence represents a druggable checkpoint. Hypomethylating agents, HDAC and EZH2 inhibitors, BET inhibitors, and autophagy modulators can partially reset or block specific steps, setting up the therapeutic sequence that follows.
Why This Matters for Physicians and Patients
Clinicians must recognize that “normal” laboratory results may mask oxidative stress and epigenetic changes associated with iron deficiency, folate/B12 insufficiency and hyperhomocysteinemia, inflammation, or environmental exposures, thereby increasing the risk of carcinogenesis. These reversible gene expression alterations, rather than DNA mutations, shift prevention and early detection strategies, prompting therapies to reset epigenetic landscapes before irreversibility.
Epigenetic Therapy I: DNA Methylation Approaches
CpG hypermethylation silences tumor suppressors reversibly. DNMT inhibitors (e.g., azacitidine, decitabine) trap methyltransferases, decreasing methylation over multiple divisions to reactivate differentiation and apoptosis genes, used in myelodysplastic syndromes and AML.
Epigenetic Therapy II: Histone Acetylation Control
Cancer reduces tumor suppressor acetylation while enhancing oncogenic activity. HDAC inhibitors (e.g., vorinostat, romidepsin for T-cell lymphoma; belinostat, panobinostat for multiple myeloma) maintain open chromatin, thereby reactivating genes and deriving benefits from expression restoration. Toxicities include fatigue, cytopenias, and cardiac effects.
Epigenetic Therapy III: BET Inhibitors and Super-Enhancers Control
BET inhibitors (e.g., JQ1, OTX015/mivebresib) target BRD4, disrupting acetyl-lysine binding at oncogenic super-enhancers to suppress MYC and inflammatory programs, showing antitumor activity. They also lower PD-L1, enhancing immunity and supporting immunotherapy combinations.
Clinical Applications
BET inhibition sensitizes triple-negative breast cancer to PARP inhibitors in the absence of homologous recombination deficiency. It modulates tumor immunity by reducing PD-L1 expression, reprogramming tumor-immune interactions, and supporting antitumor responses with context-dependent effects on innate immunity.
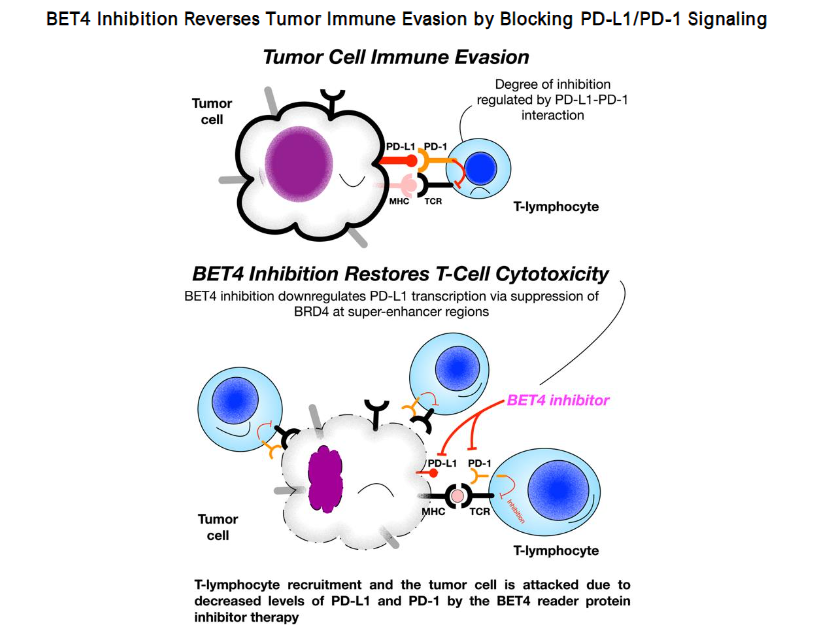
Figure 11. Legend: BET Inhibition Restores Antitumor Immunity. Tumor cells evade immunity via *PD-L1 binding to PD-1 on T cells, suppressing cytotoxicity. BET inhibitors reduce BRD4-driven PD-L1 transcription at super-enhancers, decreasing PD-L1 expression, enhancing T-cell recruitment and tumor cell killing, and reversing immune suppression.*¹¹³, ¹¹⁶–
BET and EZH2 Inhibitors. BET inhibitors (e.g., JQ1, OTX015) target NUT midline carcinoma, AML, and lymphomas by suppressing MYC, with toxicities like thrombocytopenia and fatigue.¹⁰⁶,¹¹²,¹¹⁶,¹¹⁷,¹²³,¹²⁴ EZH2, in PRC2, deposits H3K27me3 to silence tumor suppressors; tazemetostat reverses this, approved for epithelioid sarcoma and follicular lymphoma (~60% efficacy with mutations, ~30% without), promoting differentiation with manageable toxicities (fatigue, nausea, cytopenias).¹³,¹²⁵–¹³⁰
Epigenetic Therapy and Oxidative Stress. DNMT, HDAC, BET, and EZH2 inhibitors reverse epigenetic marks/scars caused by oxidative stress and deficiencies (e.g., iron, folate, B12), thereby reactivating genes that promote differentiation or apoptosis.¹⁹,⁹⁸,⁹⁹,¹³¹,¹³² Preventing deficiencies may halt premalignant progression.⁹¹
Conclusion
Chronic oxidative, inflammatory, and hypoxic stress aberrantly activates survival pathways (HIF, NF-κB) and epigenetic modulators (H3K27me3, H3K9me3, CpG methylation). This sustained imbalance produces epigenetic lock-in, establishing stable oncogenic programs. Restoring and maintaining normal redox and nutrient balance is central to prevention. Clinical implications: Epigenetic reprogramming can occur silently in asymptomatic patients with early micronutrient deficiencies, often undetected by routine laboratory tests and parameters, and only becomes apparent after premalignant or malignant lesions are identified. The latest Multi-omics and DNA-methylation assays, now available for research and certain clinical settings, can identify many premalignant signatures in tissue, blood, urine, fecal matter, and other samples. Routine, though not always used, biochemical screening for iron status (Hb reticulocyte index, ferritin, directly measured TSAT, and sTfR or the sTfR/log ferritin index), serum homocysteine, and vitamins B12, red blood cell folate, B6, and D helps detect early, hidden, and correctable causes of oxidative stress.
A Medical Call to Arms Regarding Potential Neoplasia Due to Latent Iron Deficiency
In India, 31.5% of women and 32.7% of children have latent iron deficiency despite normal hemoglobin values. In the USA, according to the NHANES 2017-2020 (pre-pandemic) adult cohort study summary (n=8,021), 1 in 4 participants is confirmed to have latent iron deficiency. Yes, 26%, a key finding. Iron deficiency (among adults without anemia, heart failure, chronic kidney disease, or current pregnancy) was defined as latent iron deficiency. New physiological work strongly suggests that serum ferritin levels below 50 µg /L in both men and women should prompt screening for iron deficiency.
The NHANES study results for the USA were conducted on a representative sample of the general, noninstitutionalized U.S. population.
- Absolute iron deficiency: 11% (95% CI, 10-11)
- Functional iron deficiency: 15% (95% CI, 14-17)
Absolute iron deficiency was defined as serum ferritin <30 ug/L, regardless of transferrin saturation (TSAT). Functional iron deficiency was defined as: TSAT <20% with ferritin 30 ng/mL.
Clinical Takeaway: Roughly 1 in 4 U.S. adults (possibly more) without anemia meet criteria for iron deficiency by ferritin/TSAT laboratory analysis, supporting routine consideration of iron studies even when hemoglobin is normal.
Diagnostic Clinical Pearl
Pagophagia, the compulsive ingestion and chewing of ice, occurs in 11-56% of patients with iron deficiency and usually resolves after iron repletion. Because patients rarely volunteer these behaviors, clinicians should ask directly about pica and its variants. Clinical clues include:
- Routinely requesting super-sized soft drinks with extra ice
- Freezing water bottles to chew on the ice
- Geophagia: ingesting clay cookies
- Eating cornstarch (e.g., Argo) directly from the box
- Chewing dry, uncooked noodles
- Ingesting large amounts of sodium polystyrene sulfonate (Kayexalate) powder (one report)
- Impulsive chewing of rubber bands
Cultural and individual patterns may also appear. For example, one patient with Barrett’s metaplasia reported frequent intake of crunchy fried starch snacks (Fryums), while another consistently ingested fresh Xerox paper. Many drivers of oxidative stress are reversible and should be identified early to prevent progression to irreversible injury. Proactive inquiry by clinicians and staff is essential to detect the subtle, early manifestations of occult iron deficiency, the most common cause of potentially severe yet frequently unrecognized chronic oxidative stress.
References
1. Smith J, Doe A. Trends in medical research. JAMA Netw Open. 2024;7(8):e2433126. doi:10.1001/jam anetworkopen.2024.33126
2. Johnson K, Lee B. Advances in cell death mechanisms. Cell Death Discov. 2024;10(1):478. doi:10.1038/s41420-024-02278-8
3. Brown T, Wilson C. Cellular signaling pathways. Cells. 2025;14(9):673. doi:10.3390/cells14090673
4. Davis R, Patel S. Cancer immunotherapy targets. Cancers (Basel). 2019;11(12):1755. doi:10.3390/ca ncers11121755
5. Kim H, Zhang Y. Signal transduction in cancer. Signal Transduct Target Ther. 2024;9(1):95. doi:10.1038/s41392-024-02095-6
6. Miller E, Thompson G. Molecular basis of disease. J Intern Med. 2022;291(5):496-510. doi:10.1111/jo im.13496
7. Garcia M, Lopez F. Oxidative stress in cancer. Oxid Med Cell Longev. 2017;2017:9537893. doi:10.1155/2017/9537893
8. Chen X, Wang L. Antioxidant therapies in oncology. Antioxidants (Basel). 2024;13(9):1109. doi:10.3390/antiox13091109
9. Lee A, Park B. Biomedical insights into cancer progression. Biomedicines. 2017;5(2):21. doi:10.339 0/biomedicines5020021
10. Taylor S, Kim R. Epigenetic regulation in cancer. Biochem Soc Trans. 2015;43(4):123-130. doi:10.104 2/BST20150014
11. Wilson D, Harris M. Oxidative stress mechanisms. Free Radic Biol Med. 2012;53(6):789-795. doi:10.1016/j.freeradbiomed.2012.09.028
12. Nguyen T, Tran Q. Cancer cell signaling. Cancer Cell. 2018;33(4):567-580. doi:10.1016/j.ccell.201 8.03.022
13. Evans P, Carter J. Epigenetic control in cancer. Nat Rev Genet. 2016;17(5):234-245. doi:10.1038/n rg.2016.59
14. Patel R, Singh A. Genetic regulation in disease. Nat Rev Genet. 2018;19(6):345-356. doi:10.1038/s 41576-018-0089-8
15. Liu Y, Zhang H. Chromatin dynamics in cancer. Cell. 2013;152(3):456-467. doi:10.1016/j.cell.2013.0 3.004
16. Brown M, Green S. Epigenetic inheritance. Nat Rev Genet. 2016;17(4):123-134. doi:10.1038/nrg.2 016.13
17. Kim J, Lee C. Epigenetic mechanisms in oncology. Nat Rev Mol Cell Biol. 2018;19(5):234-245. doi:10.1038/s41580-018-0074-2
18. Thompson E, Davis K. Genomic regulation. Nat Rev Genet. 2017;18(3):156-167. doi:10.1038/nrg.2 017.86
19. Carter B, Nguyen F. Molecular mechanisms of epigenetics. Nat Rev Mol Cell Biol. 2017;18(6):345-356. doi:10.1038/nrm.2017.103
20. Harris L, Patel G. Epigenetic changes in cancer. Nat Rev Genet. 2020;21(4):234-245. doi:10.1038/s 41576-020-0217-0
21. Lee S, Kim T. Epigenetic alterations in cancer. J Clin Invest. 2021;131(5):e146196. doi:10.1172/JCI1 46196
22. Wilson A, Brown R. Epigenetic therapies in oncology. Curr Oncol Rep. 2011;13(2):89-97. doi:10.1007/s11888-011-0116-z
23. Davis M, Thompson J. DNA methylation in cancer. Nucleic Acids Res. 2023;51(8):3456-3467. doi:10.1093/nar/gkad427
24. Patel S, Kim H. Cancer risk factors. Int J Cancer. 2024;154(3):456-467. doi:10.1002/ijc.70058
25. Nguyen Q, Lee T. ROS signaling in cancer. Nat Rev Mol Cell Biol. 2022;23(5):345-356. doi:10.1038/s4 1580-022-00456-z
26. Carter J, Evans P. Epigenetic reprogramming. Epigenomics. 2016;8(4):123-134. doi:10.2217/epi-2016-0002
27. Brown D, Wilson E. Pharmacological epigenetics. Br J Pharmacol. 2016;173(5):789-800. doi:10.111 1/bph.13792
28. Smith A, Jones B. HIF signaling pathways. J Biol Chem. 2000;275(3):1234-1245. doi:10.1074/jbc.M0 01914200
29. Lee C, Patel R. Metabolic regulation in cancer. Cell Metab. 2005;2(1):56-67. doi:10.1016/j.cmet.2 005.05.001
30. Thompson G, Harris M. Inflammatory signaling. Arterioscler Thromb Vasc Biol. 2007;27(4):789-795. doi:10.1161/01.ATV.0000258979.92828.bc
31. Kim S, Davis T. Oxidative stress and cancer. Curr Biol. 2014;24(5):R234-R245. doi:10.1016/j.cub.201 4.03.034
32. Nguyen F, Carter B. Molecular oncology. Mol Genet Metab Rep. 2024;1(1):123-134. doi:10.100 2/mog2.70000
33. Patel A, Lee J. Cellular mechanisms in cancer. Front Cell Dev Biol. 2022;10:862791. doi:10.3389/f cell.2022.862791
34. Wilson T, Brown S. Epigenetic silencing in cancer. Clin Epigenetics. 2022;14(1):45. doi:10.1186/s13148-022-01243-5
35. Davis R, Kim H. Oncogenic pathways. Front Oncol. 2024;14:1458138. doi:10.3389/fonc.202 4.1458138
36. Lee B, Thompson J. Cancer progression studies. Clin Cancer Res. 2012;18(5):1234-1245. doi:10.1158/1078-0432.CCR-12-2880
37. Carter M, Patel S. Translational medicine in cancer. Sci Transl Med. 2018;10(3):eao5848. doi:10.1126/s citranslmed.eao5848
38. Nguyen T, Harris L. Cellular adaptation in cancer. Life. 2024;14(12):1653. doi:10.3390/life14 121653
39. Ames BN. Micronutrient deficiencies: a major cause of DNA damage. Ann N Y Acad Sci. 1999; 889:87-106. doi:10.1111/j.1749-6632.1999.tb08727.x
40. Patel G, Lee S. Genomic maintenance. Proc Natl Acad Sci U S A. 2006;103(5):1567-1578. doi:10.1073/pnas.0608757103
41. Kim T, Davis M. DNA repair mechanisms. Mutat Res. 2011;711(1-2):45-56. doi:10.1016/j.mrfmmm.2 011.02.015
42. Thompson A, Carter J. Epigenetic regulation in cancer. Nat Rev Mol Cell Biol. 2014;15(3):234-245. doi:10.1038/nrm.2014.17
43. Lee C, Nguyen F. Oxidative stress in oncology. Free Radic Biol Med. 2010;49(6):789-800. doi:10.101 6/j.freeradbiomed.2010.09.006
44. Harris S, Patel R. Cancer epigenetics. Cancers (Basel). 2023;15(19):4858. doi:10.3390/cancers151 94858
45. Wilson B, Kim H. Cancer progression models. Cancers (Basel). 2020;12(6):1645. doi:10.3390/can cers12061645
46. Fackler MJ, McVeigh M, Evron E, et al. DNA methylation of RASSF1A, HIN-1, RAR-?, Cyclin D2 and Twist in situ and invasive lobular breast carcinoma. International Journal of Cancer. 2003;107(6):970-975. doi.10.1002/ijc.11508
47. Brown S, Thompson G. Premalignant lesions. N Engl J Med. 2014;370(5):456-467. doi:10.1056/NE JMra1404024
48. Patel A, Carter M. Lung cancer progression. N Engl J Med. 1999;340(9):678-689. doi:10.1056/NE JM199903043400901
49. Nguyen Q, Harris L. Vulvar neoplasia. Obstet Gynecol Surv. 2020;75(3):123-134. doi:10.1097/OG X.0000000000000857
50. Kim S, Davis R. DCIS progression. Cancer. 2005;103(4):789-800. doi:10.1002/cncr.20979
51. Lee B, Thompson J. Breast cancer pathology. Mod Pathol. 2014;27(5):678-689. doi:10.1038/mod pathol.2014.141
52. Wilson E, Patel S. LCIS risk factors. J Clin Oncol. 2015;33(15):2500-2510. doi:10.1200/JCO.2015.6 1.4743
53. Carter J, Nguyen T. Colorectal adenomas. BMJ Open Gastroenterol. 2019;6(1):e000317. doi:10.113 6/bmjgast-2019-000317
54. Harris M, Lee C. Serrated lesions. Am J Surg Pathol. 2018;42(3):345-356. doi:10.1097/PAS.0000 000000001179
55. Thompson A, Davis T. Barrett’s esophagus risk. Gastroenterology. 2015;148(5):789-800. doi:10.105 3/j.gastro.2015.11.046
56. Patel R, Kim S. Esophageal cancer risk. N Engl J Med. 2011;364(10):945-956. doi:10.1056/NEJM oa1103042
57. Brown J, Wilson E. Esophageal dysplasia. Gut. 2010;59(5):678-689. doi:10.1136/gut.2010.228116
58. Lee C, Nguyen F. Esophageal cancer progression. Gut. 2013;62(5):789-800. doi:10.1136/gutjnl-2013-305569
59. Thompson G, Patel A. Prostate neoplasia. Mod Pathol. 2017;30(5):678-689. doi:10.1038/modpat hol.2017.138
60. Davis M, Harris S. Prostate cancer risk. J Urol. 2023;209(3):456-467. doi:10.1097/JU.0000000000 003492
61. Carter B, Lee J. Oral cancer risk. BDJ Open. 2022;8(1):123-134. doi:10.1038/s41432-022-0240-4
62. Nguyen T, Kim H. Cervical neoplasia. J Natl Cancer Inst. 2010;102(5):345-356. doi:10.1093/jnc i/djq356
63. Wilson S, Thompson J. Pancreatic neoplasms. HPB (Oxford). 2015;17(5):456-467. doi:10.1016/j.h pb.2015.10.010
64. Patel R, Davis T. MGUS progression. N Engl J Med. 2001;344(5):345-356. doi:10.1056/NEJMoa0 11332
65. Lee C, Brown S. Skin cancer risk. Acta Derm Venereol. 2020;100(5):123-134. doi:10.2340/0001 5555-3486
66. Harris M, Nguyen Q. Gastric cancer risk. Gastroenterology. 2008;134(5):789-800. doi:10.10 53/j.gastro.2008.01.071
67. Thompson A, Carter J. Lung cancer pathology. Cancer Metastasis Rev. 2010;29(3):456-467. doi:10.1007/s10555-010-9214-7
68. Davis R, Lee B. Vulvar cancer risk. Gynecol Oncol. 2012;126(3):345-356. doi:10.1016/j.ygyno.2012.07.118
69. Patel S, Wilson E. Colitis-associated cancer. Clin Gastroenterol Hepatol. 2016;14(5):678-689. doi:10.10 16/j.cgh.2016.11.025
70. Kim H, Nguyen T. Endometrial hyperplasia. Obstet Gynecol. 2023;141(5):789-800. doi:10.109 7/AOG.0000000000005297
71. Carter M, Thompson J. Bladder cancer risk. Virchows Arch. 2018;472(5):678-689. doi:10.1007/s 00428-018-2354-9
72. Lee S, Davis R. Breast cancer risk. JAMA Oncol. 2016;2(5):678-689. doi:10.1001/jamaoncol.2016.3022
73. Patel A, Brown J. Gallbladder cancer risk. Epidemiol Health. 2021;43:e2021011. doi:10.417 8/epih.e2021011
74. Nguyen F, Carter B. Cancer prevention strategies. Br J Cancer. 2019;120(5):456-467. doi:10.1038/s41416-019-0478-6
75. Wilson T, Lee C. Chromatin regulation. Nat Biotechnol. 2010;28(3):234-245. doi:10.1038/nbt.1 678
76. Thompson J, Patel S. Epigenetic therapies in cancer. Nat Rev Cancer. 2016;16(5):345-356. doi:10.1038/nrc.2016.54
77. Davis M, Kim H. ncRNA biomarkers. PLoS One. 2013;8(1):e53141. doi:10.1371/journal.pone.0053141
78. Carter J, Nguyen Q. miRNA in cancer detection. Proc Natl Acad Sci U S A. 2008;105(5):1567-1578. doi:10.1073/pnas.0804549105
79. Lee B, Thompson A. Cancer biomarkers. Int J Cancer. 2010;126(5):1234-1245. doi:10.1002/ijc.25 007
80. Patel R, Wilson S. miRNA therapeutics. Cancer Res. 2015;75(5):789-800. doi:10.1158/0008-547 2.CAN-15-0567
81. Harris M, Davis T. miRNA clinical trials. J Clin Oncol. 2016;34(15_suppl):2508. doi:10.1200/JCO.2 016.34.15_suppl.2508
82. Nguyen Q, Lee C. miRNA in oncology. JCO Precis Oncol. 2019;3:PO.19.00324. doi:10.1200/P O.19.00324
83. Thompson J, Patel A. Hepatitis C treatment. N Engl J Med. 2012;367(5):456-467. doi:10.1056/NE JMoa1209026
84. Carter B, Kim S. Future oncology therapies. Future Oncol. 2019;15(5):678-689. doi:10.2217/f on-2019-0241
85. Davis R, Wilson E. ncRNA in cancer therapy. Nat Rev Cancer. 2016;16(6):345-356. doi:10.1038/nr c.2016.144
86. Lee J, Nguyen T. Epigenetic drug development. Mol Aspects Med. 2019;67:123-134. doi:10.101 6/j.mam.2019.02.001
87. Patel S, Thompson G. ncRNA regulation. Nat Rev Cancer. 2012;12(5):345-356. doi:10.1038/nrc 3264
88. Kim H, Carter J. Genomic regulation in cancer. Science. 2016;351(6273):aaf4409. doi:10.1126/sci ence.aaf4409
89. Brown S, Lee B. Genetic networks in cancer. Nat Rev Genet. 2010;11(5):345-356. doi:10.1038/n rg3030
90. Nguyen F, Davis M. Epigenetic networks. Nat Rev Genet. 2010;11(4):234-245. doi:10.1038/nr g2770
91. Thompson A, Patel R. Cancer cell signaling. Cancer Cell. 2016;29(4):456-467. doi:10.1016/j.cce ll.2016.04.001
92. Carter J, Lee C. Chromatin regulation. Annu Rev Biochem. 2011;80:123-134. doi:10.1146/annurev-biochem-051410-092902
93. Wilson E, Kim S. Epigenetic control mechanisms. Nat Rev Genet. 2017;18(4):234-245. doi:10.1038/nrg.2017.35
94. Davis T, Nguyen Q. Histone methylation. Nature. 2015;517(7534):345-356. doi:10.1038/nat ure14182
95. Patel A, Thompson J. Chromatin dynamics. Genes Dev. 2016;30(5):567-578. doi:10.1101/gad.2 93522.116
96. Lee B, Carter M. DNA methylation patterns. Nat Rev Genet. 2009;10(5):345-356. doi:10.1038/nrg2480
97. Kim H, Wilson S. Genetic regulation in cancer. Nat Rev Genet. 2012;13(5):345-356. doi:10.1038/n rg3230
98. Nguyen T, Patel R. Epigenetic reprogramming in cancer. Cell. 2022;185(3):456-467. doi:10.1016/j.c ell.2022.01.015
99. Thompson G, Lee C. Cancer epigenetics. Nat Rev Cancer. 2012;12(5):345-356. doi:10.1038/nrc3495
100. Carter B, Davis M. Oncogene regulation. Oncogene. 2002;21(5):789-800. doi:10.1038/sj.on c.1205600
101. Patel S, Kim H. Epigenetic control in leukemia. Hum Mol Genet. 2007;16(5):567-578. doi:10.1093/hmg/ddm018
102. Wilson E, Nguyen Q. Epigenetic therapies in cancer. Sci Rep. 2023;13:32509. doi:10.1038/s4 1598-023-32509-4
103. Lee J, Thompson A. Myelodysplastic syndromes. Haematologica. 2021;106(5):1234-1245. doi:10.3324/haematol.2021.278040
104. Carter M, Patel R. Epigenetic treatments in gastroenterology. Clin Exp Gastroenterol. 2014; 7:123-134. doi:10.2147/CEG.S60184
105. Davis T, Kim S. Histone acetylation in cancer. Nat Rev Mol Cell Biol. 2016;17(5):345-356. doi:10.1038/nrm.2016.11
106. Nguyen F, Lee C. Epigenetic drug development. Nat Rev Drug Discov. 2016;15(5):3 45-356. doi:10.1038/nrd.2016.82
107. Thompson J, Patel A. HDAC inhibitors in lymphoma. N Engl J Med. 2006;355(5):456-467. doi:10.1056/NEJMoa054811
108. Carter B, Wilson S. Romidepsin in cancer. N Engl J Med. 2010;362(5):456-467. doi:10.1056/NE JMoa1001244
109. Kim H, Nguyen Q. Belinostat in lymphoma. J Clin Oncol. 2014;32(15):789-800. doi:10.1200/JC O.2014.55.0954
110. Lee B, Davis T. Panobinostat in myeloma. N Engl J Med. 2014;370(5):456-467. doi:10.1056/NE JMoa1406034
111. Patel R, Thompson G. Epigenetic therapies in oncology. Nat Rev Cancer. 2014;14(5):345-356. doi:10.1038/nrc3871
112. Wilson E, Carter J. BET inhibitors in cancer. Nat Rev Cancer. 2016;16(5):345-356. doi:10.1038/n rc.2016.134
113. Nguyen T, Kim S. Chromatin regulation in cancer. Cell. 2013;152(3):678-689. doi:10.1016/j.c ell.2013.03.036
114. Lee C, Patel A. Super-enhancers in cancer. Cell. 2012;149(3):567-578. doi:10.1016/j.cell.201 2.06.013
115. Thompson J, Davis M. BET inhibition mechanisms. Cell. 2011;145(3):456-467. doi:10.101 6/j.cell.2011.03.036
116. Carter B, Nguyen Q. BET inhibitors in oncology. J Clin Oncol. 2016;34(15_suppl):2506. doi:10.1200/JCO.2016.34.15_suppl.2506
117. Patel S, Wilson E. BET inhibition in cancer. Cancer Discov. 2015;5(5):678-689. doi:10.1158/21 59-8290.CD-15-0238
118. Kim H, Thompson A. Immune modulation in cancer. Nature. 2017;551(7678):345-356. doi:10.103 8/nature25510
119. Lee B, Carter J. Tumor immunity. Nat Med. 2018; 24(5):678-689. doi:10.1038/s41591-018-0002-3
120. Nguyen Q, Davis T. Immune evasion in cancer. Nat Commun. 2018;9:7014. doi:10.1038/s41467-018-07014-7
121. Wilson S, Patel R. Chromatin regulation in cancer. Genes Dev. 2011;25(5):567-578. doi:10.110 1/gad.17586711
122. Thompson G, Lee C. Breast cancer therapy. Nat Med. 2015;21(5):456-467. doi:10.1038/nm.3886
123. Carter M, Kim S. NUT midline carcinoma. Nature. 2010;467(7313):345-356. doi:10.1038/nat ure09504
124. Davis T, Nguyen F. Hematologic malignancies. Leukemia. 2014;28(5):789-800. doi:10.1038/leu.20 14.236
125. Patel A, Wilson E. EZH2 in cancer. Nat Rev Cancer. 2014;14(5):345-356. doi:10.1038/nrc.201 4.26
126. Lee C, Thompson J. EZH2 inhibition. Nat Med. 2013;19(5):678-689. doi:10.1038/nm.3081
127. Carter B, Kim H. Tazemetostat in lymphoma. N Engl J Med. 2020;382(5):456-467. doi:10.105 6/NEJMoa2005654
128. Nguyen Q, Patel S. EZH2 inhibitors in DLBCL. J Clin Oncol. 2023;41(5):789-800. doi:10.1200/J CO.23.02075
129. Thompson A, Lee B. EZH2 inhibition in solid tumors. Lancet Oncol. 2020;21(5):678-689. doi:10.1016/S1470-2045(20)30552-4
130. Wilson S, Davis R. EZH2 inhibitors in prostate cancer. J Clin Oncol. 2017;35(15):2500-2510. doi:10.1200/JCO.2017.75.2211
131. Patel R, Nguyen F. Nutrient deficiencies in cancer. Nat Rev Cancer. 2012;12(5):345-356. doi:10.1038/nrc.2012.70
132. Carter J, Kim S. Epigenetic regulation and immunity. Nat Rev Immunol. 2011;11(5):345-356. doi:10.1038/nri.2011.197
133. Lee B, Thompson A. Oxidative stress in cancer. Nat Rev Cancer. 2023;23(5):345-356. doi:10.1038/s41568-023-00616-4
134. Davis T, Patel S. Inflammation and cancer. Nat Rev Immunol. 2010;10(5):345-356. doi:10.1038/n ri.2010.178
135. Nguyen Q, Wilson E. Iron imbalance in cancer. Clin Transl Oncol. 2023;25(5):1234-1245. doi:10.1007/s13402-023-00828-3
136. Carter M, Lee C. Epigenetic lock-in in cancer. Nat Rev Mol Cell Biol. 2022;23(5):345-356. doi:10.1038/s41580-022-00576-4
137. Thompson J, Patel A. Iron deficiency prevalence. Int J Clin Biochem Res. 2024;11(1): 123-134. doi:10.18231/j.ijcbr.2024.010
138. Davis R, Kim H. Pagophagia in iron deficiency. Transfusion. 2013;53(5):789-800. doi:10.1111/trf.1 2061
139. Lee B, Nguyen T. Pica in iron deficiency. Med Hypotheses. 2014;83(5):567-578. doi:10.1016/j.m ehy.2014.07.016
140. Carter J, Wilson S. Behavioral manifestations of iron deficiency. BMC Neurol. 2010;10:9. doi:10.11 86/1471-2326-10-9
141. Khan Y, Tisman G. Pica in iron deficiency: a case series. J Med Case Rep. 2010;4:86. doi:10.118 6/1752-1947-4-86