





Gait Kinematics in Rett Syndrome: Age-Related Insights
Gait Kinematics and Interlimb Symmetry in Individuals with Rett Syndrome Across Age Groups
Dacia Martinez Diaz1,2*, Bernhard Suter, MD3,4, Charles S Layne, PhD1,2
- Department of Health and Human Performance, University of Houston, Houston, TX, USA.
- Center for Neuromotor and Biomechanics Research, University of Houston, Houston, TX, USA.
- Blue Bird Circle Rett Center, Texas Children’s Hospital, Houston, TX, USA.
- Baylor College of Medicine, Houston, TX, USA
OPEN ACCESS
PUBLISHED: 30 April 2026
CITATION: Martinez Diaz, D., Suter, B., Layne, CS., 2026. Gait Kinematics and Interlimb Symmetry in Individuals with Rett Syndrome Across Age Groups. Medical Research Archives, [online] 14(4).
COPYRIGHT: © 2026 European Society of Medicine. This is an open-access article distributed under the terms of the Creative Commons Attribution License, which permits unrestricted use, distribution, and reproduction in any medium, provided the original author and source are credited.
ISSN 2375-1924
Abstract
Individuals with Rett syndrome, a rare neurodevelopmental disorder, face significant deficits in bipedal postural control and walking ability. The present cross-sectional study examines whether specific gait parameters exhibit stable or varying patterns with advancing age. Twenty-nine females diagnosed with Rett syndrome participated in this study. For analysis, participants were separated into three age groups 2–7-year-olds (n=9), 8-15 year olds (n=9) and 16 years and older (n=11). Participants walked on a treadmill while bilateral sagittal plane flexion angles of the hip, knee, and ankle were captured using a 16-camera motion capture system. Joint angles were processed to calculate joint range of motion, peak angular velocity, angle-angle diagrams, phase portrait areas and interlimb asymmetries. For each variable and age group, grand means and standard deviations were computed. Given the limited sample size per group, a permutation-based one-way analysis of variance was used for each variable, joint and side (greater/lesser) separately with Holm–Bonferroni adjusted pairwise comparisons. No statistically significant differences for any joint and limb were found between groups in range of motion, peak angular velocity, phase portrait areas and angle-angle diagrams areas. Waveform-based symmetry indexes revealed that symmetry of the Hip and Knee remained constant across the three age groups. Permutation-based pairwise comparisons indicated a significant difference in ankle symmetry index between the 2–7 and >16 age groups (p = 0.01), with younger participants showing higher asymmetry. Although the current sample size is relatively small, this is the first study to use technology-based gait measurements of individuals with Rett syndrome with such a large overall sample. Our database allowed us to explore whether there were systematic changes in gait related to age. Consistent with previous reports of gait kinematics in individuals with Rett syndrome, inter-subject variability was quite large across the various measures and age groups. This reinforces the idea that there is not a stereotypical kinematic gait pattern exhibited by those with Rett syndrome. It is suggested that future work explore within subject analyses that may provide more insightful information to clinicians and rehabilitation specialists regarding changes in response to interventions designed to improve gait control.
Keywords
Rett syndrome, gait kinematics, interlimb symmetry, age groups, neurodevelopmental disorder
Introduction
Rett syndrome (RTT) is a rare neurodevelopmental disorder caused by pathogenic variants in the methyl-CpG-binding protein 2 (MECP2) gene. It primarily affects females, with a pooled prevalence estimate of 7.1 per 100,000 females. Individuals with RTT generally follow an apparently neurotypical development until around 6 to 18 months of age, when their neurotypical development is interrupted by a regression phase characterized by the deterioration of previously acquired motor skills, expressive language abilities, and social interaction capabilities. After this period of decline, development enters a plateau phase in which the loss of function stabilizes; however, enduring deficits remain, particularly in motor coordination, gait function, communicative capacity, and overall quality of life.
Rett syndrome is characterized by a spectrum of disabling symptoms, gastrointestinal dysfunction, seizures, muscle tone abnormalities, apraxia and ataxia, scoliosis, autonomic dysfunction and breathing irregularities, which coupled with the deterioration of language and communication abilities, present significant challenges to affected individuals and their caregivers.
Since gross motor skills are significantly impaired, RTT individuals present notable deficits in bipedal postural control and walking ability. Some gait behaviors exhibited by females with RTT previously reported include ataxia, toe walking, midline stereotyped hand movements during ambulation, stiff-legged gait, freezing of gait, dysrhythmic walking patterns, and lateral and retrograde stepping. Despite an initial period of stabilization, walking capacity deteriorates with age, ultimately leaving less than half of individuals with RTT able to walk and many of these requiring assistance. These mobility limitations likely contribute to reduced physical fitness and overall health status in RTT patients.
Gait quality can be a reliable marker of overall health in neurotypical individuals and is strongly associated with the severity of neurodevelopmental disorders. It has been demonstrated that improving walking ability in RTT confers multiple benefits including reduced spasticity, prevention of foot deformities, and fostering a degree of personal autonomy. Additionally promoting an active lifestyle, including participation in walking programs, enhances quality of life and brings health advantages in RTT individuals.
Previous research has employed video analysis techniques to identify walking-associated behaviors in RTT individuals during overground and treadmill locomotion, as well as motor activities achievable within natural environmental context. Despite these studies, research employing technology-based techniques to provide quantitative outcome measures of gait in RTT is limited.
Given the recent emergence of a first pharmacological treatment for Rett, as well as the ongoing development of gene-based therapy trials aiming to improve the functional behavior in individuals with RTT, there is a clinical need for standardized, quantitative clinical outcome measures, applicable across research and clinical sites, to evaluate the efficacy of these new interventions for improving gait. Establishing comprehensive datasets that capture technology-based gait parameters in individuals with RTT represents a key milestone toward characterizing their gait. These data can serve as valuable benchmarks for clinicians and therapists, enabling objective evaluation of intervention efficacy across diverse research settings.
One-dimensional kinematic metrics have been employed in previous studies to characterize RTT gait, encompassing temporal parameters during both overground and treadmill walking, alongside assessments of knee and hip range of motions, angular velocities, limb asymmetries, and their associated variabilities. A previous study characterized walking behavior in individuals with RTT by using technology-based linear and non-linear (angle-angle diagrams and phase portraits) metrics and explored potential differences when compared to aged-matched neurotypical individuals. While the data presented in the study was categorized into 3 distinct age groups, no comparison between them was presented.
The present study seeks to investigate potential age-related differences in gait kinematics among individuals with RTT. Specifically, it aims to examine whether specific gait parameters exhibit patterns of deterioration or stabilization with advancing age.
Methods
Participants
Twenty-nine females presenting pathogenic variants in the MECP2 gene and diagnosed with Rett syndrome (RTT), as per the criteria established by Neul et al., participated in this study. Their ages ranged from 2 to 32 years, with a mean age of 13.17 years and a standard deviation of 8.1 years. These individuals were under treatment at the Blue Bird Circle Rett Center at Texas Children’s Hospital in Houston, TX. All participants were capable of independent ambulation without orthotic devices and were not taking medications known to influence motor control. Ethical approval for the study was obtained from the Institutional Review Boards of Baylor College of Medicine (H-35835) and the University of Houston (MODCR00000214), and informed consent in written form was provided by the parents of the participants. For analysis, participants were separated into three age groups: 2-7 year olds (n=9), 8-15 year olds (n=9), and 16 years and older (n=11).
Study Protocol
Prior to data collection, reflective markers were bilaterally placed on anatomical landmarks including the anterior and posterior superior iliac spines, lateral thighs, lateral femoral condyles, lateral malleoli, lateral shanks, first metatarsophalangeal joints, and heels. This configuration enabled the capture of bilateral sagittal plane kinematic of the hip, knee, and ankle joints. Participants were then positioned on a motorized treadmill (Bertec®) and secured in an overhead safety harness that prevented falls while allowing unrestricted movement during ambulation.
To determine each participant’s comfortable walking speed, the treadmill walking was initiated at 0.1 m/s and gradually increased by 0.1 m/s until participants exhibited signs of discomfort (e.g., facial expressions, hand movements, vocalizations) or caregivers indicated a speed reduction was needed. The speed was then decreased by 0.2 m/s and defined as the participant’s comfortable walking speed. After a brief rest period, participants walked at their comfortable speed for 1 to 3 min, depending on every subject’s capability and willingness to walk. Kinematic data were captured during this walking trial using a 16-camera VICON® motion capture system at a sampling rate of 100 Hz. Data was then processed and exported with the Nexus software using the plug-in gait model to obtain lower limb joint angles. Detailed procedures are described in Layne et al.
Data Processing and Analysis
Bilateral sagittal plane flexion angles of the hip, knee, and ankle were extracted and low-pass filtered using a second-order Butterworth filter with a 6 Hz cutoff. Joint angle time series were then precisely segmented at the peak knee flexion point, which was used as a consistent stride reference due to the frequent absence of heel strikes associated with toe walking. Each identified gait cycle was then time-normalized to 100 samples to standardize stride duration across participants and enhance comparability. Mean joint angle waveforms were then computed for each limb and joint per individual and mean-centered by subtracting each individual waveform’s mean value from each sample in the waveform. This served to reduce the inter-subject variability between waveforms. All processing and analyses described in this section were conducted using custom MATLAB scripts.
Linear Measures
Joint range of motion (ROM) was calculated as the difference in degrees between the minimum and maximum angles observed throughout the gait cycle, providing a quantitative measure of joint mobility for comparative analysis across age groups. Peak angular velocity was computed from the mean waveforms for each side and joint per participant. The limb exhibiting the greater knee ROM was labeled the “greater” side, with the opposite limb designated as the “lesser” side. For subsequent analyses, data were classified according to this designation, allowing comparisons between the side with the greater knee range of motion and the side with the lesser knee range of motion. This approach enabled a more detailed examination of asymmetries and their potential impact on gait dynamics.
Non-Linear Measures
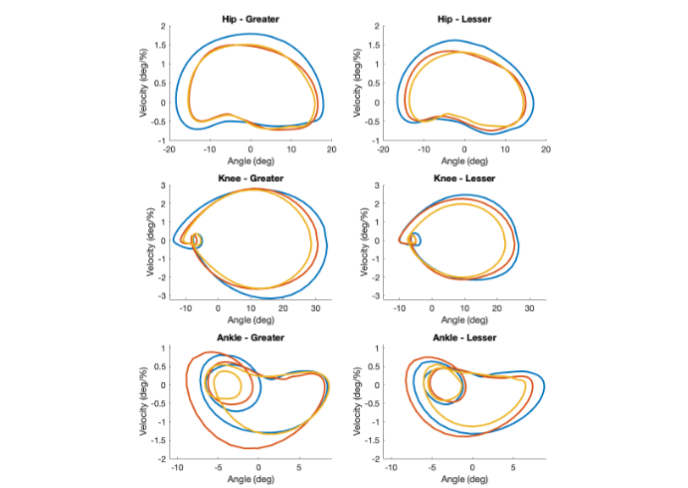
Angle-angle diagrams, as described by Goswami, were generated for each participant using their mean joint angle waveforms to visualize hip-knee and knee-angle flexion angles relationships across the gait cycle. The enclosed area of each loop was subsequently calculated to quantify inter-joint coordination patterns. Phase portraits, as described by Hurmuzlu, were generated for each joint to illustrate the relationship between angular velocity and angular position for every participant. These portraits provided insight into joint-specific dynamic control during gait. The area enclosed by each phase portrait loop was calculated to quantify dynamic joint behavior across the gait cycle. Both angle-angle and phase portrait loop areas and perimeters were computed using custom MATLAB scripts.
Symmetry Index
Symmetry indexes (SI) were computed for each outcome measure per participant to quantify asymmetries between the greater XG side and lesser side XL using the following formula.
SI = |XG−XL| / (0.5⋅(XG+XL)) ⋅ 100%
An SI value of 0 indicates perfect symmetry between both limbs.
Overall Symmetry Index: To assess waveform symmetry between limbs for each joint, an Overall Symmetry Index (OSI) was computed using the method proposed by Nigg et al.
OSI = ∫ A|xg(t) − xl(t)|dt / 100
A = 2 / (range(xg(t)) + range(xl(t)))
where OSI is the Overall Symmetry Index, xg(t) is the value of the joint angle recorded for the greater leg at the time t and xl(t) the joint angle recorded for the lesser leg at the time t. The integrand of the equation captures the time-dependent variation in symmetry across the 100 time-normalized points of the gait cycle. The closer the SI value is to zero, the more symmetric the gait. The range, rather than the mean, is used to normalize the symmetry index, as it is independent of the reference joint position.
Statistical Analysis
Mean waveforms and their 95% confidence intervals were calculated for each age group. For each variable and age group, grand means and standard deviations were computed. Given the limited sample size per group, which constrained the use of traditional statistical tests, we used a permutation-based one-way ANOVA for each variable, joint and side (greater/lesser) separately. For each analysis, all observations within the relevant subset were pooled, and group labels were randomly permuted 10,000 times to generate a null distribution of F-statistics. The observed F-value was then compared against this null distribution to obtain a permutation p-value, providing a non-parametric test of group differences without assuming normality or equal variances. When the omnibus permutation test indicated a potential group effect, we conducted permutation-based pairwise comparisons between age groups. Pairwise tests were also performed using 10,000 label permutations and were based on the difference in group means as the test statistic. Multiple comparisons were controlled using the Holm–Bonferroni method applied separately for each variable and side. This approach provides a robust, distribution-free assessment of age-related differences across all gait variables.
Results
The data from 29 females diagnosed with Rett syndrome (RTT) were analyzed. The mean ages for each group were 5.0 years (SD = 1.7) in the 2–7-years old group, 11.0 years (SD = 2.3) in the 8-15 age group and 21.6 years (SD = 5.6) in the >=16 age group. Participants in the >=16 age group had a mean walking speed of 0.6 m/s (SD = 0.1), while the other two groups walked at a mean speed of 0.5 m/s (SD = 0.1).
Range of Motion
Mean joint range of motion (ROM) values for the hip, knee, and ankle are presented in Table 1, along with the symmetry index values and permutation-based ANOVA results. No statistically significant differences were found between groups.
| Hip ROM [degrees] | Knee ROM [degrees] | Ankle ROM [degrees] | ||||||||
|---|---|---|---|---|---|---|---|---|---|---|
| Side | Age Group | Mean (SD) | F | p | Mean (SD) | F | p | Mean (SD) | F | p |
| Greater | 2-7 | 37.1 (7.7) | 1.18 | 0.33 | 48.6 (6.3) | 1.54 | 0.23 | 22.3 (6.4) | 0.81 | 0.46 |
| 8-15 | 32.7 (4.9) | 43.6 (9.6) | 20.7 (11.1) | |||||||
| >=16 | 33.2 (7.1) | 42.2 (8.7) | 17.8 (5.9) | |||||||
| Lesser | 2-7 | 35.3 (5.8) | 1.07 | 0.36 | 37.5 (5.9) | 0.60 | 0.56 | 22.7 (9.9) | 0.72 | 0.49 |
| 8-15 | 31.0 (9.5) | 36.4 (10.5) | 19.1 (9.0) | |||||||
| >=16 | 31.1 (6.0) | 32.9 (11.5) | 18.2 (7.0) |
Hip ROM Symmetry Index Knee ROM Symmetry Index Ankle ROM Symmetry Index
| Age Group | Mean (SD) | F | p | Mean (SD) | F | p | Mean (SD) | F | p |
|---|---|---|---|---|---|---|---|---|---|
| 2-7 | 11.5 (6.5) | 0.71 | 0.52 | 26.0 (14.7) | 0.53 | 0.63 | 35.7 (38.0) | 1.11 | 0.35 |
| 8-15 | 17.0 (13.1) | 19.0 (17.3) | 18.4 (10.0) | ||||||
| >=16 | 15.8 (10.4) | 28.3 (26.4) | 38.6 (37.4) |
Peak Angular Velocity
Peak Angular Velocity values are presented in Table 2, along with their symmetry index values. Permutation-based one-way ANOVA revealed no statistically significant differences between groups for any joint and limb.
| Hip Peak Vel. [degrees / %of gait cycle] | Knee Peak Vel. [degrees / %of gait cycle] | Ankle Peak Vel. [degrees / %of gait cycle] | ||||||||
|---|---|---|---|---|---|---|---|---|---|---|
| Side | Age Group | Mean (SD) | F | p | Mean (SD) | F | p | Mean (SD) | F | p |
| Greater | 2-7 | 1.90 (0.47) | 1.28 | 0.30 | 2.84 (0.26) | 0.00 | 1.00 | 1.04 (0.26) | 1.42 | 0.26 |
| 8-15 | 1.57 (0.26) | 2.84 (0.62) | 1.08 (0.60) | |||||||
| >=16 | 1.66 (0.47) | 2.84 (0.75) | 0.80 (0.31) | |||||||
| Lesser | 2-7 | 1.68 (0.33) | 0.57 | 0.56 | 2.60 (0.61) | 0.93 | 0.41 | 0.98 (0.38) | 0.04 | 0.96 |
| 8-15 | 1.50 (0.47) | 2.31 (0.83) | 0.93 (0.43) | |||||||
| >=16 | 1.54 (0.35) | 2.17 (0.66) | 0.98 (0.55) |
Hip Peak Vel. Symmetry Index Knee Peak Vel. Symmetry Index Ankle Peak Vel. Symmetry Index
| Age Group | Mean (SD) | F | p | Mean (SD) | F | p | Mean (SD) | F | p |
|---|---|---|---|---|---|---|---|---|---|
| 2-7 | 19.5 (13.2) | 0.01 | 0.99 | 16.7 (16.7) | 0.69 | 0.52 | 33.5 (38.7) | 0.96 | 0.39 |
| 8-15 | 19.8 (12.0) | 23.4 (20.8) | 30.0 (20.1) | ||||||
| >=16 | 18.9 (18.3) | 28.1 (25.7) | 49.4 (37.5) |
Phase Portraits
Table 3 contains a summary of the phase portrait areas by age group, joint and limb (greater vs lesser limbs). No statistically significant differences were found between groups for any joint and limb.
| Hip Phase Portrait Area [degrees² / %of gait cycle] | Knee Phase Portrait Area [degrees² / %of gait cycle] | Ankle Phase Portrait Area [degrees² / %of gait cycle] | ||||||||
|---|---|---|---|---|---|---|---|---|---|---|
| Side | Age Group | Mean (SD) | F | p | Mean (SD) | F | p | Mean (SD) | F | p |
| Greater | 2-7 | 80.3 (32.5) | 1.27 | 0.30 | 216.1 (36.3) | 0.99 | 0.39 | 51.5 (36.9) | 1.21 | 0.33 |
| 8-15 | 61.2 (15.8) | 181.2 (84.1) | 56.4 (53.2) | |||||||
| >=16 | 65.5 (29.0) | 175.5 (73.0) | 32.2 (15.7) | |||||||
| Lesser | 2-7 | 70.2 (24.3) | 0.85 | 0.44 | 139.1 (45.9) | 0.47 | 0.64 | 50.9 (36.3) | 0.25 | 0.78 |
| 8-15 | 56.1 (32.2) | 128.4 (78.1) | 44.0 (43.6) | |||||||
| >=16 | 56.4 (23.3) | 111.5 (65.7) | 39.3 (30.2) |
| Age Group | Mean (SD) | F | p | Mean (SD) | F | p | Mean (SD) | F | p |
|---|---|---|---|---|---|---|---|---|---|
| 2-7 | 22.2 (18.7) | 0.51 | 0.62 | 46.4 (31.8) | 0.46 | 0.64 | 67.6 (46.2) | 2.84 | 0.08 |
| 8-15 | 33.0 (29.0) | 39.0 (31.5) | 32.9 (26.8) | ||||||
| >=16 | 31.6 (25.6) | 53.8 (38.3) | 76.7 (48.9) |
Angle-Angle Diagrams
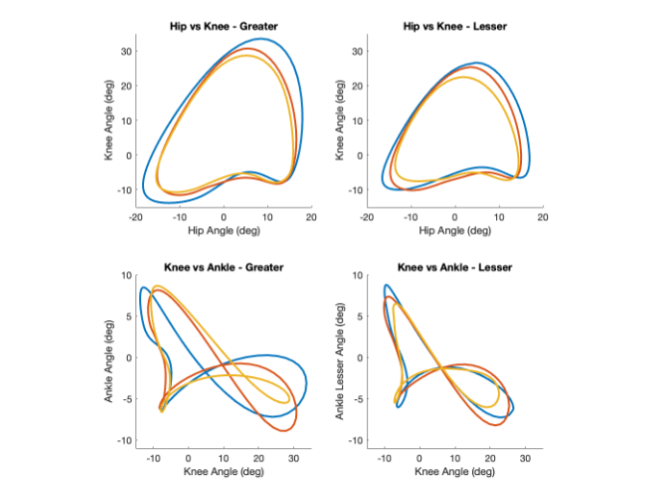
Figure 2. Angle-Angle metrics by Age group. Blue: 2–7, Orange: 8–15, Yellow: ≥16. The joint angle mean waveforms have been shifted to have a mean of zero, allowing for direct comparison of their relative shapes.
WAVEFORMS ANALYSIS
Mean joint angle waveforms and their 95% confidence intervals are presented in Figure 4, with corresponding waveform symmetry indexes summarized in Table 5.
Table 4 contains a summary of the angle-angle areas and by age group and Limb (greater vs lesser limbs), along with their symmetry index and permutation-based ANOVA results. No statistically significant differences were found between groups for any joint and limb.
| Hip vs Knee Area [degrees²] | Knee vs Ankle Area [degrees²] | ||||||
|---|---|---|---|---|---|---|---|
| Side | Age Group | Mean (SD) | F | p | Mean (SD) | F | p |
| Greater | 2-7 | 1119.9 (356.4) | 1.87 | 0.17 | 344.8 (137.6) | 2.27 | 0.13 |
| 8-15 | 939.3 (304.9) | 278.0 (177.8) | |||||
| >=16 | 841.5 (305.8) | 215.3 (85.2) | |||||
| Lesser | 2-7 | 824.5 (248.8) | 1.49 | 0.25 | 223.3 (88.5) | 0.35 | 0.72 |
| 8-15 | 744.8 (330.7) | 214.4 (125.1) | |||||
| >=16 | 609.0 (268.9) | 179.9 (145.9) |
Hip vs Knee Area Symmetry Index Knee vs Ankle Area Symmetry Index
| Age Group | Mean (SD) | F | p | Mean (SD) | F | p |
|---|---|---|---|---|---|---|
| 2-7 | 30.6 (21.9) | 0.12 | 0.90 | 51.7 (40.3) | 1.71 | 0.20 |
| 8-15 | 28.0 (20.9) | 28.2 (21.2) | ||||
| >=16 | 33.6 (31.0) | 55.2 (37.9) |
Waveforms Analysis
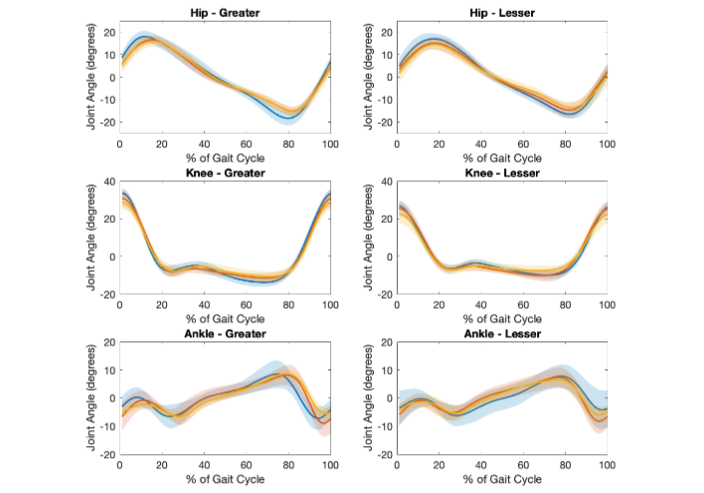
Figure 3. Mean Waveforms by Age group. Shaded areas represent the 95% Confidence Intervals: Blue: 2–7, Orange: 8–15, Yellow: ≥16. The joint angle mean waveforms have been shifted to have a mean of zero, allowing for direct comparison of their relative shapes.
The plots reveal overall consistency in joint motion patterns across age groups but also highlight joint- and age-specific differences in variability and symmetry. At the knee, waveform shapes were consistent across age groups, whereas at the hip, the 2–7 group exhibited greater amplitude on both limbs and different peak and low point timing on the greater side. Ankle joint waveforms displayed greater inter-group and intra-group variability than the more proximal joints. The 2–7 group exhibited more variable patterns (wider 95% CI) and greater amplitude at the ankle, whereas ≥16 group demonstrated relatively flat ankle trajectories in the lesser side, suggesting reduced dynamic control in distal segments.
Discussion
This study examined potential age-related differences in lower-limb joint kinematics and interlimb symmetry during gait in individuals with Rett syndrome (RTT). By analyzing joint range of motion (ROM), peak angular velocity, joint angles waveform shapes, and joint coordination through phase portraits and angle-angle diagrams, we evaluated if there were any developmental trends across three age groups. Our findings revealed no trend towards age group related differences, which was consistent with anecdotal observations. Prior reports have documented a progressive decline in mobility and motor coordination in older individuals with RTT, potentially due to a decline in motor planning and musculoskeletal factors. However, in our study, hip knee and ankle motion remained relatively preserved across all age groups, with consistent ROM, angular velocity, and waveform patterns.
Although chronological age was used to group participants, it is important to consider how the clinical course of Rett syndrome might relate to motor function. RTT typically follows a four-stage developmental pattern: an early period of stagnation with slowing of growth and emerging delays, a rapid regression of motor and cognitive skills, a subsequent plateau phase with relative stabilization of impairments, and, in some individuals, a later period of active decline characterized by progressive motor deterioration, rigidity, and skeletal complications such as scoliosis.
In the present study, ambulatory participants, regardless of their age, may have clustered within the plateau phase of motor function, during which impairments are established but not actively worsening. This possibility could help explain why joint range of motion, peak angular velocities, waveform shapes, and inter-joint coordination did not differ systematically across age groups in this sample. Because walking ability is typically preserved in individuals with less severe motor impairment, our results primarily reflect a functionally ambulatory subgroup. These findings suggest that chronological age alone may not be a reliable indicator of gait deterioration in ambulatory individuals with RTT and from a clinical perspective, it highlights the importance of individualized assessment rather than assuming progressive gait decline solely based on age.
A previous study comparing RTT individuals against age-matched neurotypical controls showed that participants in the 9-14 group had ankle ROM, ankle peak velocity and ankle phase portrait areas similar to age-match, neurotypical control group, suggesting that ankle behavior during gait in individuals with RTT may temporarily approximate neurotypical patterns during late-childhood (which may correspond to the plateau phase) before declining later in adolescence and adulthood. However, in the same study, a quite large inter-subject variability across the various measures was identified and highlighted as a factor that limits the generalizability of the findings. While the present study did not identify a similar age-related trajectory, the finding of greater ankle asymmetry in the youngest participants compared to the oldest group may reflect early challenges in interlimb coordination that stabilize with maturation or development of compensatory strategies. However, the higher within group variability (SD = 49.3) also limits the generalizability of the findings.
Our analysis of phase portrait and angle-angle diagram shapes provided additional insight into joint coordination beyond linear measures. Traditional gait metrics such as range of motion and peak angular velocity provide important information about the magnitude of joint movement but do not capture the temporal structure of joint coordination. Phase portraits and angle-angle diagrams provide a dynamic representation of joint behavior across the gait cycle, allowing subtle differences in timing, control stability, and coordination to be identified. Ankle phase portraits and knee–ankle loops on the greater side exhibited a slightly greater variability in shape across age-groups compared with the other joints, reflecting different coordination patterns in the ankle joint, which are also consistent with some gait characteristics previously reported, such as spasticity in the gastrocnemius-soleus muscle and toe-walking. These timing and control inconsistencies were not evident in ROM or peak velocity metrics, emphasizing the value of dynamic trajectory-based assessments in populations with neuromotor disorders.
Several limitations should be acknowledged in interpreting the results of this study. First, the small sample size and comparatively large variability within each age group limits the generalizability and conclusion of the findings and serves as a factor in the inability to identify statistically significant results. Such large variability observed within each age group, further support the notion that gait in RTT cannot be characterized by a single ‘stereotypical gait pattern’, but instead encompasses a range of compensatory coordination strategies that individuals adopt to accommodate their neurological impairments. Future research with larger cohorts will be necessary to confirm and expand upon these findings.
Second, the inclusion of only ambulatory individuals and the cross-sectional design prevent conclusions about developmental trajectories or causal relationships between age and motor control across the full spectrum of motor progression in individuals with Rett syndrome. Third, because gait data were collected during treadmill walking, the results may not fully represent overground locomotion where environmental variability and self-paced speed can influence gait patterns. In addition, the present study focused on kinematic variables and did not include kinetic or electromyographic measures that could provide additional insight into the neuromuscular mechanisms underlying the observed coordination patterns.
Conclusion
In this study, age-related differences in sagittal-plane gait kinematics were minimal among ambulatory individuals with Rett syndrome, highlighting the importance of individualized assessments rather than age-based expectations of gait decline. The only age-related difference was in increased ankle asymmetry in younger participants compared with the oldest group. However, conclusions regarding disease progression are limited by the cross-sectional design, small sample size, and inclusion of only individuals with effective gait. Overall, these findings highlight the importance of objective, technology-based gait assessment for characterizing motor function in RTT and support the need for longitudinal investigations and within subject analyses. Such studies will provide more insightful information to clinicians and rehabilitation specialists regarding changes in response to interventions designed to improve gait control.
Conflicts of Interest Statement
The authors have no conflicts of interest to declare.
Funding Statement
Funding for this research was provided by the Blue Bird Circle Rett Center, Houston, TX, and the International Rett Syndrome Foundation.
Acknowledgements
We deeply appreciate the participants and their parents without whose efforts this work could not have been conducted. A special thanks to David Young, Brock Futrell, Safaa Daou and Alan El Hakam for their assistance during data collection.
References
- Petriti U, Dudman DC, Scosyrev E, Lopez-Leon S. Global prevalence of Rett syndrome: systematic review and meta-analysis. Systematic Reviews. 2023;12(1):5. doi:10.1186/s13643-023-02169-6
- Neul JL, Kaufmann WE, Glaze DG, et al. Rett syndrome: Revised diagnostic criteria and nomenclature. Annals of Neurology. 2010;68(6):944-950. doi:10.1002/ana.22124
- De Mello Monteiro C, Savelsbergh G, Smorenburg A, et al. Quantification of functional abilities in Rett syndrome: a comparison between stages III and IV. Neuropsychiatric Disease and Treatment. 2014;10:1213. doi:10.2147/ndt.s57333
- Chapleau C, Lane J, Pozzo-Miller L, Percy A. Evaluation of current pharmacological treatment options in the management of RETT Syndrome: From the Present to Future Therapeutic Alternatives. Current Clinical Pharmacology. 2013;8(4):358-369. doi:10.2174/15748847113086660069
- Downs J, Leonard H, Jacoby P, Brisco L, Baikie G, Hill K. Rett syndrome: establishing a novel outcome measure for walking activity in an era of clinical trials for rare disorders. Disability and Rehabilitation. 2014;37(21):1992-1996. doi:10.3109/09638288.2014.993436
- Pozzo-Miller L, Pati S, Percy AK. Rett syndrome: reaching for clinical trials. Neurotherapeutics. 2015;12(3):631-640. doi:10.1007/s13311-015-0353-y
- Hanks SB. Motor disabilities in the rett syndrome and physical therapy strategies. Brain and Development. 1990;12(1):157-161. doi:10.1016/s0387-7604(12)80201-4
- Nomura Y, Segawa M. Characteristics of motor disturbances of the Rett syndrome. Brain and Development. 1990;12(1):27-30. doi:10.1016/s0387-7604(12)80170-7
- Smeets EEJ, Pelc K, Dan B. Rett syndrome. Molecular Syndromology. 2011;2(3-5):113-127. doi:10.1159/000337637
- Layne CS, Young DR, Lee BC, Glaze DG, Schwabe A, Suter B. Kinematics associated with treadmill walking in Rett syndrome. Disability and Rehabilitation. 2019;43(11):1585-1593. doi:10.1080/09638288.2019.1674389
- Temudo T, Ramos E, Dias K, et al. Movement disorders in Rett syndrome: An analysis of 60 patients with detected MECP2 mutation and correlation with mutation type. Movement Disorders. 2008;23(10):1384-1390. doi:10.1002/mds.22115
- Larsson G, Julu POO, Engerström IW, Sandlund M, Lindström B. Walking on treadmill with Rett syndrome—Effects on the autonomic nervous system. Research in Developmental Disabilities. 2018;83:99-107. doi:10.1016/j.ridd.2018.08.010
- Downs J, Bebbington A, Jacoby P, et al. Gross motor profile in Rett syndrome as determined by video analysis. Neuropediatrics. 2008;39(04):205-210. doi:10.1055/s-0028-1104575
- Cass H, Reilly S, Owen L, et al. Findings from a multidisciplinary clinical case series of females with Rett syndrome. Developmental Medicine & Child Neurology. 2003;45(05):325-337. doi:10.1017/s0012162203000616
- Downs J, Stahlhut M, Wong K, et al. Validating the rett syndrome gross motor scale. PLoS ONE. 2016;11(1):e0147555. doi:10.1371/journal.pone.0147555
- Colizzi M, Ciceri M, Di Gennaro G, et al. Investigating Gait, Movement, and Coordination in Children with Neurodevelopmental Disorders: Is There a Role for Motor Abnormalities in Atypical Neurodevelopment? Brain Sciences. 2020;10(9):601. doi:10.3390/brainsci10090601
- O’Keefe JA, Robertson-Dick EE, Hall DA, Berry-Kravis E. GAIT and functional mobility deficits in fragile X-Associated Tremor/Ataxia syndrome. The Cerebellum. 2015;15(4):475-482. doi:10.1007/s12311-015-0714-4
- Epstein A, Leonard H, Davis E, et al. Conceptualizing a quality of life framework for girls with Rett syndrome using qualitative methods. American Journal of Medical Genetics Part A. 2015;170(3):645-653. doi:10.1002/ajmg.a.37500
- Lotan M, Gootman A. Regaining walking ability in individuals with Rett syndrome: a case study. International Journal on Disability and Human Development. 2012;11(2). doi:10.1515/ijdhd-2012-0020
- Young DR, Suter B, Levine JT, Glaze DG, Layne CS. Characteristic behaviors associated with gait of individuals with Rett syndrome. Disability and Rehabilitation. 2020;44(8):1508-1515. doi:10.1080/09638288.2020.1820084
- Layne CS, Lee BC, Young DR, Glaze DG, Schwabe A, Suter B. Temporal Gait measures associated with overground and treadmill walking in Rett syndrome. Journal of Child Neurology. 2018;33(10):667-674. doi:10.1177/0883073818780471
- Neul JL, Percy AK, Benke TA, et al. Trofinetide for the treatment of Rett syndrome: a randomized phase 3 study. Nature Medicine. 2023;29(6):1468-1475. doi:10.1038/s41591-023-02398-1
- Palmieri M, Pozzer D, Landsberger N. Advanced genetic therapies for the treatment of Rett syndrome: state of the art and future perspectives. Frontiers in Neuroscience. 2023;17:1172805. doi:10.3389/fnins.2023.1172805
- Suzuki T, Ito Y, Ito T, et al. Pathological gait in Rett syndrome: Quantitative evaluation using three-dimensional gait analysis. European Journal of Paediatric Neurology. 2022;42:15-21. doi:10.1016/j.ejpn.2022.11.010
- Martinez Diaz D, Futrell B, Suter B, Layne CS. Gait Analysis in Rett Syndrome: Integrating linear and nonlinear techniques. Journal of Child Neurology. Published online September 19, 2025:8830738251371586. doi:10.1177/08830738251371586
- Neul JL, Kaufmann WE, Glaze DG, et al. Rett syndrome: Revised diagnostic criteria and nomenclature. Annals of Neurology. 2010;68(6):944-950. doi:10.1002/ana.22124
- Layne CS, Lee BC, Young DR, Glaze DG, Suter B. Methodologies to objectively assess gait and postural control features in Rett syndrome – With a comment on specific challenges and how to address them. Rare Diseases and Orphan Drugs. 2017;4(1):4-7.
- Layne CS, Martinez Diaz D, Malaya CA, et al. Using Linear and Non-Linear Techniques to Characterize Gait Coordination Patterns of Two Individuals with NGLY1 Deficiency. Case Reports in Clinical Medicine. 2024;13(09):391-409. doi:10.4236/crcm.2024.139048
- Goswami A. A new gait parameterization technique by means of cyclogram moments: Application to human slope walking. Gait & Posture. 1998;8(1):15-36. doi:10.1016/s0966-6362(98)00014-9
- Di Giminiani R, Di Lorenzo D, La Greca S, et al. Angle-Angle Diagrams in the Assessment of Locomotion in Persons with Multiple Sclerosis: A Preliminary Study. Applied Sciences. 2022;12(14):7223. doi:10.3390/app12147223
- Hurmuzlu Y, Basdogan C, Carollo JJ. Presenting joint kinematics of human locomotion using phase plane portraits and Poincaré maps. Journal of Biomechanics. 1994;27(12):1495-1499. doi:10.1016/0021-9290(94)90199-6
- Nigg S, Vienneau J, Maurer C, Nigg BM. Development of a symmetry index using discrete variables. Gait & Posture. 2012;38(1):115-119. doi:10.1016/j.gaitpost.2012.10.024
- Siebers HL, Alrawashdeh W, Betsch M, Migliorini F, Hildebrand F, Eschweiler J. Comparison of different symmetry indices for the quantification of dynamic joint angles. BMC Sports Science Medicine and Rehabilitation. 2021;13(1):130. doi:10.1186/s13102-021-00355-4
- Bisgaard A, Wong K, Højfeldt A, et al. Decline in gross motor skills in adult Rett syndrome; results from a Danish longitudinal study. American Journal of Medical Genetics Part A. 2021;185(12):3683-3693. doi:10.1002/ajmg.a.62429
- Bricker K, Vaughn BV. Rett syndrome: a review of clinical manifestations and therapeutic approaches. Frontiers in Sleep. 2024;3:1373489. doi:10.3389/frsle.2024.1373489
- Hagberg B. Clinical manifestations and stages of rett syndrome. Mental Retardation and Developmental Disabilities Research Reviews. 2002;8(2):61-65. doi:10.1002/mrdd.10020
- Hagberg B, et al. Clinical manifestations and stages of Rett syndrome. Mental Retardation and Developmental Disabilities Research Reviews. 2002;8(2):61-65. doi:10.1002/mrdd.10020
- Martinez Diaz D, Futrell B, Suter B, Layne CS. Gait Analysis in Rett Syndrome: Integrating linear and nonlinear techniques. Journal of Child Neurology. Published online September 19, 2025:8830738251371586. doi:10.1177/08830738251371586