


Game Theory in Chile’s Kidney Transplant Allocation System
The kidney distribution system for transplantation in Chile explained according to Game Theory: How theoretical generosity is transformed into real selfishness
Eng. Francisca González Cohens, MPH1; Camila González Bulboa, MD2; Fernando González Fuenzalida, MD3
- Web Intelligence Centre, Department of Industrial Engineering, School of Mathematics and Physics Sciences, Universidad de Chile, Santiago, Chile
- Cesfam Ossandon, Santiago, Chile
- Department of Medicine East, School of Medicine, Universidad de Chile. Nephrology, Dialysis and Kidney Transplant Unit, Hospital del Salvador, Santiago, Chile
OPEN ACCESS
PUBLISHED: 30 November 2024
CITATION: Cohens, FG., Bulboa, CG., et al., 2024. The kidney distribution system for transplantation in Chile explained according to Game Theory: How theoretical generosity is transformed into real selfishness. Medical Research Archives, [online] 12(11).
https://doi.org/10.18103/mra.v12i11.5885
COPYRIGHT © 2024 European Society of Medicine. This is an open-access article distributed under the terms of the Creative Commons Attribution License, which permits unrestricted use, distribution, and reproduction in any medium, provided the original author and source are credited.
DOI https://doi.org/10.18103/mra.v12i11.5885
ISSN 2375-1924
Abstract
Context: There is a huge mismatch between demand and supply of organs for transplantation, particularly kidneys. Their allocation system in Chile delivers one kidney to the procuring institution and the second to another national institution; policy designed seeking to stimulate procurement in transplant institutions.
Objectives: Evaluate whether this policy has been effective for increasing nationwide organ donation and procurement rates in procuring centers, whether their behavior is aligned with the local / pool kidney allocation system, and whether the policy has contributed to increasing equity in access to kidney transplantation.
Methods: We obtained the origin of all organ donors between 2010-2020 from public records, separating them by private or public institutions, and matched those organs with the corresponding information from the centers that implanted them, and used descriptive statistics, t-student tests, and linear regressions over time for analysis. We performed an economic analysis of the costs of procuring a kidney for transplantation, for which we gathered the public static prices, and a sample of the 5 largest private transplantation facilities’ prices.
Results: We found no significant increase in the total number of organ donors in the country during the studied period, and the mild increase observed was due to the addition of new public centers to the system. We observed that private institutions are increasing their participation in the transplant market and they do so at the expense of public institutions and without increasing their contribution of organs to the system, because of the high cost of procuring compared to the cost of transferring a kidney.
Conclusions: This behavior can be framed within the Game Theory, specifically the Tragedy of the Commons, describing that the players maximize their benefit at the expense of the rest without considering the subsequent consequences, which leads to an imbalance between demand and supply of organs for transplantation that worsens over time and lengthens waiting lists.
Keywords: organ procurement, kidney allocation, kidney transplantation, game theory, transplantation costs, organ donation
Introduction
Despite kidney transplantation being known as the best treatment for end-stage renal failure, the demand for kidneys, particularly from deceased donors, diverges from its supply. Which leaves many patients on waiting lists for prolonged time, with some of them even dying while awaiting a compatible transplant. In order to tackle this issue, it is important to understand how to assign an organ to a specific patient, which inevitably means that others will have to continue waiting.
There are several different kidney allocation systems in the world, and most of them employ criteria related to “maximizing” graft survival (for example, immunological HLA antigens compatibility, previous HLA sensitization, and / or donor age, among others), recipient characteristics (for example, recipient’s age, or time on waiting list), or a mix between both (for example, expanded criteria donor, HLA hypersensitization, or donors carrying transmissible viruses).
The institutions in charge of assigning available organs use relevant variables to create scores or algorithms in order to determine the most suitable recipient. This is easy to understand for single organs, such as the liver or heart. However, in the case of paired organs such as kidneys, there may be different allocation criteria for assigning each kidney. For example, one kidney may be assigned considering better chances for graft survival, and the other favoring the recipient, or for instance, having both kidneys assigned with the purpose of encouraging organ procurement activity by assigning one kidney to the waiting list of the procuring center, and the other to a regional or national waiting list.
In the latter case, the kidney that remains in the procuring center benefits from a reduced cold ischemia time but with poorer immunological compatibility compared to the kidney assigned to regional or national waiting lists.
Chile has opted for that allocation system design: assigning one kidney to the procuring center, and the other to the national pool of patients on waiting list. The system aims to stimulate the procurement process and, through this mechanism, improve the disparity in demand and supply of kidneys for transplantation. If the procuring center does not have a transplant program, the system assigns both organs to the national pool. The United Kingdom had a similar system where one organ was assigned locally and the other nationally, which was then phased out in favor of one that assigned both kidneys to the national pool in 2006.
This model is not too common worldwide: most countries allocate kidneys prioritizing local waiting lists, while national allocation is considered only for zero HLA-mismatched recipients or for other patients with certain conditions pre-established by each country. Examples of that model are Australia, Eurotransplant, Spain, and France, and in Latin America, countries like Argentina, Colombia, Ecuador, and Mexico. However, the new model adopted by the UK (national allocation) is also present in Scandiatransplant, New Zealand, and Israel.
Chilean authorities are currently considering changing the mixed allocation system design towards prioritizing a national pool design. Taking this into consideration, our objective is to evaluate four aspects: (a) Whether this all but unique policy adopted by Chile so far has been effective for increasing nationwide organ donation. (b) Whether it has been effective for increasing procurement rates in procuring centers (c) Whether the behavior of procuring centers is aligned with the local / pool kidney allocation system, or if it diverges by limiting their actions to only receiving organs without cooperating in procuring effective organ donors to keep the system running; or in other words, effectively behaving like kidney takers, and (d) whether the policy has contributed to increasing equity in access to kidney transplantation, in line with the spirit of the policy.
Materials and Methods
We obtained a list of all Chilean centers that contribute organs to the system (both publicly and privately funded), regardless of whether they had kidney transplantation programs. In parallel, we obtained a list containing the centers that effectively implant organs, regardless of whether they contribute with kidneys to the system.
We studied the period between 2010-2020, which includes the first year of the SARS-CoV-2 pandemic. During this year, transplantation activities were substantially modified for understandable healthcare reasons related to bed requirements for Covid-19 patients, albeit procurement activity remained unchanged.
We used descriptive statistics, t-student tests, and linear regressions over time for procurement and transplantation rates, and for the ratio of transplants over procurements. We also used modeling according to game theory to describe the behavior of the procuring and implanting centers for kidney transplantation.
For the game theory modeling, we calculated the total investment of the public system and the private clinics as a whole system by using: [1] the annual salaries of the procurement coordinating nurses (assuming that in the private system coordinating nurses work part-time in procurement coordination), [2] an additional ICU bed day for each effective or non-effective donor, considering a 50% familial refusal rate, [3] the neurologist’s fee for certifying brain death on each effective and non-effective donor, and [4] the use of the surgical ward for extraction surgery; as shown in Table 1.
The data we used for calculating each item was gathered from different sources. Respectively for the public sector: [1] the salaries of nurses was gathered from the State’s Transparency website; [2] the ICU bed price, [3] the neurologist medical care, and [4] the surgical ward, from the public insurance’s fixed prices (FONASA). For private institutions, we used respectively: [1] the salaries of nurses was gathered through personal information, [2] the ICU bed price, [3] the neurologist medical care, and [4] the surgical ward, from the published costs of the 5 largest transplant centers.
| Public System (US$ ± CI US$) | Private System (US$ ± CI US$) |
|---|---|
| Nurse Salary (si) (2 391 ± 258 /mo)* | 28 692 ± 3 096 /year (1 320 ± 146 /mo)† |
| Additional ICU bed (bi) 236‡ | 1 157§ ± 575 |
| Neurologist fee (phi) 12.21‡ | 85§ ± 26 |
| Surgical ward (swi) 411‡ | 2 754§ ± 289 |
* Average of the salaries of 15 nurses in public centers.
† Approximation of an average salary based on personal information of a clinical nurse in the private system, assuming they work part-time for procurement.
‡ Fixed 2020 price for public institutions.
§ Average of the service cost in the 5 largest private transplantation facilities.
While other organs were not considered in the analysis for simplicity, we calculated each kidney value as:
Ki = (12×ni×si)/(2×di) + (bi + 2×phi + swi)/2
For each i = (public institution, private institution), Ki is the cost of procuring one kidney, di is the mean annual number of donors between 2010-20, ni=Public = 60 and ni=Private = 14 are the total number of nurses, and si, bi, phi, and swi are described in Table 1. We assume that nurses will receive their salary despite the number of donors obtained, and that each donor provides 2 kidneys.
Results
KIDNEY PROCUREMENT AND TRANSPLANTATION ACTIVITY
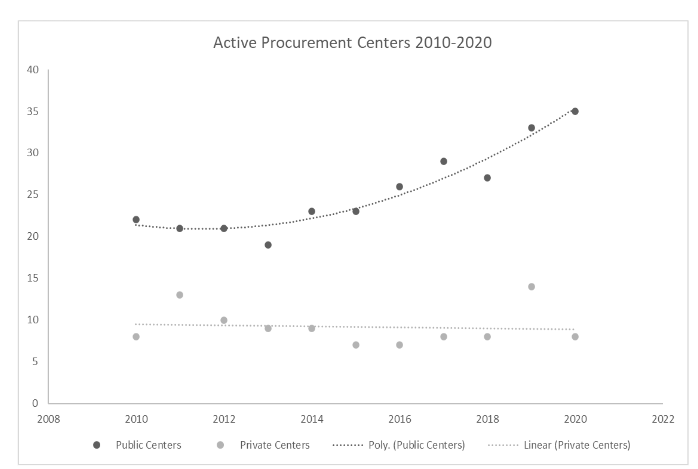
We found 55 public and 23 private centers with the technical capacity to procure effective organ donors, out of which a yearly median of 23 (range 19-25) and 8 (range 7-14) centers did so, respectively.
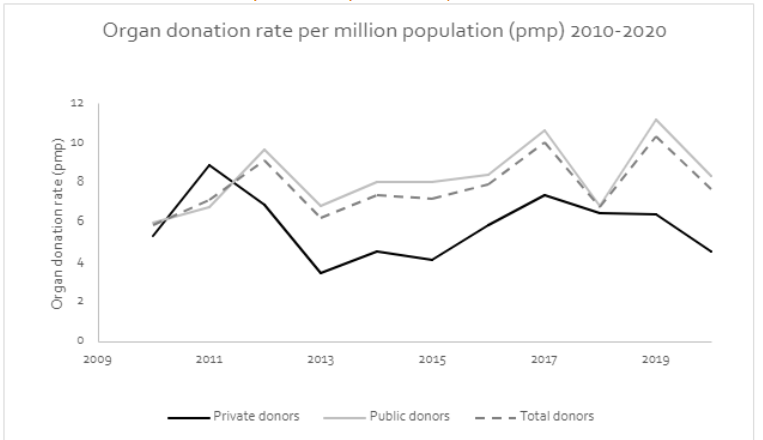
The national organ donation rate per million population (pmp) was 7.8 + 1.5 on average. Figure 2 shows the time trends of the national, public, and private center organ donation rates pmp, where we can observe that public centers have had larger rates than private ones: 8.2 + 1.7 versus 5.8 + 1.6 (p = 0.002).
When analyzing kidney transplantation figures as shown in Figure 3, we observe an increase in private transplantation rates (linear regression slope of r = 0.635; p = 0.003), and a stagnation – but a visual decrease during the last years – of public transplantation rates (linear regression slope of r = 0.13; p = 0.702). Therefore, the relative transplantation rate in public centers is half of private ones (0.46 + 0.12), this is, the proportion of public over private transplantation rates, and it tends to decrease over time (r = -0.612; p = 0.046).
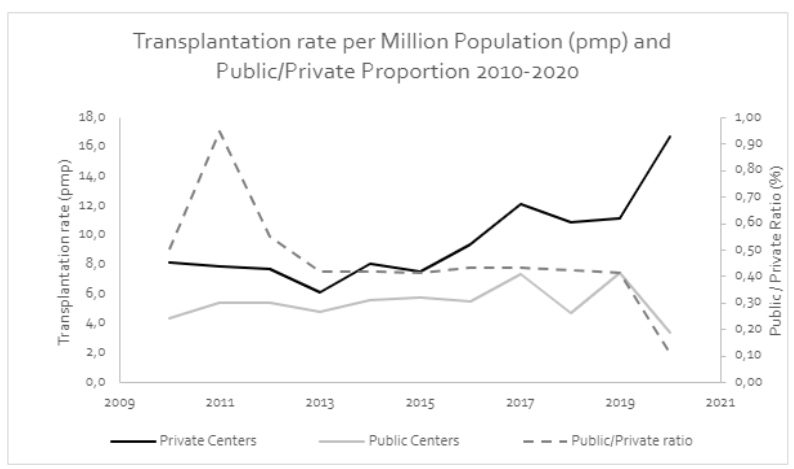
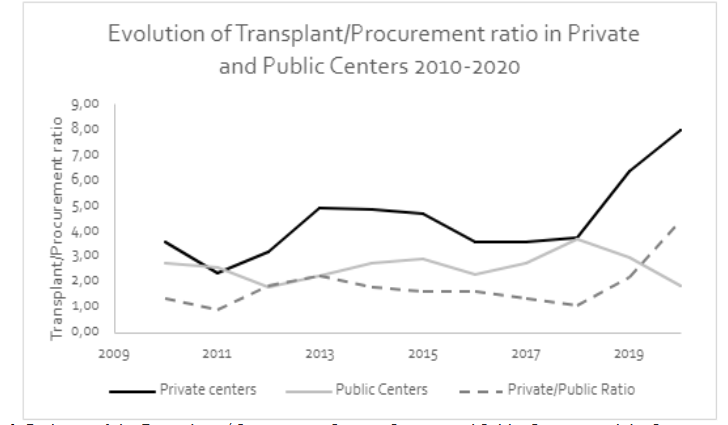
Figure 4 shows the time trends of transplant / procurement ratios for both types of centers, and the ratio of those ratios. From that figure we can observe that private centers have higher transplant / procurement ratios than their public counterparts (4.40 + 1.59 versus 2.56 + 0.54; p = 0.0017). Furthermore, their linear trend shows an increase over time since its linear regression has a positive slope (r = 0.681; p = 0.021). But for public institutions, the linear regression has a slope close to zero (r = 0.177; p = 0.603).
KIDNEY PROCUREMENT COSTS
In Table 1 (methods section) we observe a large difference between the prices in both public and private systems, where the private is more expensive in each of the evaluated services.
When calculating the costs of obtaining a kidney for transplantation for each system, we found the following:
Ki=Public = US$ 7 947 CI: (7 125; 8 769)
Ki=Private = US$ 8 160 CI: (7 032; 9 288)
Obtaining a kidney for transplantation in a private institution is 2.7% ($213) more expensive than in a public one. Furthermore, procuring a donor is 5 times more expensive than transferring a kidney for both the public and private sectors, since the cost of transferring a kidney from one center to another is just $1 577 (as stipulated by the Chilean public insurance institution). From an economic point of view, any institution would prefer to pay the transfer cost for transplanting one of their patients than procuring a donor (Ki – $1 577) because it is cheaper.
GAME THEORY APPLIED TO KIDNEY TRANSPLANTATION IN CHILE
Since paying the kidney transfer price is cheaper than procuring a kidney, both types of institutions will tend to cease contributing organs to the system in an equilibrium state, because they will be maximizing their own individual benefit. Nonetheless, since the costs and benefits of those two types of institutions are different there will be a specific type of institution more inclined to pursue this course of action (i.e.: maximize their own benefit) as shown in Table 2.
| Contributors | DOES | DOES NOT |
|---|---|---|
| Public Institutions | B | C |
| Private Institutions | b | c |
Discussion
As we have observed, the allocation system consisting of assigning one kidney locally to a recipient of the procuring center, and the other one to a regional or national recipient, does not achieve its theoretical objective, since it does not seem to stimulate centers for obtaining effective donors. This occurs in both public and private institutions, but it is more prominent in the latter.
As we observed in figure 2, overall donation rates appear to remain stagnant in time, albeit the main determinant of the country’s donation rate is the performance of public institutions, where we observe a significantly higher organ donation rate pmp, which makes those institutions the largest contributors of effective organ donors to the system. On the other hand, in figure 3 we observed that private institutions have a larger transplantation rate. If we consider both procurement and transplantation activities, a symmetric behavior between private and public centers should imply that the ratio between their procurement and transplantation rates remains stable throughout time. However, figure 4 consistently with the previous analyses, showed that this is not the case. Indeed, our results show that private centers are benefiting from public institution’s procurement activity, and thus taking advantage of the current kidney distribution system.
As we previously mentioned, this organ distribution system was once used in the United Kingdom but was later abandoned in 2006. Interestingly, back in 1987 some institutions which were contributing organs to the system realized that after several periods of work, they provided more kidneys to the regional or national distribution system compared to the kidneys they received in exchange. The rational explanation for choosing this kidney allocation policy is theoretically justified by the idea that the exchanged kidneys could have a better HLA antigen histocompatibility match than those that were transplanted locally. Thus, this could translate into an advantage in the graft survival expectancy which would compensate for the deleterious effect of a longer cold ischemic time of the organs that must be transported to a different center than the one where it was harvested.
This potential graft-survival convenience, given by the kidney exchanges, tends to reduce the need for the institutions to obtain organ donors to supply their own transplant centers. Nonetheless, this behavior does not benefit the potential recipients because it is currently understood that, following the introduction of calcineurin inhibitors, organs are less dependent on HLA compatibility for long-term survival. Perhaps the only justification for transferring an organ from one center to another outside the procuring locality is to address a medical emergency, or if the potential recipient has a very rare HLA type or zero HLA mismatch with the graft to be transferred.
According to our data, as this distribution policy reduces the procurement activity in each center, it reduces their capacity of self-supplying. So, in order to receive supply, new centers must enter the system by providing organs, as shown in Figure 1. This figure also shows how private centers are becoming stowaway centers of the system, as they make a minimal contribution and each period receive more organs from the public centers. This phenomenon is analogous to a Ponzi scheme in which receiving organs for transplantation, particularly for public institutions that procure effective donors, is based on new centers entering the system to contribute organs, since most of the existing ones are only waiting to receive from the system without giving anything.
Then, the question to be answered is why does this phenomenon occur? Why does an organ distribution system, designed by qualified health professionals, that aims to make the transplantation process fair and equitable, can produce such contradictory results far from what it originally intended?
A possible answer was given in 1950 by John Nash when he, based on the work of Antoine Augustin Cournot, John von Neumann and Oskar Morgenstern, described Game Theory. This theory posits that in any given situation where different participants (or “players”) are at odds with one another, all players will tend to adopt a participation strategy that maximizes their own benefit, regardless of the strategies adopted by their competitors. The best known example is the so-called “Prisoner’s Dilemma”: here, two prisoners who committed a crime together are being questioned and offered a deal: if neither of them confesses for the crime or they both blame each other, then they will both be sentenced, but if only one of them blames the other, they will be fully acquitted while their partner will be incarcerated in their stead. In this case, the primary incentive will be for one prisoner to blame the other, as this maximizes their own benefit (aiming for a full acquittal), which inexorably leads them to blame each other, hoping that the other has not done the same. Table 1 illustrates that the two types of institutions behave similarly to prisoners, since both maximize their own benefit and “wait” for a “generous” institution to send them the organs, without procuring donors. This model, called the “Tragedy of the Commons”, was described by James Garrett Hardin in 1968 and accurately predicts what our results illustrate: both type of institutions, but particularly private, maximize their benefit by being selfish, and that the kidney distribution system functions solely if new public institutions contribute to it, much like a Ponzi scheme.
But, is it possible to correct the selfish behavior observed in the “Tragedy of the Commons” scenario? One potential approach would be for an “authority” to intervene and force the institutions to cooperate under the threat of high penalties. For example, by setting a very high kidney transfer price, or applying very onerous fines; although in the case of private institutions the effect of the transfer price will be insignificant, since it will be fully transferred to the patient receiving the organ. Another potential approach could be to completely change the current distribution model by switching to one exclusively prioritizing either local or national allocation. Based on our findings, where Chilean institutions tend to behave towards maximizing their own benefit, prioritizing national allocation may not seem appropriate to stimulate the procurement activity, and thus improve organ donation rates. Instead, we suggest adopting a system that prioritizes local allocation in order to incentivize each institution to generate enough organ donors to supply their own transplantation programs, allowing exchanges only in very specific cases.
In summary, a kidney allocation system for transplantation that delivers one organ to the procuring institution, and the other one to a different institution that did not participate in its procurement, reduces organ donation activity overall (as Salaman and Ross already stated in 1987 for the UK). Sooner rather than later, a system like this will lead to growing waiting lists in kidney transplant institutions.
While the Chilean system is known for being “equitable”, because it assigns the organ to the person who needs it the most, the truth seems to be that the incentives for procurement and transplant institutions are structured in such a way that individuals with money (private sector) benefit disproportionately from kidney transplantation compared to poorer individuals (public sector). If we want to ensure that equity is genuinely present in our organ donation and transplantation system, the procurement incentives must be modified to benefit public institutions.
Conclusion
We hope that these findings will be of assistance to the Chilean government in considering a swift change to the system (instead of waiting decades to do so, as was the case of the UK) in order to promote equity in kidney allocation, and to incentivize institutions towards procuring organs for transplantation. Moreover, we also hope that these findings may also help countries with regional allocation systems, like New Zealand and Israel, to study their own kidney donation and transplantation figures in order to assess, as in the case of Chile, whether their allocation systems are benefitting institutions that don’t contribute to increasing organ availability.
Conflicts of interest statement
All authors declare that there is no conflict of interest regarding the publication of this manuscript.
Funding statement
This research did not receive any specific grant from funding agencies in the public, commercial, or not-for-profit sectors.
Acknowledgments
We acknowledge Daniel Andres Gonzalez for revising English spelling and translating some sections of the manuscript from Spanish to English.
References
- Rana A, Gruessner A, Agopian VG, et al. Survival benefit of solid-organ transplant in the United States. JAMA Surg. 2015;150(3):252-259. doi:10.1001/jamasurg.2014.2038
- Lewis A, Koukoura A, Tsianos GI, Gargavanis AA, Nielsen AA, Vassiliadis E. Organ donation in the US and Europe: The supply vs demand imbalance. Transplant Rev. 2021;35(2):100585. doi:10.1016/j.trre.2020.100585
- Wu DA, Watson CJ, Bradley JA, Johnson RJ, Forsythe JL, Oniscu GC. Global trends and challenges in deceased donor kidney allocation. Kidney Int. 2017;91(6):1287-1299. doi:10.1016/j.kint.2016.09.054
- Lee D, Kanellis J, Mulley WR. Allocation of deceased donor kidneys: A review of international practices. Nephrology. 2019;24(6):591-598. doi:10.1111/nep.13548
- Stewart DE, Klassen DK. Early Experience with the New Kidney Allocation System: A Perspective from UNOS. Clin J Am Soc Nephrol. 2017;12(12):2063-2065. doi:10.2215/CJN.06380617
- Watson CJE, Johnson RJ, Mumford L. Overview of the Evolution of the UK Kidney Allocation Schemes. Curr Transplant Rep. 2020;7(2):140-144. doi:10.1007/s40472-020-00270-6
- Faitot F, Michard B, Artzner T. Organ allocation in the age of the algorithm: avoiding futile transplantation – utility in allocation. Curr Opin Organ Transplant. 2020;25(3):305-309. doi:10.1097/MOT.0000000000000752
- Israni A, Wey A, Thompson B, et al. New Kidney and Pancreas Allocation Policy: Moving to a Circle as the First Unit of Allocation. J Am Soc Nephrol. 2021;32(7):1546. doi:10.1681/ASN.2020121679
- Javier Domínguez C. Sistema de distribución de órganos en chile: propuestas para una modificación de la distribución de riñones de donantes cadavéricos para trasplante. Rev Médica Clínica Las Condes. 2010;21(2):179-185. doi:10.1016/S0716-8640(10)70522-8
- INCUCAI A. Normas para la habilitación de establecimientos y autorización de equipos de profesionales para la práctica de ablación e implante de riñón y uréter y para la evaluación pre-trasplante y seguimiento post-trasplante. Accessed June 13, 2022. https://www.argentina.gob.ar/sites/default/files/norm-ren-reso-incucai_062_17.pdf
- Alcaldía Mayor de Bogotá S de S. Lineamientos de distribucion y asignacion de riñon en la Coordinacion Regional N1 red de Donacion Trasplantes. 2016. Accessed June 17, 2022. http://saludcapital.gov.co/Lineamientos/2016-2020/44_SDS_PSS_LN_005_Distribucion_Asignacion__Ri%C3%B1onCoordiancion_Regional_N1_Red_Donacion_Trasplantes.pdf
- Almeida Ubidia DHM. RESOLUCIÓN 012-INDOT-2015 EMÍTENSE LAS POLÍTICAS DE ASIGNACIÓN RENAL Y HEPÁTICA PARA TRANSPLANTES. 2015;Ministerio de Salud Pública:41.
- Nieto EP. Reglamento de la Ley General de Salud en Materia de Trasplantes. :24.
- Ministerio de Salud. Yo Dono Vida – Estadísticas. Ministerio de Salud – Estadísticas. Accessed March 26, 2019. https://yodonovida.minsal.cl/estadisticas/estadisticas.html
- González Cohens F, González Fuenzalida F. The coronavirus pandemic did not impact Chilean organ donation system. Transpl Int. Published online September 1, 2021:10.1111/tri.13999. doi:10.1111/tri.13999
- González Cohens F, Vera Cid F, Alcayaga Droguett R, González Fuenzalida F. Análisis crítico de la baja tasa de donación de órganos en Chile. Rev Med Chile. 2020;148(2):267-276. doi:10.4067/s0034-98872020000200242
- Directorio de organismos regulados – Portal de Transparencia del Estado de Chile. Accessed October 14, 2024. https://www.portaltransparencia.cl/PortalPdT/buscador-directorio-de-organismos-regulados
- Fonasa Chile 2022. Accessed June 6, 2023. https://www.fonasa.cl/sites/Satellite?c=Page&cid=1520002044318&pagename=Fonasa2019%2FPage%2FF2_ContenidoDerecha#aranceles-mai-2022
- Clinica Las Condes. Aranceles 2021 y Honorarios Medicos. Accessed October 14, 2024. https://www.clinicalascondes.cl/Dev_CLC/media/Otros/pdfs/Aranceles2021-Honorarios-Medicos.pdf?gclid=CjwKCAiAtouOBhA6EiwA2nLKH2jtfVaYuU8Vb1nyrNUbxiMqIradbBlmgsxyOVouBVZKzoMHs_yCRoCF1oQAvD_BwE
- UC Christus R de S. Arancel de prestaciones 2021. Published online 2021. Accessed October 14, 2024. https://d328k6xhl3lmif.cloudfront.net/docs/default-source/default-document-library/arancel-2021-csc.pdf?sfvrsn=30d791f0_2
- Arancel | Clínica Alemana de Santiago. Accessed October 14, 2024. https://www.alemana.cl/wls/arancel/
- Aranceles. Accessed October 14, 2024. https://www.clinicasantamaria.cl/necesitas-atencion/pacientes/aranceles/
- Aranceles Nuevo. Clínica Dávila. Accessed October 14, 2024. https://www.davila.cl/aranceles/
- Palacios Junemann JM. Procuramiento de Órganos: el modelo chileno. Rev Chil Cir. Published online 2002:573-588.
- Salaman JR, Ross WB. EXCHANGING KIDNEY TRANSPLANTS—IS IT WORTH IT? The Lancet. 1987;329(8548):1480-1481. doi:10.1016/S0140-6736(87)92220-3
- Zuckoff M. Ponzi’s Scheme: The True Story of a Financial Legend. Random House Publishing Group; 2005.
- Nash JF. Equilibrium points in n-person games. Proc Natl Acad Sci. 1950;36(1):48-49. doi:10.1073/pnas.36.1.48
- Hardin G. The Tragedy of the Commons. Science. 1968;162(3859):1243-1248. doi:10.1126/science.162.3859.1243