

Glycolysis Paradigm Shift: Impacts on Brain Imaging
Deciphering Signals of Imaging Techniques based on an Old Paradigm of Energy Metabolism Could Lead to Misunderstanding of Brain Function
Avital Schurr1
- Department of Anesthesiology and Perioperative Medicine, University of Louisville School of Medicine, Louisville, KY 40202, USA
OPEN ACCESS
PUBLISHED: 31 July 2025
CITATION: Schurr, A., 2025. Deciphering Signals of Imaging Techniques based on an Old Paradigm of Energy Metabolism Could Lead to Misunderstanding of Brain Function. Medical Research Archives, [online] 13(7). https://doi.org/10.18103/mra.v13i7.6693
COPYRIGHT: © 2025 European Society of Medicine. This is an open-access article distributed under the terms of the Creative Commons Attribution License, which permits unrestricted use, distribution, and reproduction in any medium, provided the original author and source are credited.
DOI https://doi.org/10.18103/mra.v13i7.6693
ISSN 2375-1924
Abstract
The sequence of the enzymatic reactions of glycolysis, the first biochemical pathway to be elucidated, was revealed in 1940. Today, eighty-five years later, this pathway is still displayed in textbooks, academic courses and online platforms unchanged from its original representation, despite major discoveries that question its accuracy. The dogmatic division of the pathway into aerobic and anaerobic glycolysis, each producing a different end-product, pyruvate or lactate, respectively, a concept that has been debunked, is continuing to be taught and used unchanged. As a result, the term “aerobic glycolysis” continues to imply an inefficient energy production that ends with lactate, despite the presence of oxygen. Therefore, the reliance of modern imaging techniques, such as BOLD fMRI, on the original schematics of the glycolytic pathway for both diagnostic purposes and in studying the metabolic basis of neural activity, could lead to skewed or misinterpreted signals. Scientists, physicians, teachers and students alike are encouraged to consider the paradigm shift from the original concept of glycolysis, based on the discoveries of the past four decades. A few published studies that employed imaging techniques were reexamined here, while relying on the proposed shift, indicating that their original results were misinterpreted. Consequently, it is recommended that for a better understanding of brain function and dysfunction both physicians and brain research scientists should consider glycolytic paradigm shift when employing brain imaging techniques and interpreting their signals.
Keywords: BOLD fMRI, cerebral metabolic rate, glucose, glycolysis, lactate, oxygen, paradigm shift
Introduction
Although the glycolytic pathway’s sequence of enzymatic reactions, their substrates, products, and coenzymes are still being taught unchanged from its original description back in 1940, some important details of this original description have been challenged over the past four decades. The most significant challenge originated back in the 1980s, when two studies, published independently, questioned the dogma that lactate, the end-product of anaerobic glycolysis, is a useless waste product that tissues must rid themselves of. These two studies revealed that lactate can be oxidatively metabolized by both slow twitch skeletal muscle fibers and neural tissue, respectively, a discovery that was received with great skepticism. Almost half a century of holding an erroneous view of lactate by scientists, physicians, teachers, and athletic coaches, has proved to be a tall hurdle for many to overcome, prolonging the debate over the obvious necessity for a paradigm shift. Nevertheless, most textbooks and biology courses, both in classrooms and online, continue to overlook the advancements made in the field of energy metabolism and the role of glycolysis and its end-product, lactate. Acceptance of the new paradigm should open new avenues for better understanding of both brain functions and central nervous system (CNS) disorders. By 1940, the glycolytic pathway, also known as the Embden–Meyerhof–Parnas (EMP) pathway, after years of intense research, mainly in muscle tissue, was presented as the first metabolic pathway to be explicated (Figure 1a, 1b). That presentation established the division of the pathway into two types: Aerobic and anaerobic glycolysis i.e., in the presence or absence of oxygen, respectively. Aerobic glycolysis was described as a series of 10 enzymatic reactions, with pyruvate as its end-product (Figure 1a), while anaerobic glycolysis was described as a series of 11 enzymatic reactions, with lactate as its end-product. The 11th reaction is catalyzed by the enzyme lactate dehydrogenase (LDH), where pyruvate is reduced to lactate and the co-enzyme nicotinamide adenine dinucleotide (NADH) is oxidized to NAD+ (Figure 1b). The determination by Embden, Meyerhof, and Parnas that aerobic glycolysis ends with pyruvate was not based on any direct experimental study that showed pyruvate to be the glycolytic product of glucose hydrolysis in the presence of oxygen. In contrast, they were familiar with the numerous studies performed in the first half of the 20th century that dealt specifically with anaerobic glycolysis in working muscles that led to the formation of lactate, a product that at the time was considered useless (see Ref. 6 and Table 1 within). They also knew that resting aerobic muscle does not produce lactate. To devise the aerobic glycolytic pathway, they turned to the work of Krebs and Johnston, who in their seminal paper suggested that pyruvate could be the substrate for the formation of acetyl-CoA, the entry molecule into the tricarboxylic acid (TCA) cycle. Since under aerobic conditions lactate does not accumulate, it made sense to assume that its precursor, pyruvate, is the main end-product of aerobic glycolysis and hence, the birth of the two separate glycolytic pathways, aerobic and anaerobic. Interestingly, E. G. Holmes and his wife, B. E. Holmes, who in the mid-1920s investigated energy metabolism of the brain, published several papers showing that brain tissue forms lactate from glucose and that under aerobic conditions the brain level of lactate decreased. Later, when C.A. Ashford joined Holmes’, the trio established for the first time a correlation between lactate disappearance in brain tissue and oxygen consumption (oxidative lactate utilization?). Moreover, these investigators demonstrated that sodium fluoride (NaF) inhibits the conversion of glucose to lactate, while concomitantly inhibits oxygen consumption. Holmes also found out that NaF completely blocked oxygen consumption in the presence of glucose, using brain gray matter preparation. However, when glucose was replaced by lactate, oxygen consumption was not inhibited, leading him to conclude that glucose must be converted to lactate prior to its oxidation by gray matter. Quastel and Wheatley found that glucose, lactate and pyruvate at equivalent concentrations are oxidized at the same rate by brain tissue, and that lactate was completely oxidized by brain tissue. Although none of these investigators directly claimed that lactate could be utilized oxidatively by brain tissue as an energy substrate, Holmes did allude to lactate oxidation that could support brain activity.
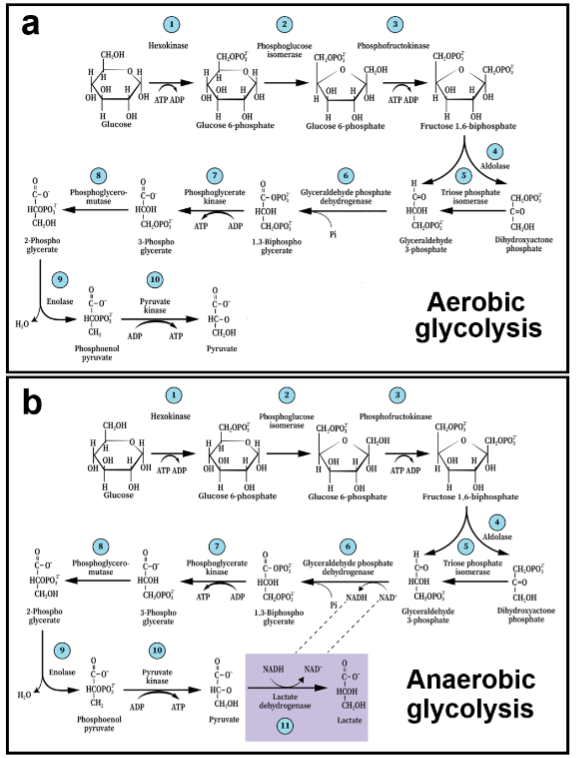
Nevertheless, the scientists investigating muscle energy metabolism at the time, and for whom lactate was a useless product of anaerobic working muscle, any consideration of this monocarboxylate as anything but waste was unimaginable. Consequently, glycolysis under anaerobic conditions was formulated as a dead-end pathway with lactate accumulation, despite the above-mentioned studies of brain tissue, while aerobic glycolysis was formulated with pyruvate as its end-product. This original paradigm remained unchanged and unquestioned for almost half a century, when Brooks and Schurr et al. independently demonstrated the ability of both skeletal and brain tissue, respectively, to utilize lactate as an oxidative mitochondrial substrate for the TCA cycle. Also in 1988, Fox et al. published a study that demonstrated nonoxidative glucose consumption by active neural tissue in humans. That study ushered in the term ‘aerobic glycolysis,’ not the original meaning, which means glycolysis in the presence of oxygen that ends with pyruvate, but rather glycolysis in the presence of oxygen that ends with lactate. Despite the confusion it created, the new meaning has become synonymous with glucose consumption and lactate production not accompanied by oxygen consumption. Although the finding by Fox et al. stands against the original formulation of aerobic glycolysis, it nevertheless has been accepted by most investigators as a valid discovery. In 1994, Pellerin and Magistretti offered the ‘astrocyte neuronal lactate shuttle’ (ANLS) hypothesis, which states that during neural glutamatergic activation, astrocytes use glucose glycolytically, mainly to support the activity of Na+,K+-ATPase, while producing lactate. They hypothesized that the astrocytic lactate is then shuttled to neurons that utilize it oxidatively as a substrate for the mitochondrial TCA cycle. Ironically, the ANLS hypothesis has been facing more skepticism than the aerobic glycolysis determination by Fox et al. Clearly, neither glycolysis under aerobic conditions that ends with lactate nor lactate as an oxidative substrate for the mitochondrial TCA cycle and oxidative phosphorylation fits the original 1940 concept of glycolysis. Nonetheless, lactate as an oxidative substrate for respiration, especially by cerebral tissue, has been documented numerous times with direct measurements of oxidative lactate consumption.
By contrast, the concept that the inefficient ‘aerobic glycolysis’ could support brain activation is based on an indirect determination of oxygen consumption via measurement of blood oxygen levels, where no change in those levels was interpreted as lack of consumption. Studying the energy metabolism of brain function in vivo involves correlating glucose consumption with oxygen consumption, the two principal substrates of respiration. Therefore, most studies estimate oxygen consumption by measuring blood oxygen level, where one is expected to find the theoretically calculated ratio of O2/glucose = 6 or, where brain consumption of these two substrates being described as the ratio between cerebral metabolic rate of oxygen (CMRO2) and glucose (CMRgluc). However, since this expected ratio is frequently found to be much lower than 6, many concluded that the adenosine triphosphate (ATP) needed to support brain activity is not supplied exclusively by mitochondrial oxidative phosphorylation, but by the less efficient ‘aerobic glycolysis’ where oxygen is not being consumed. To justify the brain’s choice of an inefficient energy-producing process, aerobic glycolysis, to support its activity, Theriault et al. offered the ‘efficiency tradeoff hypothesis’ since reliance on the inefficient ‘aerobic glycolysis’ where ATP production is concerned, a 1/17th of the much more efficient oxidative phosphorylation, does require a logical explanation. However, the determination that ‘aerobic glycolysis’ is the process that provides ATP for ‘task-based stimulation’ in the study of Theriault et al. is based on the employment of blood oxygenation level-dependent (BOLD) functional magnetic resonance imaging (fMRI), a technique where the signal depends on the concentration of deoxyhemoglobin in the blood vasculature. Again, reliance on measurement of blood oxygen levels as the index of oxygen consumption by brain tissue could be problematic. Clearly, the relationship between energy metabolism and cerebral activity presents a major dilemma for neuroscientists who are eager to have a better grasp of this relationship and subsequently, a better understanding of brain functions and dysfunctions. But, continuing to hold to the original 1940 presentation of glycolysis and rely on indirect measurements of oxygen consumption, this dilemma will continue to fester.
Paradigm shift of glycolysis and energy metabolism of active brain
As argued above, biochemical, physiological, and neuroscientific studies over the past four decades do not support the original concept of two different glycolytic pathways, an aerobic one that ends with pyruvate, and an anaerobic one that ends with lactate. Yet, many continue to rely on this old paradigm for the interpretation of experimental results, ignoring possible contradictions in such interpretations. The interpretation by Fox et al. of their results, concluding that sensory activation in the brain is supported by non-oxidative energy metabolism, is understandable, since they were not privy to the paper by Schurr et al. showing that lactate can be oxidatively utilized. It is perplexing how persistent the use of the original presentation of the glycolytic pathway is in current literature. The hypothesis paper by Theriault et al., where the authors, on one hand accept the fact that during brain activation glycolysis under aerobic conditions ends with lactate (‘aerobic glycolysis’), while on the other hand they are continuing to promote the old concept, where glycolysis in the resting brain ends with pyruvate (the old description of aerobic glycolysis). As mentioned above, to explain this incongruity, the authors offered the ‘efficiency tradeoff hypothesis.’ This hypothesis treads against our general understanding of the brain as the largest consumer of energy, where efficiency is a must due to the limited supplies of energy substrates (glucose and oxygen). Of course, there are more pieces and events that participate in the conversion of glucose to lactate, including the very last enzyme of the pathway, LDH, and the cyclical conversion of NAD+ to NADH, assuring the continuous supply of the latter, a reducing power necessary for multiple metabolic processes, including glycolysis. There are also the monocarboxylate transporters (MCTs), the membranal proteins that allow the facilitated diffusion of lactate both inter- and intracellularly. However, for the purpose of this monograph, they are not being elaborated upon here. An analysis of published studies on energy metabolism of activated brain, using the shifted paradigm of glycolysis, produced a different picture from the one described when the old template is used. Since the publication of the study by Fox et al., who first suggested that brain activity is supported by non-oxidative energy metabolism, a multitude of studies either agreed or disagreed with that conclusion. Other studies pointed out the difficulties in establishing the direct link between calculated CMRO2 and cerebral blood flow (CBF) or BOLD measurements.
As mentioned earlier, most investigators who study and measure cerebral metabolic rates of oxygen and glucose expect the ratio CMRO2/CMRgluc to approach 6. The non-oxidative energy metabolism in support of neural activation, as concluded by Fox et al., is in complete disagreement with the findings of Hyder et al. How could these two studies, aimed at measuring oxygen and glucose consumption during brain activation, reach completely opposite conclusions? While Fox et al. determined that glucose consumption by activated neural tissue is decoupled from oxygen consumption, Hyder et al. claimed that the consumption of the two during activation is fully coupled. Both groups of investigators relied in their calculations on the original 1940 paradigm of the glycolytic pathway, where aerobic glycolysis ends with pyruvate, the presumed substrate of the mitochondrial TCA cycle, and anaerobic glycolysis that ends with lactate devoid of oxygen consumption. Therefore, detection of oxygen consumption leads one to assume that glucose was hydrolyzed aerobically to pyruvate, which enters the mitochondrion as the substrate of the TCA cycle and its coupled electron transfer chain and oxidative phosphorylation. Detection of minute amounts of oxygen consumption or complete lack of such consumption leads one to assume that glucose was hydrolyzed via anaerobic glycolysis to produce lactate. Alternatively, either CMRO2/CMRgluc = 6 or CMRO2/CMRgluc = 0. Any calculated value for this ratio that is < 6 would signify some non-oxidative glucose consumption.
While methods and techniques for cerebral glucose consumption in vivo are well established, whether via the use of glucose analogs such as 2-deoxyglucose or by employing [13C] glucose, methods and techniques to measure cerebral oxygen consumption are less direct, where many rely on measurement of either CBF or BOLD signal strength. For the measurement of cerebral energy metabolism in vivo, chemical changes in aortic and venal blood entering and exiting the brain, respectively, could be documented, cerebrospinal fluid could also be used for such measurements. Additionally, brain tissue samples can be collected for analysis before and after brain activation, although only where experimental animals are used. Utilization of radioisotopes in analysis techniques of brain metabolic activity has improved both in speed and accuracy, where beside tracing the end-products of cerebral metabolism, the intermediates of that metabolism could also be traced. Nevertheless, these techniques require the sacrifice of the animal under study, while providing only a single measurement point mainly of a qualitative value. One of the most reliable techniques to measure oxygen consumption has been the polarographic technique, where oxygen concentration is derived via measurement of the partial oxygen pressure (PO2) locally, at the point where the polarographic electrode is placed. Continuous PO2 measurements while also monitoring brain activity via electroencephalogram (EEG), demonstrated a correlation between increased activity and decreased tissue oxygen level. The development of oxygen microelectrodes has afforded a more accurate localization of such measurements. When accurate and localized measurements of oxygen concentration are combined with similar accurate and localized measurements of glucose and lactate concentrations, a detailed map of the consumption of these three molecules by the active brain region under study could be obtained. The study by Hu and Wilson describes the concomitant in vivo measurements of oxygen, glucose, and lactate consumption during neural stimulation. This study deserves much greater attention than it has received over the past 28 years (384 citations).
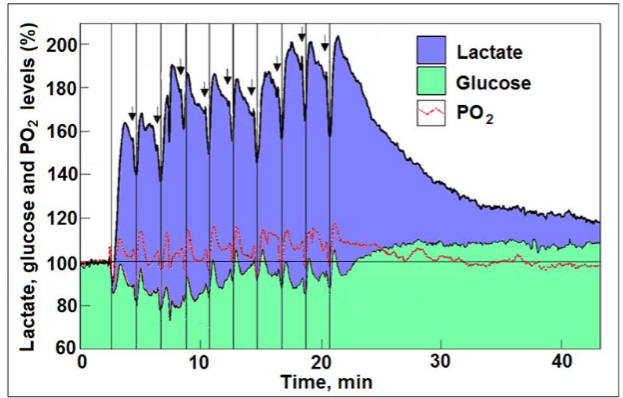
Its findings do not support the ‘aerobic glycolysis’ idea held by some of the leading investigators in the field of brain energy metabolism, a fact that could explain why this study has been shunned by many. We reanalyzed the results of the study by Hu and Wilson, results that provide strong support for the above-mentioned paradigm shift. The reanalysis suggests that the observed increased levels of cerebral lactate that followed each stimulation in the study by Hu and Wilson, could not be completely originated from glycolytic metabolism of glucose. Therefore, a portion of this post-stimulus lactate level must be derived from the surrounding tissue of the recording site (astrocytes?) or from glycogen breakdown or both. Concomitantly, an increasing amount of lactate was consumed following each consecutive stimulation, which was mirrored by a decreasing amount of glucose consumption. Similarly, following each stimulation, excluding the very first one, the tissue lactate level measured by Hu and Wilson was higher than the calculated level based on the amount of glucose consumed i.e., two moles of lactate per one mole of glucose. Following the second stimulation, the ratio of lactate to glucose was 3.95 and by the 10th stimulation it increased to 8.33. Where oxygen consumption is concerned, its tissue levels dipped as expected immediately upon each stimulation and rose immediately after the cessation of each stimulation with an overshoot. These fluctuations went hand in hand with those observed for glucose and lactate, signifying that stimulation evokes oxidative consumption of both glucose and lactate. Initially, glucose and lactate were equally consumed oxidatively, but from the second stimulation on, higher amounts of lactate than glucose were consumed.
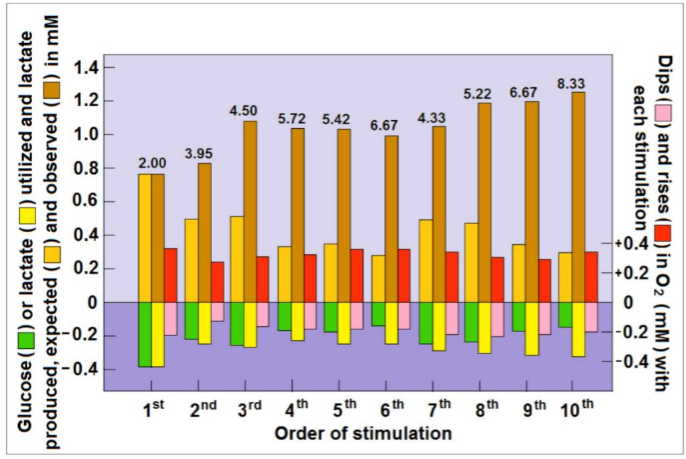
Taking into account that three moles of oxygen are required to fully oxidize one mole of lactate, compared to six moles of oxygen necessary for full oxidation of glucose, then, if lactate is the main oxidative energy substrate during brain activation, CMRO2/CMRlac should not exceed 3:1. Consequently, if lactate is the major substrate for ATP production in support of such activation, CMRO2/CMRgluc should be significantly lower than 6:1. Interestingly, upon the cessation of stimulation and during tissue recovery from activation and its high energy demands, lactate appears to be the preferred oxidative energy substrate, a preference that spares glucose, as evidenced by the rise in glucose tissue level with concomitant decrease in lactate levels. It would be reasonable to argue that, for the purpose of efficiency, cerebral tissue would prefer lactate over glucose, especially with the abundance of the former. This is since the oxidative utilization of lactate bypasses glycolysis and does not require ATP investment prior to its mitochondrial utilization, compared to glucose glycolytic breakdown.
Considering the conflicting conclusions reached by investigators studying the energy metabolism of the activated brain, as they rely on the original 1940 presentation of the glycolytic pathway, one faces a dilemma when attempting to explain it. Is it due to methodological differences? Differences in research subjects (humans, animals)? Differences in brain regions under study? As described here, the conclusion of a given study could also be hinged on whether its performers interpreted their study’s results relying on the original glycolysis paradigm or on the shift that took place in that paradigm over the past four decades. This shift states that glycolysis is always a pathway of 11 enzymatic reactions, which begins with glucose and ends with lactate.
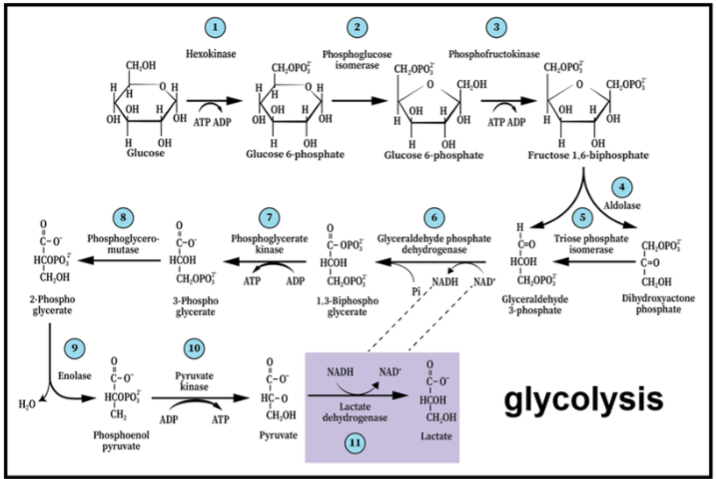
Neither oxygen nor mitochondria play any role in determining its outcome. Only when this paradigm shift is universally accepted by the field investigating brain energy metabolism during rest and activity, in health and disease, will real progress be observed. The continuous reliance on the original 1940 glycolytic paradigm has become a significant hurdle on our path for a better understanding of the most important metabolic process in the central nervous system (CNS). It is given that when a scientific paradigm shift takes place, a reconsideration of hypotheses and concepts used in its formulation ensues. Originally, CMRO2 and CMRgluc definition for both the resting and activated neural tissue, the employment and the choice of techniques and methods to measure these cerebral metabolic rates, and the interpretation of the results they produce have always relied on two central assumptions: (1) Cerebral energy metabolism involves the hydrolysis of glucose via glycolysis and the utilization of its end-product, pyruvate, as the substrate of the mitochondrial TCA cycle and the electron transport chain, where oxygen is its final receptor; (2) cerebral tissue activation requires a significant increase in ATP production, which drives an increase in the consumption of both glucose and oxygen. These two assumptions do not allow for the possibility that another substrate beside glucose could participate in the metabolic process that supports cerebral activity. Obviously, they could not envision measuring the cerebral metabolic rate of lactate (CMRlac). Re-evaluation of the studies such as those of Fox et al. and Hyder et al., through the lens of the glycolysis paradigm shift, should make the idea of lactate being a major mitochondrial substrate that provides the necessary energy for the activated cerebral tissue more palatable. Simultaneously, one could strongly argue against the idea that glycolysis alone can provide the energy needs of activated cerebral tissue. After all, glycolysis is [glucose → 2 lactate + 2ATP], while mitochondrial oxidative metabolism of lactate is [lactate → pyruvate → TCA cycle + 3O2 → 3CO2 + 3H2O + 17ATP] and consequently, CMRO2/CMRlac = 3.
Conclusion
Pursuing the biochemical basis of the active brain is an endeavor that has been the mission of physicians, neuroscientists, biochemists and physiologists for decades. Many techniques and methodologies were employed in scientific studies during those years, attempting to simultaneously measure cerebral activity and the consumption of the main substrates of the biochemical processes supporting that activity. Both humans and animals have been the subjects in those studies and in general the consumption of the two substrates of respiration, glucose and oxygen, has been followed. Cerebral activity has been usually induced by a stimulus, electric, sensory, motoric etc., the response to which has been recorded by measuring substrates consumption, and in some cases, concomitantly employing EEG or recording of action potentials. The basic tenet that glucose (glycolysis) + 2ADP + 2Pi → 2 ATP + 2 pyruvate → TCA cycle (mitochondrial) → electron transport chain + 6O2 + 34 ADP + 34 Pi → 6 CO2 + 6 H2O + 34 ATP (oxidative phosphorylation) has always been considered by investigators as the most important biochemical process that supplies the energy needed for cerebral activity. A study by Fox et al. (1988) stirred much confusion by claiming that cerebral activation is supported by non-oxidative energy metabolism; glucose (glycolysis) + 2 ADP + 2 Pi → 2 lactate + 2ATP. Since this process occurs in the presence of oxygen, which remained unused, they named it ‘aerobic glycolysis,’ although the term is indistinguishable from the term given to the process glucose (glycolysis) + 2 ADP + 2 Pi → 2 ATP + 2 pyruvate, a terminology that only added to the confusion. It is argued here that Fox et al. were misled in their conclusion since they based their oxygen consumption estimates using indirect measurement of oxygen consumption. With the increased recognition of lactate as an oxidative substrate of the mitochondrial TCA cycle it has become clear that the cerebral activity requires all the energy mitochondrial oxidative phosphorylation can provide and that a large portion of it could be supplied by lactate, a process that produced CMRO2/CMRlac = 3. However, if the CMRlac is not measured, and only CMRgluc does, the interpretation of the results of studies using that measurement could be askew. Direct measurements of O2, glucose and lactate, employing rapid response microsensors in vivo revealed that there is enough oxygen in the activated tissue outside the vasculature, such that measurement of either CBF or deoxyhemoglobin (BOLD fMRI) does not reflect an accurate measure of oxygen consumption. Moreover, these investigators demonstrated that lactate is the preferred oxidative substrate over glucose, supporting our own findings and the ANLS hypothesis of Pellerin and Magistretti. Therefore, until there is a more direct method to measure oxygen consumption in humans, such as the measurement of CO2 production, along with concurrent measurements of both glucose and lactate consumption, the picture of the energy metabolism of the activated brain will remain imprecise and uncertain.
Conflicts of Interest Statement
The author has no conflicts of interest to declare.
Funding Statement
No specific funding was received for the work discussed in this manuscript.
Acknowledgments
The author wishes to thank Paige Hessel for her invaluable editorial critique during the preparation of this manuscript.
References
- Brooks GA. Lactate: glycolytic end product and oxidative substrate during sustained exercise in mammals—the “lactate shuttle”. In Circulation, respiration, and metabolism: current comparative approaches (pp. 208-218). Berlin, Heidelberg: Springer Berlin Heidelberg, 1985.
- Schurr A, West CA, Rigor BM. (1988). Lactate-supported synaptic function in the rat hippocampal slice preparation. Science. 1988;240(4857):1326-1328. doi:10.1126/science.33758.
- Gladden LB. Lactate metabolism: a new paradigm for the third millennium. The Journal of physiology. 2004;558(1):5-30. doi.org/10.1113/jphysiol.2003.058701.
- Gladden LB. 200th anniversary of lactate research in muscle. Exercise and sport sciences reviews. 2008;36(3):109-115. doi:10.1097/JES.0b013e31817c0038.
- Schurr A. Lactate: the ultimate cerebral oxidative energy substrate? Journal of Cerebral Blood Flow & Metabolism, 2006;26(1):142-152. doi.org/10.1038/sj.jcbfm.9600174.
- Schurr A. Cerebral glycolysis: a century of persistent misunderstanding and misconception. Frontiers in neuroscience. 2014;8:360. doi.org/10.3389/fnins.2014.00360.
- Rogatzki MJ, Ferguson BS, Goodwin ML, Gladden LB. Lactate is always the end product of glycolysis. Frontiers in neuroscience 2015;9:22. doi.org/10.3389/fnins.2015.00022.
- Brooks GA. (2020). Lactate as a fulcrum of metabolism. Redox biology 2020;35:101454. doi.org/10.1016/j.redox.2020.101454.
- Krebs HA, Johnson WA. Acetopyruvic acid (αγ-diketovaleric acid) as an intermediate metabolite in animal tissues. Biochemical Journal. 1937;31(5):772-779. doi:10.1042/bj0310772.
- Holmes BE, Holmes EG. Contributions to the Study of Brain Metabolism: Carbohydrate Metabolism. (Preliminary Paper). Biochemical Journal. 1925;19(3):492-499. doi:10.1042/bj0190492.
- Holmes EG, Holmes BE. Contributions to the Study of Brain Metabolism: Carbohydrate Metabolism. Biochemical Journal. 1925;19(5):836-839. doi:10.1042/bj0190836.
- Holmes EG, Holmes BE. Contributions to the study of brain metabolism: carbohydrate metabolism relationship of glycogen and lactic acid. Biochemical Journal. 1926;20(6):1196-1203. doi:10.1042/bj0201196.
- Holmes BE, Holmes EG. Contributions to the Study of Brain Metabolism. IV: Carbohydrate Metabolism of the Brain Tissue of Depancreatised Cats. Biochemical Journal. 2027;21(2):412-418. doi:10.1042/bj0210412.
- Ashford CA, Holmes EG. Contributions to the study of brain metabolism: Rôle of phosphates in lactic acid production. Biochemical Journal. 1929;23(4):748-759. doi:10.1042/bj0230748.
- Holmes EG, Ashford CA. Lactic acid oxidation in brain with reference to the “Meyerhof cycle.”. Biochemical Journal. 1930;24(4):1119-1127. doi:10.1042/bj0241119.
- Holmes EG. Oxidations in central and peripheral nervous tissue. Biochemical Journal. 1930;24(4):914-925. doi:10.1042/bj0240914.
- Quastel JH, Wheatley AHM. Oxidations by the brain. Biochemical Journal. 1932;26(3):725-744. doi:10.1042/bj0260725.
- Holmes EG. The relation between carbohydrate metabolism and the function of the grey matter of the central nervous system. Biochemical Journal. 1933;27(2), 523-536.
- Fox PT, Raichle ME, Mintun MA, Dence C. Nonoxidative glucose consumption during focal physiologic neural activity. Science. 1988;241(4864):462-464. doi:10.1126/science.3260686.
- Pellerin L, Magistretti PJ. Glutamate uptake into astrocytes stimulates aerobic glycolysis: a mechanism coupling neuronal activity to glucose utilization. Proceedings of the National Academy of Sciences. 1994;91(22), 10625-10629. doi.org/10.1073/pnas.91.22.10625.
- Theriault JE, Shaffer C, Dienel GA, Sander CY, Hooker JM, Dickerson BC, Barrett LF, Quigley KS. A functional account of stimulation-based aerobic glycolysis and its role in interpreting BOLD signal intensity increases in neuroimaging experiments. Neurosci. Behav. Rev. 2023;153:105373. doi.org/10.1016/j.neubiorev.2023.105373.
- Schurr A. How the ‘Aerobic/Anaerobic Glycolysis’ Meme Formed a ‘Habit of Mind’ Which Impedes Progress in the Field of Brain Energy Metabolism. International Journal of Molecular Sciences. 2024;25(3):1433. doi.org/10.3390/ijms25031433.
- Schurr A. Glycolysis Paradigm Shift Dictates a Reevaluation of Glucose and Oxygen Metabolic Rates of Activated Neural Tissue. Front. Neurosci. 2018;12:700. doi:10.3389/fnins.2018.00700.
- Hyder F, Rothman DL, Mason GF, Rangarajan A, Behar KL, Shulman RG. Oxidative glucose metabolism in rat brain during single forepaw stimulation: a spatially localized 1H [13C] nuclear magnetic resonance study. Journal of Cerebral Blood Flow & Metabolism. 1997;17(10):1040-1047. doi.org/10.1097/00004647-199710000-00005.
- Madsen PL, Cruz NF, Sokoloff L, Dienel GA. Cerebral Oxygen/Glucose Ratio is Low during Sensory Stimulation and Rises above Normal during Recovery: Excess Glucose Consumption during Stimulation is Not Accounted for by Lactate Efflux from or Accumulation in Brain Tissue. Journal of Cerebral Blood Flow & Metabolism. 1999;19(4):393-400. doi:10.1097/00004647-199904000-00005.
- Fujita H, Kuwabara H, Reutens DC, Gjedde A. Oxygen Consumption of Cerebral Cortex Fails to Increase during Continued Vibrotactile Stimulation. Journal of Cerebral Blood Flow & Metabolism. 1999;19(3):266-271. doi:10.1097/00004647-199903000-00004.
- Shulman, Robert G., Fahmeed Hyder, and Douglas L. Rothman. “Lactate efflux and the neuroenergetic basis of brain function.” NMR in Biomedicine: An International Journal Devoted to the Development and Application of Magnetic Resonance In Vivo. 2001;14(7‐8):389-396. doi:10.1002/nbm.741.
- Aubert A, Costalat R. A Model of the Coupling between Brain Electrical Activity, Metabolism, and Hemodynamics: Application to the Interpretation of Functional Neuroimaging NeuroImage. 2002;17:1162-1181. doi.org/10.1006/nimg.2002.1224.
- Kastrup A, Krüger G, Neumann-Haefelin T, Glover GH, Moseley ME. Changes of Cerebral Blood Flow, Oxygenation, and Oxidative Metabolism during Graded Motor Activation. NeuroImage. 2002;15:74-82. doi.org/10.1006/nimg.2001.0916.
- Zhu X-H, Zhang N, Zhang Y, Uğurbil K, Chen W. New Insights into Central Roles of Cerebral Oxygen Metabolism in the Resting and Stimulus-Evoked Brain. Journal of Cerebral Blood Flow & Metabolism. 2009;29:10-18 doi.org/10.1038/jcbfm.2008.97.
- Vafaee MS, Vang K, Bergersen LH, Gjedde A. Oxygen Consumption and Blood Flow Coupling in Human Motor Cortex during Intense Finger Tapping: Implication for a Role of Lactate. Journal of Cerebral Blood Flow & Metabolism. 2012;32(10):1859-1868. doi:10.1038/jcbfm.2012.89.
- Hyder F, Fulbright RK, Shulman RG, Rothman DL. Glutamatergic Function in the Resting Awake Human Brain is Supported by Uniformly High Oxidative Energy. Journal of Cerebral Blood Flow & Metabolism. 2013;33(3):339-347. doi:10.1038/jcbfm.2012.207.
- Hyder F, Herman P, Bailey C J, Møller A, Globinsky R Fulbright, RK, Rothman DL, Gjedde A. Uniform distributions of glucose oxidation and oxygen extraction in gray matter of normal human brain: no evidence of regional differences of aerobic glycolysis. Journal of Cerebral Blood Flow & Metabolism. 2016;36(5):903-916. doi.org/10.1177/0271678X15625349.
- Bose A, Epp SM, Belenya R, Kurcyus K, Domingue, EC, Ranft A, Villa ES, Bursche M, Preibisch C, Castrillón G, Riedl V. Simultaneous quantification of oxygen and glucose consumption during visual stimulation in the human cortex. bioRxiv. 2024;2024-10. doi.org/10.1101/2024.10.11.617828.
- Toronov V, Walker S, Gupta R, Choi JH, Gratton E, Hueber D, Webb A. The roles of changes in deoxyhemoglobin concentration and regional cerebral blood volume in the fMRI BOLD signal. Neuroimage. 2003;19(4):1521-1531. doi.org/10.1016/S1053-8119(03)00152-6.
- Ekstrom, A. How and when the fMRI BOLD signal relates to underlying neural activity: the danger in dissociation. Brain research reviews. 2010;62(2):233-244. doi.org/10.1016/j.brainresrev.2009.12.004.
- Hillman, E. MCoupling mechanism and significance of the BOLD signal: a status report. Annual review of neuroscience. 2014;37(1):161-181. doi.org/10.1146/annurev-neuro-071013-014111.
- Goense J, Bohraus Y, Logothetis NK. fMRI at high spatial resolution: implications for BOLD models. Frontiers in computational neuroscience. 2016;10:66. doi.org/10.3389/fncom.2016.00066.
- Laumann TO, Snyder AZ, Mitra A, Gordon EM, Gratton C, Adeyemo B, Gilmore AW, Nelson SM, Berg JJ, Greene DJ, McCarthy JE, Tagliazucchi E, Laufs H, Schlaggar BL, Dosenbach NUF, Petersen SE. On the Stability of BOLD fMRI Correlations. Cerebral Cortex. 2017;27(10):4719-4732. doi.org/10.1093/cercor/bhw265.
- Roumes H, Jollé C, Blanc J Benkhaled I, Chatain CP, Massot P, Raffard G, Bouchaud V, Biran M, Pythoud C, Deglone N, Zimmer ER, Pellerin, L, Bouzier-Sore, AK. Lactate transporters in the rat barrel cortex sustain whisker-dependent BOLD fMRI signal and behavioral performance. Proceedings of the National Academy of Sciences. 2021;118(47):e2112466118. doi.org/10.1073/pnas.2112466118.
- Hu Y, Wilson GS. A temporary local energy pool coupled to neuronal activity: fluctuations of extracellular lactate levels in rat brain monitored with rapid‐response enzyme‐based sensor. Journal of neurochemistry. 1997;69(4):1484-1490. doi.org/10.1046/j.1471-4159.1997.69041484.x.
- Schurr A, Gozal E. Aerobic production and utilization of lactate satisfy increased energy demands upon neuronal activation in hippocampal slices and provide neuroprotection against oxidative stress. Front. Pharmacol. 2012;2:96. doi:10.3389/fphar.2011.00096.