


Indoor Air Pollution and Respiratory Health in Bangladesh
Indoor Air Pollution and Respiratory Symptoms among Residents in Urban and Rural Community
Lamiya Tasnim Niloy¹, Irin Hossain²
- Research Fellow, National Institute of Preventive and Social Medicine (NIPSOM), Dhaka
- Assistant Professor, Department of Occupational and Environmental Health, National Institute of Preventive and Social Medicine (NIPSOM), Dhaka
OPEN ACCESS
PUBLISHED: 31 May 2025
CITATION: Niloy, LT., and Hossain, I., 2025. Indoor Air Pollution and Respiratory Symptoms among Residents in Urban and Rural Community. Medical Research Archives, [online] 13(5).
https://doi.org/10.18103/mra.v13i5.6305
COPYRIGHT: © 2025 European Society of Medicine. This is an open-access article distributed under the terms of the Creative Commons Attribution License, which permits unrestricted use, distribution, and reproduction in any medium, provided the original author and source are credited
DOI https://doi.org/10.18103/mra.v13i5.6305
ISSN 2375-1924
Abstract
Background: Indoor air pollution poses a significant public health issue linked to respiratory symptoms and diseases. This study aimed to assess indoor particulate matter levels and related respiratory symptoms with functional impairments affecting residents in urban and rural areas.
Methods: This cross-sectional comparative study was conducted from January to December 2023 and included 422 participants – half from rural Moricha Union in Birganj Upazila, Dinajpur District, and half from urban Kafrul Thana, Dhaka District, Bangladesh. Data was collected using a semi-structured questionnaire, a checklist, and a portable digital PM detector. Study areas were selected through multistage sampling, while participants were chosen using simple random sampling.
Results: Most participants were female, with 32.75% from urban & 36.75% from rural areas. The largest age group was 30-39 years (39.8%). Education varied significantly: 23.0% of urban participants held a graduate degree, while 29.6% of rural participants were illiterate. Urban incomes were higher, with 17.3% earning 30,001-40,000 taka, compared to 29.4% of rural participants earning up to 10,000 taka. Housing conditions varied, with 49.8% of urban participants living in pukka houses, while 40.3% of rural participants resided in tin-shed buildings. Urban areas predominantly used gas cookers (47.9%), while rural areas relied on clay ovens (49.3%) and biomass fuel (48.8%). Urban kitchens had better ventilation, with 46% having adequate airflow and 42.4% with exhaust fans, while 44.5% of rural areas cooked outdoors. Inadequate air quality for PM2.5 and PM10 was reported by 80.3% and 82.0% of participants, respectively. Respiratory symptoms were more common in rural areas (37.8%), including cough (9.7%), breathlessness (10.7%) & chest tightness (7.8%). Functional impairments were also more frequent among rural participants: urban participants showed 3.3% mild, 6.2% moderate, and 3.8% severe impairment, compared to 12.8% mild, 6.6% moderate, and 7.1% severe impairment in rural areas. Logistic regression revealed significant associations between respiratory symptoms and PM2.5 and PM10 exposure.
Conclusion: Indoor air pollution significantly impacts respiratory health in both urban and rural areas of Bangladesh, making it essential to urgently adopt cleaner cooking methods and improve ventilation.
Keywords
Indoor air pollution, Respiratory symptoms, Functional impairment, Particulate matter
Introduction
Air pollution is a critical environmental and public health issue, with both outdoor and indoor sources contributing to severe health consequences. While outdoor air pollution is widely recognized due to emissions from industries and transportation, indoor air pollution (IAP) remains an often-overlooked but equally significant health threat. People spend nearly 90% of their time indoors – at home, work, or other enclosed environments, where air pollutant concentrations can be 2-5 times higher than outdoor levels and, in extreme cases, over 100 times higher.
Indoor air pollution originates from multiple sources, including cooking, heating, smoking, the use of consumer products, and emissions from building materials. Common indoor air pollutants include particulate matter (PM2.5 and PM10), carbon monoxide (CO), volatile organic compounds (VOCs), sulfur dioxide (SO₂), nitrogen oxides (NOₓ), and biological contaminants. In developing countries like Bangladesh, IAP is primarily caused by the widespread use of biomass fuels (wood, dung, agricultural residues), kerosene, and liquefied petroleum gas (LPG) for cooking and heating. Nearly 80% of households in Bangladesh rely on traditional biomass fuels, leading to high indoor pollution levels. Studies from India, China, Pakistan, Nepal, and Cameroon have also demonstrated that household combustion of biomass fuels significantly increases PM2.5 and PM10 levels. Women and children, who spend more time in cooking areas, face the highest exposure to harmful air pollutants.
IAP is associated with serious health consequences, including respiratory illnesses such as chronic cough, wheezing, breathlessness, chest tightness, and an increased risk of chronic obstructive pulmonary disease (COPD). Long-term exposure can lead to functional impairments, reducing individuals’ ability to perform daily activities and increasing the likelihood of hospitalization. The World Health Organization (WHO) estimates that indoor air pollution contributes to approximately 4.3 million deaths annually, with 1.7 million occurring in the South-East Asian region alone.
A study conducted in the Jashore region of Bangladesh focused solely on measuring the PM10 levels among poor families. The study considered cooking locations, construction materials, ventilation practices, and fuel usage. However, no data was collected regarding PM2.5, VOC, CO2, CO, or other prevalent indoor pollutants in urban or suburban communities. For effective control of IAQ, therefore, it is necessary to determine the sources of air pollution.
This study aims to assess indoor air quality and its impact on respiratory symptoms and functional impairments among residents of urban and rural communities in Bangladesh. A comparative analysis between urban and rural areas will help to identify disparities in exposure levels, kitchen configurations, fuel usage, and ventilation practices. By examining key environmental and socioeconomic factors – including fuel types, ventilation conditions, kitchen locations, and housing structures – this study seeks to provide evidence-based insights for policies to improve indoor air quality and reduce indoor air pollution’s adverse health effects.
Method
STUDY DESIGN AND PARTICIPANTS
This cross-sectional comparative study was conducted from January to December 2023 among residents of Moricha Union in Birganj Upazila, Dinajpur District, Bangladesh, representing the rural area, and Kafrul Thana in Dhaka District, Bangladesh, representing the urban area. The study sample consisted of adult individuals residing in these specific areas. Adults with known chronic conditions that may impair lung function, such as heart disease, childhood asthma, chronic bronchitis, tuberculosis, malignancy, or any other physician-diagnosed respiratory disease, as well as those with a history of acute respiratory illness or any cardiac, thoracic, or abdominal surgery within the last three months, were excluded from the study.
STUDY AREA, SAMPLE SIZE AND SAMPLING
The study utilized multi-stage sampling techniques. Rangpur and Dhaka divisions were selected by simple random sampling among eight divisions of Bangladesh for rural and urban areas, respectively. Then Dinajpur & Dhaka district was selected purposively. Moricha union under Birganj Upazila and Kafrul Thana was selected by simple random sampling among them. Households were chosen from certain regions utilizing the simple random sampling technique. If no participants were found in the house based on the selection criteria indicated above, then the next house with individuals meeting the same criteria was chosen for this study.
Since the largest calculated sample size was 384, an additional 10% was added to account for non-respondents, resulting in a final sample size of 422. This sample was equally distributed, with 211 participants from urban and rural areas.
DATA COLLECTION
A semi-structured questionnaire was used to collect data. The questionnaire was created and modified from the American Thoracic Society- Division of Lung Disease (ATS-DLD-78) questionnaire. The questionnaire contained questions related to:
- Respondent’s particulars
- Screening tools
- Socio-demographic profile
- Possible causes and remedies to reduce indoor air pollution
- Respiratory symptoms related questions (cough, phlegm, wheezing, sneezing, breathlessness, chest tightness)
- Functional impairment-related questions – Questions related to difficulties with work, managing domestic responsibilities or social life, need to visit a physician, taking rest or sick leave based on physician advice.
A portable PM detector was used to assess particulate matter levels in the cooking & living areas of households. The questionnaire was finalized after necessary modification according to the findings of pretesting. After the collection of whole data, they were processed and tabulated. The turbulent data was analyzed and described according to the aims and objectives of the study using SPSS version 27. The rest of the statistics used to analyze the data was a logistic regression test. The results were presented in the form of tables and graphs.
MEASUREMENTS
Functional impairment was divided into three categories: mild, moderate, and severe. These categories were marked 1 for yes and 0 for no. Participants with respiratory symptoms responded positively to questions regarding difficulties with work or managing domestic responsibilities or hampering social life, which were considered mild functional impairments. Moderate functional impairment was indicated by positive responses to questions regarding visitation to physicians by mildly impaired participants. Moderate functional impairment participants who answered yes to the question about the doctor’s advice for sick leave and bed rest were considered severe.
Results
The study revealed that among the 422 participants, the majority of the respondents were female, with 32.75% residing in urban areas and 36.75% in rural areas. The highest proportion of participants (approximately 18.5% in urban areas and 21.3% in rural areas), 39.8%, fell within the 30-39 years age category. In urban areas, 23.0% held a graduate, while 29.6% of rural participants were illiterate or signature only. Urban areas had the highest proportion of participants (17.3%) with a monthly family income of 30,001-40,000 taka, whereas the majority (29.4%) in rural areas earned up to 10,000 taka. Housewives were the largest group in both regions (23.9% urban, 30.8% rural), followed by service holders (15.9%) in urban areas and farmers (7.15%) in rural areas. More than half of the participants belonged to nuclear families, with 41.2% residing in urban areas and 32.5% in rural areas. Most families comprised 4-6 members, with 31.5% in urban areas and 30.5% in rural areas. Regarding housing, 49.8% of urban participants lived in pukka houses, while 40.3% lived in tin-shed buildings in rural areas. Smoking history was reported by 5.9% of urban participants and 8.1% of rural participants. The socio-demographic characteristics of the respondents are portrayed in Table 1.
| Variable | Category | Urban (%) | Rural (%) |
|---|---|---|---|
| Gender | Male | 73 (17.3) | 56 (13.3) |
| Female | 138 (32.7) | 155(36.7) | |
| Age | <20 | 3 (0.7) | 18 (4.3) |
| 20-29 | 28 (6.6) | 24 (5.7) | |
| 30-39 | 78 (18.5) | 90 (21.3) | |
| 40-49 | 51 (12.1) | 32 (7.6) | |
| 50-59 | 32 (7.6) | 31 (7.3) | |
| >=60 | 19 (4.5) | 16 (3.8) | |
| Religion | Muslim | 207 (49.1) | 193(45.7) |
| Hindu | 4 (0.9) | 18 (4.3) | |
| Marital status | Single | 13 (3.1) | 10 (2.4) |
| Married | 190 (45.0) | 169 (40.0) | |
| Widowed | 7 (1.7) | 28 (6.6) | |
| Divorce | 1 (0.2) | 4 (0.9) | |
| Educational Qualification | Illiterate | 0 (0.0) | 125 (29.6) |
| Primary | 2 (0.5) | 65 (15.4) | |
| Secondary | 0 (0.0) | 11 (2.6) | |
| Higher secondary | 34 (8.1) | 5 (1.2) | |
| Graduate | 97 (23.0) | 5 (1.2) | |
| Post-graduate | 78 (18.5) | 0 (0.0) | |
| Occupation | Unemployed | 7 (1.7) | 3 (0.7) |
| Housewife | 101 (23.9) | 130 (30.8) | |
| Student | 11 (2.6) | 3 (0.7) | |
| Service holder | 67 (15.9) | 4 (0.9) | |
| Businessman | 19 (4.5) | 4 (0.9) | |
| Farmer | 0 (0.0) | 30 (7.1) | |
| Rickshaw puller | 6 (1.4) | 6 (1.4) | |
| Day labor | 0 (0.0) | 23 (5.5) | |
| Shopkeeper | 0 (0.0) | 8 (1.9) | |
| Income category | 1-10000 | 0 (0.0) | 124 (29.4) |
| 10001-220000 | 8 (1.9) | 85 (20.1) | |
| 20001-30000 | 17 (4.1) | 2 (0.5) | |
| 30001-40000 | 73 (17.3) | 0 (0.0) | |
| 40001-50000 | 56 (13.2) | 0 (0.0) | |
| >=50001 | 57 (13.5) | 0 (0.0) | |
| Family Members | 1-3 | 68 (16.2) | 40 (9.5) |
| 4-6 | 133 (31.5) | 129 (30.5) | |
| >=7 | 10 (2.3) | 42 (10) | |
| Family type | Nuclear | 174 (41.2) | 137 (32.5) |
| Joint | 37 (8.8) | 74 (17.5) | |
| House type | Tin-shed | 0 (0.0) | 170 (40.3) |
| Semi-pakka | 1 (0.2) | 37 (8.8) | |
| Pakka | 210 (49.8) | 4 (0.9) | |
| Living residence | <=10 | 193 (45.7) | 92 (21.8) |
| >10 | 18 (4.3) | 119 (28.2) | |
| Smoking habit | No | 186 (44.1) | 177 (41.6) |
| Yes | 25 (5.9) | 34 (8.1) |
The possible causes of indoor air pollution under study are given in Table 2. Among the respondents, gas cookers were prevalent in urban areas (47.9%), while clay ovens were commonly used in rural areas (49.3%). Notably, no respondents in urban areas use kerosene stoves or clay ovens. Other sources of indoor air pollution included furniture (50%), perfume/personal care products (49.85%), aerosol (28.9%) for urban areas and pets (47.6%), and mosquito coils (42.7%) for rural areas.
| Causes | Urban (%) | Rural (%) |
|---|---|---|
| Electric cooker | 78 (18.5) | 17 (4.0) |
| Gas cooker | 202 (47.9) | 24 (5.7) |
| Kerosene cooker | 0 (0.0) | 0 (0.0) |
| Clay oven | 0 (0.0) | 208 (49.3) |
| Mosquito coil | 88 (20.9) | 180 (42.7) |
| Incense and candles | 2 (0.5) | 73 (17.3) |
| Air fresheners/aerosol | 122 (28.9) | 0 (0.0) |
| Carpets | 112 (26.5) | 0 (0.0) |
| Insecticide | 1 (0.2) | 56 (13.3) |
| Perfume /personal care products | 210 (49.8) | 9 (2.1) |
| Cleaning products | 185 (43.8) | 0 (0.0) |
| Furniture | 211 (50.0) | 31 (7.3) |
| Pets | 15 (3.6) | 201 (47.6) |
Table 3 represents possible remedies to reduce indoor air pollution. Almost all of the respondents from urban areas used to avoid dust/smoke (45.7%) and used an air exhaust fan or chimney in the kitchen (42.4%), whereas less than 1/5th of the rural respondents reported doing these activities. In rural areas, most people (48.3%) preferred mosquito nets, whereas only 28.4% of urban regions reported the same.
| Remedies | Urban (%) | Rural (%) |
|---|---|---|
| Leaving the cooking area after putting out fire | 180 (42.7) | 87 (20.6) |
| Leaving room using mosquito coil/aerosol | 183 (43.4) | 62 (14.7) |
| Changing from mosquito coil to net | 120 (28.4) | 204 (48.3) |
| Avoiding dust/smoke | 193 (45.7) | 37 (8.8) |
| Ensure good ventilation | 194 (46.0) | 147 (34.8) |
| Using an air exhaust fan or chimney in the kitchen | 179 (42.4) | 26 (6.2) |
| Using netted window | 98 (23.2) | 0 (0.0) |
| Indoor plants in the home | 68 (16.1) | 0 (0.0) |
All urban dwellings had a separate kitchen, while 44.5% of rural households had an outdoor cooking area, 4.7% cooked without partitions, and only 0.7% had a separate kitchen. Urban kitchens commonly featured brick walls and roofs (50.0%) and tile floors (49.1%), while rural kitchens often had bamboo or thatch walls (26.1%), mud flooring (44.8%), and tin roofs (15.2%). Urban areas relied on LPG (47.2%), whereas rural areas predominantly used biomass fuel (48.8%). Cross ventilation was better in urban settings (37.0%) compared to rural areas (31.8%). The factors associated with indoor air pollution and respiratory symptoms highlight significant differences between urban and rural households, presented in Table 4.
| Variables | Category | Urban (%) | Rural (%) |
|---|---|---|---|
| Location of cooking area | Outdoor House | 0(0.0) | 188 (44.5) |
| Without partition | 0 (0.0) | 20 (4.7) | |
| Separate kitchen | 211 (50.0) | 3 (0.7) | |
| Kitchen roof | No roof | 0 (0.0) | 11 (2.6) |
| Bamboo/ thatch | 0 (0.0) | 133 (31.5) | |
| Tin | 0 (0.0) | 64 (15.2) | |
| Brick | 211 (50.0) | 3 (0.7) | |
| Kitchen wall | No wall | 0 (0.0) | 73 (17.3) |
| Bamboo/ thatch | 0 (0.0) | 110 (26.1) | |
| Tin | 0 (0.0) | 17 (4.0) | |
| Brick | 211 (50.0) | 11 (2.6) | |
| Kitchen floor | Mud | 0 (0.0) | 189 (44.8) |
| Concrete | 4 (0.9) | 22 (5.2) | |
| Tile | 207 (49.1) | 0 (0.0) | |
| Fuel | Biomass fuel | 0 (0.0) | 206 (48.8) |
| LPG gas | 199 (47.2) | 1 (0.2) | |
| Electricity | 12 (2.8) | 4 (0.9) | |
| Cross-ventilation | Yes | 55 (13.0) | 77 (18.2) |
| No | 156 (37.0) | 134 (31.8) |
The prevalence of respiratory symptoms was lower in urban areas compared to rural areas. Among urban residents, the reported symptoms included cough (2.8%), phlegm (0.2%), sneezing (7.3%), breathlessness (4.0%), and chest tightness (0.9%). In contrast, rural residents exhibited higher rates of respiratory symptoms, with cough (9.7%), phlegm (1.9%), sneezing (4.3%), breathlessness (10.7%), and chest tightness (7.8%). Overall, 18.5% of individuals in urban areas and 37.8% in rural areas experienced at least one respiratory symptom. The impact of these symptoms on daily life was more significant in rural communities. Among affected individuals in urban areas, 19.3% reported work difficulties, 5.0% faced challenges in maintaining domestic responsibilities, 2.5% experienced disruptions in social life, 25.3% sought medical attention, and 16.3% were advised to rest or take sick leave. The burden was more significant in rural areas, with 41.2% reporting work difficulties, 25.2% struggling with domestic responsibilities, 12.6% experiencing social disruptions, 33.7% seeking medical care, and 30.6% advised to rest or take sick leave due to respiratory symptoms.
After adjusting for relevant variables, functional impairment was analyzed and presented in Table 5. The findings indicate that rural residents experienced higher levels of functional impairment compared to their urban counterparts. Mild functional impairment was reported by 3.3% of urban and 12.8% of rural residents, while moderate functional impairment was observed in 6.2% and 6.6%, respectively. Severe functional impairment affected 3.8% of urban residents and 7.1% of those in rural areas.
| Category of functional impairment | Urban (%) | Rural (%) |
|---|---|---|
| No functional impairment | 11 (5.2) | 24 (11.3) |
| Mild functional impairment | 7 (3.3) | 27 (12.8) |
| Moderate functional impairment | 13 (6.2) | 14 (6.6) |
| Severe functional impairment | 8 (3.8) | 15 (7.1) |
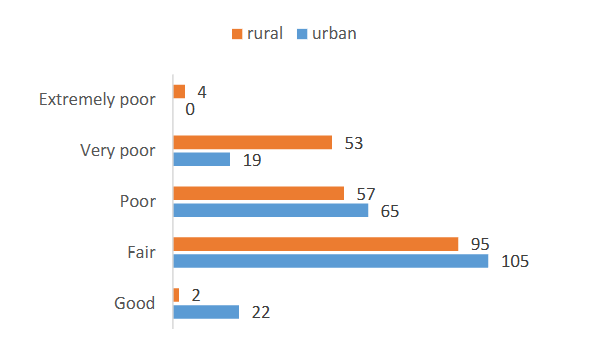
Among the 422 participants, 236 (55.5%) reported experiencing “Poor” indoor air quality, while an additional 81 (19.2%) indicated “very poor” air quality. The cumulative percentage of participants whose air quality was categorized as “Poor” or worse reached 80.3%. In contrast, only a small percentage, 7 participants (1.7%), reported “Good” air quality and 98 participants (23%) reported “fair” indoor air quality.

Logistic regression analysis was performed to examine the association between respiratory symptoms and particulate matter (PM2.5) levels in both living and cooking areas. The parameter estimates identified multiple significant findings.
| Parameter Estimates | PM 2.5 average category | B | Std. Error | Wald | df | Sig. | Exp(B) | 95% Confidence Interval for Exp(B) | Lower Bound | Upper Bound |
|---|---|---|---|---|---|---|---|---|---|---|
| Intercept | -16.937 | 18984.079 | .000 | 1 | .999 | |||||
| suffering from cough=No | 14.963 | 3056.071 | .000 | 1 | .996 | 3148786.969 | .000 | |||
| suffering from cough=Yes | 0 | . | . | 0 | . | . | . | . | . | . |
| usually bring phlegm with cough=No | -10.494 | .000 | . | 1 | . | 2.770E-5 | 2.770E-5 | 2.770E-5 | ||
| usually bring phlegm with cough=Yes | 0 | . | . | 0 | . | . | . | . | . | . |
| chest ever sound wheezy =No | -3.495 | 16472.814 | .000 | 1 | 1.000 | .030 | . | . | ||
| chest ever sound wheezy =Yes | -4.239 | 17616.079 | .000 | 1 | 1.000 | .014 | . | . | . | |
| suffering from sneezing= Yes | 0 | . | . | 0 | . | . | . | . | . | . |
| suffering from runny nose during sneezing=No | 14.826 | 2595.958 | .000 | 1 | .995 | 2748197.306 | .000 | . | ||
| suffering from runny nose during sneezing=Yes | 0 | . | . | 0 | . | . | . | . | . | . |
| feel tightness on chest =No | -.454 | 9662.573 | .000 | 1 | 1.000 | .635 | . | . | . | |
| feel tightness on chest =Yes | 0 | . | . | 0 | . | . | . | . | . | . |
Table 7 presents the correlation between respiratory symptoms and particulate matter (PM10) levels in living and kitchen areas. The logistic regression analysis indicates a significant association, highlighting the impact of PM10 exposure on respiratory health.
| Parameter Estimates | PM 10 average category | B | Std. Error | Wald | df | Sig. | Exp(B) | 95% Confidence Interval for Exp(B) | Lower Bound | Upper Bound |
|---|---|---|---|---|---|---|---|---|---|---|
| Intercept | 1.001 | 8671.042 | .000 | 1 | 1.000 | |||||
| suffering from cough=No | 15.285 | 1057.943 | .000 | 1 | .988 | 4346907.439 | .000 | |||
| suffering from cough=Yes | 0 | . | . | 0 | . | . | . | . | . | . |
| usually bring phlegm with cough=No | 4.359 | .000 | . | 1 | . | 78.158 | 78.158 | . | ||
| usually bring phlegm with cough=Yes | 0 | . | . | 0 | . | . | . | . | . | . |
| chest ever sound wheezy=No | -19.263 | 8204.535 | .000 | 1 | 1.000 | 4.307E-9 | . | . | ||
| chest ever sound wheezy=Yes | -32.610 | 8404.085 | .000 | 1 | 1.000 | 6.883E-15 | . | . | . | |
| suffering from sneezing=Yes | 0 | . | . | 0 | . | . | . | . | . | . |
| suffering from runny nose during sneezing=No | -0.860 | 1.242 | .480 | 1 | .489 | .423 | .037 | 4.824 | ||
| suffering from runny nose during sneezing=Yes | 0 | . | . | 0 | . | . | . | . | . | . |
| feel tightness on chest=No | -1.239 | 2998.635 | .000 | 1 | 1.000 | .290 | . | . | . | |
| feel tightness on chest=Yes | 0 | . | . | 0 | . | . | . | . | . | . |
Discussion
Indoor air pollution (IAP) remains a significant environmental and public health concern, particularly in low- and middle-income countries where biomass fuel use, inadequate ventilation, and household products contribute to poor indoor air quality (IAQ). This study investigated the relationship between IAP and respiratory symptoms among urban and rural residents in Bangladesh.
The study identified notable differences in indoor pollution sources between urban and rural households. In rural areas, biomass fuel use (48.8%) was the primary contributor to IAP, with 49.3% of households using clay ovens in poorly ventilated environments. These findings are consistent with a study conducted in Uganda, where 94.7% of households relied on biomass fuels, leading to elevated PM2.5 exposure levels. Similarly, a study in Cameroon found that 94% of rural households depended on firewood as their primary fuel source, while peri-urban households utilized a mix of LPG, wood, and kerosene. Additionally, a study in India reported PM10 concentrations ranging from 500 to 2000 µg/m³ during biofuel combustion, comparable to the high PM2.5 and PM10 levels observed in this study.
In contrast, urban households had lower biomass fuel dependence, with 47.2% using LPG and 2.8% using electric cookers. However, other sources of indoor pollution were prevalent, including mosquito coils (20.9%), air fresheners (28.9%), cleaning agents (43.8%), and furniture (50.0%), all of which contribute to the emission of volatile organic compounds (VOCs). Studies have shown that these household products significantly impact IAQ, particularly in enclosed urban environments with limited ventilation. A study conducted in Bangladesh also demonstrated that urban homes often have higher VOC levels due to emissions from consumer products and building materials. Additionally, a study in Uganda found that 32.7% of urban households cooked indoors, increasing exposure to indoor air pollutants even in settings with lower biomass fuel usage.
Household structure and ventilation also played a crucial role in IAQ differences. In urban areas, 42.4% of households had kitchen exhaust fans, and 46.0% ensured adequate airflow. In contrast, 44.5% of rural households cooked outdoors, but indoor cooking areas often lacked proper ventilation. Studies indicate that cross-ventilation, exhaust systems, and designated cooking spaces significantly reduce IAP levels.
The prevalence of respiratory symptoms, including cough (9.7%), breathlessness (10.7%), and chest tightness (7.8%), was notably higher among rural residents. These findings align with previous studies, showing that individuals exposed to biomass combustion are at greater risk of developing respiratory diseases. A study in Uganda further demonstrated a strong association between PM2.5 exposure and cough prevalence (PR = 3.75, 95% CI 1.15–1.55). However, some studies, such as Wafula et al., found no direct correlation between IAP and acute respiratory infections, suggesting that factors such as household ventilation, socioeconomic conditions, and individual susceptibility may contribute to health outcomes.
While respiratory symptoms were less prevalent in urban areas, exposure to chemical pollutants from air fresheners, mosquito coils, and household cleaners was associated with an increased risk of asthma and other respiratory conditions, particularly among children and older adults.
The current study also assessed the impact of IAP on functional impairments, revealing that respiratory symptoms significantly affected daily activities, particularly in rural areas. Individuals exposed to higher levels of indoor air pollutants experienced limitations in their ability to perform routine tasks, engage in work, and participate in social activities. These findings align with research by Eidsto et al., which reported that 23.1% of participants experienced IAP-related symptoms, leading to moderate to severe functional impairments. Additionally, limited access to healthcare in rural areas may exacerbate the burden of respiratory diseases, contributing to delayed diagnosis and treatment.
Conclusion
This cross-sectional comparative study examined indoor air pollution and respiratory symptoms with functional impairment among urban and rural areas, revealing profound disparities in household practices, environmental exposures, and health outcomes. These disparities led to varying rates of respiratory symptoms, notably higher in rural regions, reflecting lifestyle impacts on health. The study emphasizes tailored interventions for each community to improve Bangladesh’s indoor air quality and respiratory health.
Limitations
This study focused on PM2.5 and PM10, excluding other pollutants like CO, CO₂, and VOCs, limiting the comprehensiveness of indoor air quality assessment. Self-reported respiratory symptoms may have introduced recall bias, and the study’s geographic scope, limited to one urban and one rural area, affects generalizability. Additionally, seasonal variations were not considered, which could influence exposure levels and health outcomes.
Recommendations
Planners and policymakers should implement the required measures to enhance indoor air quality in both urban and rural areas. Conduct educational programmes focused around raising awareness about indoor air quality in both communities. Promote the adoption of more environmentally friendly cooking fuels such as LPG gas or electricity, particularly in rural communities that heavily depend on biomass. Ensure the availability of healthcare services that can be easily reached, specifically for respiratory health, in both urban and rural regions.
Ethical Approval
The objectives and importance of the study were explained to all participants prior to recruitment. Participation in the study was voluntary. The confidentiality of the participants was maintained, and written informed consent was obtained from all participants. The study was approved by the Institutional Review Board (IRB) of the National Institute of Preventive and Social Medicine (NIPSOM) and obtained an ethical clearance waiver from the same source. The code of approval was NIPSOM/IRB/2023/06.
Acknowledgements
We would like to thank the study participants for their contributions. We also thank the concerned personnel who gave us the opportunities and support to conduct this study smoothly.
References
- Abulude FO, Fagbayide SD, Akinnusotu A, Makinde OE, Elisha JJ. Assessment of the indoor air quality of Akure, South-West Nigeria. Qual Life (Banja Luka) – APEIRON. 2019;17(1–2). doi:10.7251/qol1901015a
- Van Tran V, Park D, Lee YC. Indoor air pollution, related human diseases, and recent trends in the control and improvement of indoor air quality. Int J Environ Res Public Health. 2020;17(8):2927. doi:10.3390/ijerph17082927
- Akteruzzaman M, Rahman MA, Rabbi FM, et al. The impacts of cooking and indoor air quality assessment in the southwestern region of Bangladesh. Heliyon. 2023;9(1):e12852. doi:10.1016/j.heliyon.2023.e12852
- Sk Akhtar A. Indoor air pollutants and respiratory problems among Dhaka city dwellers. Arch Community Med Public Health. 2016;2(1):32-36. doi:10.17352/2455-5479.000014
- Begum BA, Paul SK, Dildar Hossain M, Biswas SK, Hopke PK. Indoor air pollution from particulate matter emissions in different households in rural areas of Bangladesh. Build Environ. 2009;44(5):898-903. doi:10.1016/j.buildenv.2008.06.005
- Shubhankar B, Ambade B. A critical comparative study of indoor air pollution from household cooking fuels and its effect on health. Orient J Chem. 2016;32(1):473-480. doi:10.13005/ojc/320154
- Esong MB, Goura AP, Mbatchou BHN, et al. Distribution of sources of household air pollution: a cross-sectional study in Cameroon. BMC Public Health. 2021;21(1):10350. doi:10.1186/s12889-021-10350-6
- Musyoka D, Muindi K. A descriptive assessment of household air pollution in rural kitchens in Kenya. Atmosphere. 2015;13(1):1-12.
- Azad SMY. Indoor air pollution and prevalence of acute respiratory infection among children in rural areas of Bangladesh. J Biol Agric Healthc. 2014;4(2):2224-3208.
- Weaver AM. Air pollution dispersion from biomass stoves to neighboring homes in Mirpur. BMC Public Health. 2019;19(1):6751. doi:10.1186/s12889-019-6751
- Aigbokhaode AQ, Isara AR. Household air pollution and respiratory symptoms of women and children in a suburban community in Nigeria. Turk Thorac J. 2021;22(6):466-472. doi:10.5152/turkthoracj.2021.21013
- Wafula ST, Nalugya A, Mendoza H, et al. Indoor air pollutants and respiratory outcomes among residents of an informal urban setting in Uganda: a cross-sectional study. bioRxiv. 2022. doi:10.1101/2022.07.28.22278151
- Amegah AK, Jaakkola JJK. Household air pollution and the sustainable development goals. Bull World Health Organ. 2016;94(3):215-221. doi:10.2471/blt.15.155812
- Khalequzzaman M. Indoor air pollution and health of children in biomass fuel-using households of Bangladesh: comparison between urban and rural areas. Environ Health Prev Med. 2011;16:375-383. doi:10.1007/s12199-011-0208-6
- Khalequzzaman M, Kamijima M, Sakai K, Hoque BA, Nakajima T. Indoor air pollution and the health of children in biomass- and fossil-fuel users of Bangladesh: situation in two different seasons. Environ Health Prev Med. 2010;15(4):236-243. doi:10.1007/s12199-009-0133-6
- Dasgupta S, Huq M, Khaliquzzaman M, Pandey K, Wheeler D. Indoor air quality for poor families: new evidence from Bangladesh. Indoor Air. 2006;16(6):426-444. doi:10.1111/j.1600-0668.2006.00436.x
- Vongxay V, Chapman RS, Siriwong W. Respiratory symptoms in relation to household air pollution sources in rural and urban areas of Vientiane Capital, Lao PDR. J Health Res. 2012;26(1):1-8.
- Eidstø E, Selinheimo S, Lampi J, Salmela A, Pekkanen J. The continuum of severity of functional impairment due to indoor air symptoms: prevalence and determinants. J Occup Environ Med. 2023;65(9):717-724. doi:10.1097/jom.0000000000002884
- Bruce N, Perez-Padilla R, Albalak R. Indoor air pollution in developing countries: a major environmental and public health challenge. Bull World Health Organ. 2000;78(9):1078-1092.
- Balakrishnan K, Ramaswamy P, Sambandam S, et al. Air pollution from household solid fuel combustion in India: an overview of exposure and health-related information to inform health research priorities. Glob Health Action. 2011;4(1):5638. doi:10.3402/gha.v4i0.5638
- Balmes JR. Household air pollution from domestic combustion of solid fuels and health. J Allergy Clin Immunol. 2019;143(6):1979-1987. doi:10.1016/j.jaci.2019.04.016
- Singh AL, Aligarh SJ, Pradesh U. A comparative analysis of indoor air pollution due to domestic fuel used in rural and urban households: a case study. Trans Inst Indian Geogr. 2013;35(2):287-298.
- WHO guidelines for indoor air quality: selected pollutants. World Health Organization. 2010. Accessed December 23, 2023. https://www.who.int/publications/i/item/9789289002134
- Ingale TL. A comparative study on exposure to indoor air pollution among the urban, sub-urban, and rural populations of Jalgaon district. Environ Sci. 2009;4(6):430-437.
- Afolabi OT, Oladapo O, Olugbenga A. Awareness of indoor air pollution and prevalence of respiratory symptoms in an urban community in South West Nigeria. Niger J Health Sci. 2016;16(1):33-39. doi:10.4103/1596-4078.190036
- Ahmed S, Rana J, Sultana T, et al. Personal exposure to household air pollution and lung function in rural Bangladesh: a population-based cross-sectional study. Int J Environ Health Res. 2022:1-13. doi:10.1080/09603123.2022.2150150
- Colbeck I, Nasir ZA, Ali Z. Indoor air quality at rural and urban sites in Pakistan. Water Air Soil Pollut Focus. 2008;8(1):61-69. doi:10.1007/s11267-007-9139-5
- Khan MN. Household air pollution from cooking and risk of adverse health and birth outcomes in Bangladesh: a nationwide population-based study. Environ Health. 2017;16:57.
- Kulshreshtha P, Khare M. A comparative study of indoor air pollution and its respiratory impacts in Delhi, India. In: Air Pollution XVIII. Southampton, UK: WIT Press; 2010.
- Mestl HES, Aunan K, Seip HM, Wang S, Zhao Y, Zhang D. Urban and rural exposure to indoor air pollution from domestic biomass and coal burning across China. Sci Total Environ. 2007;377(1):12-26. doi:10.1016/j.scitotenv.2007.01.087
- Perez-Padilla R, Schilmann A, Riojas-Rodriguez H. Respiratory health effects of indoor air pollution. Int J Tuberc Lung Dis. 2010;14(9):1079-1086.
- Zhang J, Smith KR. Indoor air pollution: a global health concern. Br Med Bull. 2003;68(1):209-225. doi:10.1093/bmb/ldg029
- Unni B, Nair R, Lim Y, et al. Community knowledge, attitude and behavior towards indoor air quality: a national cross-sectional study in Singapore. Environ Sci Policy. 2022;136:348-356. doi:10.1016/j.envsci.2022.06.021
- Slezakova K, Morais S, Carmo Pereira M. Indoor air pollutants: relevant aspects and health impacts. In: Environmental Health – Emerging Issues and Practice. InTech; 2012.
- Ranabhat CL, Kim CB, Kim CS, et al. Consequence of indoor air pollution in rural areas of Nepal: a simplified measurement approach. Front Public Health. 2015;3:5. doi:10.3389/fpubh.2015.00005
- Rohra H, Taneja A. Indoor air quality scenario in India—An outline of household fuel combustion. Atmos Environ (Oxf). 2016;129:243-255. doi:10.1016/j.atmosenv.2016.01.038
- Mishra V. Indoor air pollution from biomass combustion and acute respiratory illness in preschool-age children in Zimbabwe. Int J Epidemiol. 2003;32:847-853.