


Ineffective COVID-19 Policies: A Simulation Analysis
Faulty predictions by computer simulation may have promoted ineffective public health policies during COVID-19
Introduction
I. A RESTRICTED WORLD.
The early response to COVID-19 paralyzed most countries by closing national borders, schools, restaurants, theaters, places of worship, social and sport gatherings, and halted normal human life by confining healthy individuals in their homes, distancing them from each other, and mandating the use of face masks, before quickly-rushed experimental vaccines were available. Collectively, these restrictive mandates were imposed for the first time in human history in a global scale without a precise idea of their potential consequences.
Remarkably, these measures did not halt COVID-19; rather, the pandemic progressed at a sustained rate despite reports of 1.7 billion under some form of indoor confinement from March 26, 2020, that increased to 3.9 billion people by the first week of April 2020 which amounts to more than half of the world’s population in quarantine or in-house lock-downs¹-².
In order to understand why governments mandated the most restrictive public health measures ever taken by society this study asked “what was new in COVID-19 that resulted in such unique and drastic health policies”. The initial goal of this article was to provide an answer to what was special about SARS-Co V-2 that promoted the most restrictive health measures in history. The follow up question to be answered was whether the public health measures elicited largely by the predictions made by computer simulation were effective. Responding to these questions resulted in unexpected findings regarding the effectiveness of lock-downs and curfews, use of face masks, mandating social distancing and ordering massive vaccination campaigns.
II. NOTHING NEW.
The world has witnessed many epidemics in the past³. Other coronaviruses like SARS and MERS produced pandemics that started in 2002 and 2012, respectively⁴-⁵; and viruses in this family cause 15% – 20% of all upper respiratory infections in humans, even in the absence of epidemics⁶.
Several other viruses, like those of relevance in biodefense (with mortality rates of 40% for Lassa virus and 53% to 92% for the Sudan and Zaire strains of Ebola virus, respectively)⁷ cause higher mortality than SARS-CoV-2⁸.
Just as with COVID-19’s Chinese origin, many epidemics started in China before, with similarly obscured facts behind those pandemics.
That the U.S.A. National Institutes (U.S. NIH) funded research of dubious human benefit like coronavirus gain of function (intended to make viruses that infect only animals able to infect also humans) in Wuhan, China (were COVID-19 started) is not new either⁹-¹¹. The U.S. NIH had previously funded sequencing and de novo synthesis of the virus that had caused the 1918 influenza pandemic that killed 50 million persons¹². By use of the then-new approach of viral “reverse genetics,” these viral RNA sequences of the virus obtained by PCR of 1918 tissues permitted eventual reconstruction of the complete deadly 1918 influenza virus¹³-¹⁴. Therefore, U.S. NIH funding of risky coronavirus research is not new nor extraordinary. Gaining of function (becoming able of infecting humans) in coronaviruses that naturally infect only animals, as well as resurrecting an extremely deadly influenza virus from the past, produced in both U.S. NIH funded programs a knowledge whose use can only result in genocide.
III. ORDINARY CHARACTERISTICS.
Chinese scientists suggested early in the pandemic that SARS-Co V-2 could be more contagious than influenza¹⁵-¹⁶. However, SARS-CoV-2 mortality rate reported in official databases appeared not dramatically different than that of yearly influenza⁸. In addition, our early research article indicating that SARS-Co V-2 hardiness was ordinary, with the coronavirus being 3-fold more sensitive to sunlight inactivation¹⁷.
The data in Figure 1 indicates the times to inactivate SARS-Co V-2 at selected locations of the world at different dates of the year. These inactivation times demonstrate that the virus should not be inactivated within the short time periods that can remain aerosolized outside infected hosts during person-to-person transmission, the only way of transmission that could be prevented by lock downs and quarantines, face mask wearing and social distancing.
Figure 1. Sensitivity of SARS-Co V-2 to sunlight.
Calculated maximum¹ virucidal (254-nm equivalent²) UV flux for two hour period around solar noon for selected major world cities at specified times of year.
Effective times estimated for inactivation of SARS-CoV-2 virus.
| City | Latitude | Summer Solstice | Equinox Spring/Fall | Winter Solstice |
|---|---|---|---|---|
| Central and South America | ||||
| Bogota, Colombia | 4.6°N | 0.64/11+ | 0.64/11+ | 0.64/11 |
| Mexico City, Mexico | 19.5°N | 0.64/11+ | 0.62/11 | 0.31/22+ |
| São Paulo, Brazil | 23.3°S | 0.55/14+ | 0.40/17+ | 0.17/84 |
| Buenos Aires, Argentina | 34.6°S | 0.37/19+ | 0.17/41 | 0.04/172 |
| Europe | ||||
| Barcelona, Spain | 41.4°N | 0.31/22+ | 0.10/69 | 0.01/>300 |
| Paris, France | 48.9°N | 0.25/28+ | 0.05/138 | 0.00/>300 |
| London, UK | 51.5°N | 0.23/30 | 0.04/173 | 0.00/>300 |
| Moscow, Russia | 55.7°N | 0.20/34 | 0.03/230 | 0.00/>300 |
| Middle East | ||||
| Baghdad, Iraq | 33.3°N | 0.39/18+ | 0.19/36 | 0.05/138 |
| Tehran, Iran | 35.7°N | 0.36/19+ | 0.16/43 | 0.04/172 |
| Istanbul, Turkey | 41.0°N | 0.31/22+ | 0.10/69 | 0.02/>300 |
| Africa | ||||
| Kinshasa, Congo | 4.3°S | 0.64/11+ | 0.64/11+ | 0.64/11+ |
| Lagos, Nigeria | 6.4°N | 0.64/11+ | 0.64/11+ | 0.64/11+ |
| Khartum, Sudan | 15.6°N | 0.64/11+ | 0.64/11+ | 0.32/22+ |
| Cairo, Egypt | 30.0°N | 0.43/16+ | 0.25/28+ | 0.08/86 |
| Asia | ||||
| Mumbai (Bombay), India | 19.0°N | 0.64/11+ | 0.62/11+ | 0.32/22+ |
| Shanghai, China | 31.2°N | 0.42/16+ | 0.22/31 | 0.07/99 |
| Seoul, Republic of Korea | 33.5°N | 0.38/18+ | 0.19/36 | 0.05/138 |
| Tokyo, Japan | 35.7°N | 0.36/20+ | 0.16/43 | 0.04/172 |
| Australia | ||||
| Sydney, Australia | 33.9°S | 0.38/18+ | 0.18/38 | 0.05/138 |
- Maximum solar exposure with no clouds, haze, air pollution or shadows to reduce exposure, independent of site elevation.
- Obtained using the virus inactivation action spectrum normalized to unity at 254nm.
- Maximum daily solar UVB fluence values for the selected locations at specific times of year have been reported in a previous article of the author on predicted influenza inactivation by solar UVB. 35% of the total daily UVB fluence divided by 120 minutes yields the noontime UVB flux in J/m²/min at the locations and times in Tables 2 and 3.
- The UVB fluence to inactivate SARS-CoV-2 90% (10% survival) was estimated as 6.9 J/m².
- Under ideal conditions, solar UV could inactivate SARS-CoV-2 99% (1% survival) during a 2-hour period around solar noon. Four times the D90 was chosen to account for the likely physical inactivation due to protective elements surrounding the virus.
- Underlined values indicate solar UVB is likely not enough to inactivate SARS-CoV-2 90% (10% survival) during a 2 hour period around solar noon.
- Flux values above 0.62 are likely underestimates. Therefore, the time for 90% and 99% inactivation in these cases are possibly overestimates.
IV. EARLY RESPONSE.
Research data reported early in the pandemic, demonstrating that many characteristics like mortality and environmental hardiness of SARS-Co V-2 were neither new nor remarkable, prescribed a moderate response. For example, early on, the U.K. had almost no social-isolation measures in place, and according to some reports, the government planned to let the virus run its course through the population, with the exception of the elderly, who were to be kept indoors¹⁸. The idea was to let enough people get naturally infected and recover from the mild version of the disease, to create “herd immunity”, a process well known and described in most texts of immunology and epidemiology¹⁹-²⁰.
V. APOCALYPTIC PREDICTIONS.
Unfortunately, health policy changed swiftly after predictive computer modeling of COVID-19 reported by the WHO Collaborating Centre for Infectious Disease Modeling, of the prestigious Imperial College of London, projected 7 billion infections worldwide and 40 million deaths during 2020 alone²¹. The institution’s reports also projected that without drastic interventions, more than half a million Britons would die from COVID-19 in 2020 with more than 2 million deaths in the United States, again barring interventions²². The predictions were broadly disseminated by the press without scientific evaluation. Some of the news headlines quickly read: “Without implementing strategies like lock-downs to reduce the spread of the novel coronavirus, there would be 7 billion infections and 40 million deaths in 2020 alone, according to a report published Thursday from researchers at the Imperial College of London”²³. This article in the Business Insider stated “that the report from the Imperial College has not been published nor peer-reviewed”. The lack of peer review and the absence of independent confirmation must have been disregarded by the health advisors of many countries in view of the weight and prestige carried by the institution involved. The stark predicted numbers prompted the UK and many other countries to change course, shutting down public life and ordering the population to stay at home.
VI. IGNORING CRITICS OF VIRTUAL MODELLING.
Lock-down of healthy individuals was swiftly mandated by 165 governments²⁴ in panic despite several articles quickly criticizing policy-making based on computer modeling. Some of the critical articles had titles like: “Don’t Believe the COVID-19 Models. That’s not what they’re for”¹⁸, another “Influential Covid-19 model uses flawed methods and shouldn’t guide U.S. policies, critics say”²⁵, and yet another entitled “Meet the Covid Models That Are Running the World”²⁶ analyzed the profound limitations of computer modeling. These articles, as well as any other critics to the predictions from the Imperial College, were equally disregarded by policy-makers around the world. It is clear that the overestimation (7 billion infections and 40 million deaths in 2020 alone) reported by the Imperial College in London was instrumental in policy decision-making because the model predicted far fewer deaths if lock-down measures — measures such as those taken by the British and other governments — were undertaken²⁷-²⁸.
Epidemiologist Neil Ferguson, who created the highly-cited Imperial College London coronavirus model, retracted and downgraded the predictions soon after release of the report²⁸, but the cat was already out of the bag. Sensationalism by some sections of the press and the institutional prestige of the Imperial College had convinced many countries to ignore warnings about policy making based on computer modeling, disregarding often input from their own national scientists, and rushed to enact 1168 emergency laws confining healthy individuals to their homes²⁴. The result in many countries was no work, no classes, no visits to sick parents, no celebration of children’s birthdays, no weddings or funerals, and massive economic and social collapse. All this social and economic catastrophe resulted mainly by panic produced by a few individuals playing simulation epidemiology computer games and presenting their apocalyptic conclusions in a non-peer reviewed report. Therefore, a main difference between COVID-19 and previous pandemics was the drastic actions taken by many countries of the world in no small part due to the dramatic predictions that came from a prestigious institution.
VII. REALITY.
Even the most pessimistic data gathered by agencies responsible for the restrictive measures imposed during the pandemic are in stark disagreement with virtual predictions²¹-²².
According to the World Health Organization (WHO), the official death toll of the pandemic by December 31, 2020 was 1,813,188²⁹. Thus, the Imperial College prediction of 40 million deaths during 2020 is over 20-fold off even if every death ascribed to the COVID-19 would have been actually caused by SARS-CoV-2 (which is unlikely as discussed below). Worst off are the virtual predictions when compared to reported deaths during the whole pandemic.
The number of global infections and deaths attributed to COVID-19 by the Johns Hopkins Coronaviruses Research Center at the ending of tracking the pandemic on 10 of march 2023 was 676,609,955 infections and 6,881,955 deaths³⁰. These numbers indicate that the virus most likely infected a large proportion of the world population as others virus regularly do without them being so widely tested. Unique during COVID-19 was defining as a “case” any positive test result, even in absence of clinical symptoms. Considering the figures at the end of the pandemic yields a mortality rate around 1% but the likely overestimation of COVID-19 deaths is discussed in a section below.
Effect of Resulting Public Health Measures
I. MANDATED LOCKDOWNS.
It is frequently argued that without quarantine and lock-downs of healthy individuals, the pandemic would have been worse. The hypothesis may sound reasonable but if true, then there should be a significant difference between the infection rate (infections per million inhabitants) and death rate (the percent of deaths per infections) in countries with quarantine and lock-downs versus countries that did not mandate lock-downs. This was not the case as demonstrated by analyzing the freely available statistics from Johns Hopkins’s Center for Systems Science and Engineering⁸. An early research article of us compared the epidemiological data for a dozen countries in Europe, half a dozen countries in Latin America, and half a dozen countries in central and east Asia³¹, whose governments decided not to lock-down healthy citizen³² with an equal number of other countries in each continent whose governments imposed strict restrictive measures and the comparative data is presented in Figure 2. Unexpectedly, the statistical analysis demonstrated no difference (statistical significance level p < 0.01) in the number of infection rates (infections per million inhabitants), infection mortality rates (deaths per infection × 100), or population mortality rates (deaths per million inhabitants) between countries that instituted early long-lasting nation-wide stay-at-home orders versus countries that did not³¹.
Figure 2. b. Progression of COVID-19 in countries that did NOT impose lock-downs.
| Region | Country | 29 MAY | 21 JULY | 7 SEPT | 26 OCT | 14 DEC |
|---|---|---|---|---|---|---|
| Europe | ||||||
| Belarus | 4314 (0.5%) [74] | 7140 (0.3%) [54] | 7759 (1.5%) [76] | 8918 (1.3%) [101] | 17,166 (0.6%) [136] | |
| Sweden | 8814 (11.6%) | 7737 (7.3%) [305] | 9856 (5.7%) [584] | 10,929 (5.4%) [586] | 31,607 (2.3%) [742] | |
| Latvia | 505 (2.7%) [13] | 696 (2.3%) [16] | 750 (2.4%) [18] | 1251 (1.9%) [23] | 13,730 (1.4%) [153] | |
| Estonia | 1430 (3.8%) [54] | 1888 (3.4%) [55] | 1948 (2.7%) [53] | 3408 (1.8%) [86] | 16,174 (1.4%) [148] | |
| Lithuania | 816 (4.1%) [55] | 741 (4.2%) [52] | 1748 (2.6%) [63] | 4051 (1.3%) [150] | 36,877 (0.4%) [408] | |
| Latin America | ||||||
| Mexico | 978 (11.1%) [71] | 2762 (11.3%) [199] | 4008 (10.7%) [255] | 6988 (10.0%) [394] | 9650 (9.1%) [880] | |
| Uruguay | 234 (1.7%) [2] | 315 (1.3%) [9] | 463 (2.7%) [13] | 880 (1.9%) [19] | 1790 (0.8%) [58] | |
| Nicaragua | 115 (4.3%) [5] | 619 (4.3%) [16] | 703 (3.0%) [31] | 817 (1.9%) [39] | 984 (2.8%) [54] | |
| Asia | ||||||
| Indonesia | 90 (6.0%) [5] | 536 (4.3%) [26] | 710 (4.1%) [30] | 1428 (3.4%) [50] | 3268 (3.0%) [80] | |
| Japan | 139 (5.0%) [2] | 394 (3.5%) [8] | 591 (1.9%) [11] | 778 (1.5%) [14] | 1438 (1.4%) [20] | |
| South Korea | 228 (2.4%) [5] | 328 (3.1%) [8] | 416 (1.6%) [17] | 603 (1.8%) [20] | 948 (1.3%) [11] | |
| Africa | ||||||
| Namibia | 8 (0%) [0] | 537 (0.4%) [4] | 3456 (1.4%) [36] | 4980 (1.0%) [50] | 6530 (1.0%) [64] |
*Infections attributed to COVID-19 per million inhabitants (infection rate) calculated utilizing the 2019 world population data is the first number in each cell, deaths per infections × 100 (infection mortality rate in parenthesis) from different countries were considered in this study. The deaths per million inhabitants (population mortality rate) were also included in this analysis. Countries and territories that did not mandate lock-downs can be freely downloaded from world-wide-web; and a summary of countries with- and without lock-downs was also published elsewhere.*³²
Although this research article completed in 2020 presented findings that could have been capitalized early in the pandemic, the work was initially rejected by several leading scientific journals in the U.S.A. not on scientific grounds but instead, for contradicting government measures and for “promoting social disobedience” (rejection letters on file). This article was later peer-reviewed and published in a European scientific journal, becoming available in August 2021, still early enough for consideration in policy making if data-based decisions during the pandemic would have been desired.
In any case, a cursory inspection of freely available statistical data during 2020 among “unlocked” countries and countries that mandated lock-downs³² would have shown that imposing quarantine by assuming apocalyptic consequences was going to be a blunder of global proportions. Similar to other types of predictions (end-of-the-world, astrological, etc.), predictions made by computer simulation are cited and only remembered if they happened to be correct. In contrast, predictions on COVID-19 made by virtual simulation appear to have been rather consistently wrong.
II. DIFFERENTIAL MORTALITY BETWEEN DEVELOPED AND DEVELOPING COUNTRIES.
In contrast with considerable increases observed in infections rate, the mortality rate in each country was relatively constant (Figure 2). This observation suggests that the mortality resulting from COVID-19 is independent from seasonal sunlight and instead, large disparity of mortality for the same virus among different countries depends on the national health care system and variations in patients’ management.
COVID-19 infection mortality rates in developing countries of South America (11 of the largest countries) were considerably lower than in several (at least 8) developed European countries (Figure 2). For example, in mid-2020, mortality rate among every major developing country in South America (those countries shown in Figure 2 reporting mortality rates of 1-5%, plus Colombia 3.2%, Brazil 3.1%, Paraguay 1.9%, and Venezuela 0.8%) was considerably lower than the mortality rate reported in France (15.9%), Belgium (15.3%), UK (14.5%), Italy (14.3%), Hungary (13.7%), Sweden (11.9%), Netherlands (11.8%), and Spain (9.1%)⁸. These findings seem at odds with the considerable differences in health expenditures, number of intensive care beds and number of ventilators between developed European countries and developing countries of South America³³-³⁴.
However, the extensive national health infrastructures made possible a considerably higher number of hospitalizations in developed European countries than in South American countries. It could be speculated that higher mortality rates after infection by the same virus could be the result of increased hospitalization, intubation, and other invasive procedures in developed countries, providing higher chances for nosocomial infections and deaths caused by germs commonly found in the hospital setting³⁵-³⁶ but reported as COVID-19 deaths during the crisis. This hypothesis seems reasonable since according to the European Center for Disease Control and Prevention, a total of 8.9 million healthcare-associated infections were estimated to occur each year before the pandemics in European hospitals and long-term care facilities³⁷. Protocols mandating massive intubation and connection to respirators of patients infected with SARS-Co V-2 should have sky rocketed the potential for infection with common hospital pathogens. Thus, it can be considered that higher rate of hospitalization (afforded by a large number of hospital beds, respirators and more developed infrastructure) of patients weakened by COVID-19 could be followed by nosocomial infections leading to death at the higher frequency observed in European developed countries than in developing countries of South America (see Figure 2).
III. OVERESTIMATION.
Deaths actually produced by common hospital pathogens and government incentives for care of COVID-19 patients in some countries could have inflated the mortality of SARS-Co V-2. The key question however, is by how much.
Developing countries must have had also some deaths attributed to COVID-19 actually caused by common hospital pathogens but in lower proportion than in developed countries due to lower number of hospital beds and ventilators in the countries with less national resources. The data in Figure 2 indicates that at some stages of the pandemic there could have been a five-fold excess of the mortality rate reported in developed European countries listed in the previous section where mortality rates averaged 13.3 ± 2.2 % (average ± standard deviation, n = 8) over developing countries of South America where mortality rates averaged 2.6 ± 1.2 % (n = 9). If this difference in mortality rate between countries with larger, more developed health infrastructure versus countries with limited ability to hospitalize patients is due to reporting as COVID-19 deaths actually caused by nosocomial infections; then, the actual number of patients dying by SARS-Co V-2 could have been close to one-fifth (as calculated from the countries averages) to perhaps one-quarter (augmenting the number by some deaths actually caused by SARS-Co V-2 in some compromised patients). Thus, considering 6.8 million as the total deaths officially attributed to COVID-19³⁰, the number of deaths caused by COVID-19 corrected by deaths caused by hospital pathogens after aggressive intubation and ventilation or by other diseases reported as COVID-19 could be assumed to be between 1.4 million to 1.7 million from the beginning of the pandemic to its official end in 2023. Subtracting them from the total, these figures indicate that several million people could have died as a result of aggressive and unnecessary public health policies and not due to coronavirus disease. Furthermore, these estimates do not include the increased number of suicides by unnecessary isolation or deaths by other diseases not cared during the pandemic. For comparison, these staggering numbers of deaths that could be associated to public health policies and medical malpractice during the pandemic are larger than the number of murders registered in the official records of Nazi extermination camps as archived in the Dokumentation Obersalzberg, World War II Memorial and Educational Center in Berchtesgaden, Germany (personal observation, 2010).
The actual cause of death of patient hospitalized with a COVID-19 diagnose could be established by performing a relatively low number of autopsies and PCR testing of tissues. Analysis of tissues from only 390 victims attributed to COVID-19 would establish, according to established statistical sampling principles³⁸, the true cause of death with a 5% margin of error and 95% confidence, considering a population of 6.8 million, as the total number of deaths³⁰˒³⁹.
IV. ADDITIONAL MEASURES.
Direct (person-to-person) transmission was shown to be important in transmission of SARS-CoV-2 between nearby individuals⁴⁰. Together with quarantines and lockdowns, the additional non-medical measures intended to control the pandemic were social distancing (6 feet or 2 meters) and face masks. The lack of an increase in COVID-19 infections after a gathering of one-quarter million people in close proximity and limited wearing of face masks as illustrated in Figure 3, discarded any beneficial effect of social distancing and of mask wearing during the pandemic⁴¹. The data demonstrates in Panel A that large crowds gathered in Argentina to the funeral of soccer star Diego Maradona on November 26-27, 2020, where only 46 ± 5% wear face masks (Main Panel of Figure 3) did not result in any increase in infections as depicted in Panel B⁴¹.
Similar results were obtained less than a year later also in Argentina on July 10, 2021 were several people spontaneously gathered to celebrate the national team’s victory of the soccer World Cup. In these popular celebrations 84 ± 7% of the participants did not wear face masks. Again, COVID-19 infections remained largely unchanged from weeks before- to weeks after-the massive event⁴¹. Similar observations on social distancing could have been made before any statistical data became available by considering previous studies indicating that infectious micro droplets can reach distances of 12.5 meters (over 40 feet)⁴², making the generally imposed social distancing of 2 meters (6 feet) inconsequential in infection control.
Figure 3: Funeral of soccer star Diego Maradona in Buenos Aires, Argentina
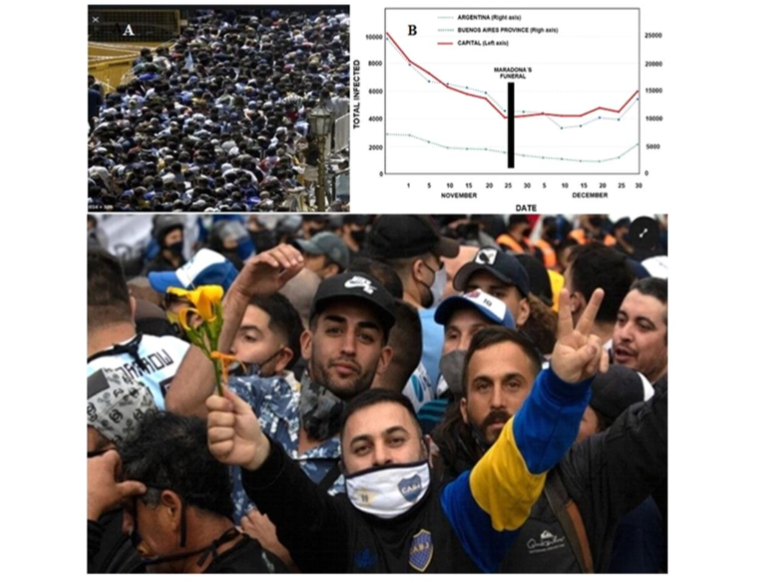
Footnote: The main panel depicts mourners waiting to pay respects in front of the casket. Insert A shows an elevated view of the crowd along a city block. Insert B presents the number of COVID-19 daily infections reported by government sources in the capital city of Buenos Aires (red line), its provincial suburbs (green line) or corresponding national figures (blue line).
The lack of a protective effect of relatively inexpensive cloth face masks can be understood by considering that the M50 series military mask (officially known as the US-Joint Service General Protective Mask) used previously by the author (JLS) required exact face fitting, extensive testing for air leaking, and cost $250 excluding research and development⁴³-⁴⁴. In contrast to the considerable effort (ongoing since the First World War) to protect military personnel from germs and toxins, the choice of cloth face masks, loosely fitted and costing less than a dollar, should have been expected to have a nil protective effect as we previously reported⁴¹.
In addition to lock downs, face masks and social distancing, vaccination campaigns with a variety of experimental vaccines of different origin also failed in controlling the pandemic, at least as demonstrated by official data available from several South American countries⁴⁵.
V. VACCINATION IN SELECTED COUNTRIES OF SOUTH AMERICA.
Figure 4: Vaccines administered by selected countries in South America
| Country | Vaccines | Starting Date | Reference |
|---|---|---|---|
| ARGENTINA | Astra-Zeneca (UK), Covishield (India), Moderna (USA), Sinopharm (China), Sputnik V (Russia) | 12/29/2020 | 22 |
| BOLIVIA | Astra-Zeneca (UK), Janssen J&J (USA), Pfizer-Biontech (USA-Germany), Sinopharm (China), Sputnik V (Russia) | 04/28/2021 | 23 |
| BRAZIL | Astra-Zeneca (UK), Coronavac-Sinovac (China), Janssen J&J (USA), Pfizer-Biontech (USA-Germany) | 01/18/2021 | 24 |
| CHILE | Astra-Zeneca (UK), Coronavac-Sinovac (China), Pfizer-Biontech (USA-Germany) | 12/24/2020 | 25 |
| PARAGUAY | Astra-Zeneca (UK), Coronavac-Sinovac (China), Covaxin (India), Moderna (USA), Pfizer-Biontech (USA-Germany), Sinopharm (China), Sputnik V (Russia) | 03/19/2021 | 26 |
| URUGUAY | Pfizer-Biontech (USA-Germany), Sinovac (China) | 01/03/2021 | 27 |
The variety of vaccines employed in the South American countries listed in Figure 4 resulted in the data compiled in Figure 5. The data demonstrates that massive and costly vaccination campaigns did not prevent COVID-19 infections in the South American countries analyzed, since infectivity and mortality remained not statistically different before, during vaccination, nor after over 42 to 76% of the countries’ population had received at least two doses of the vaccines (Figure 5).
Figure 5. Effect of Vaccination Campaigns in selected countries of South America
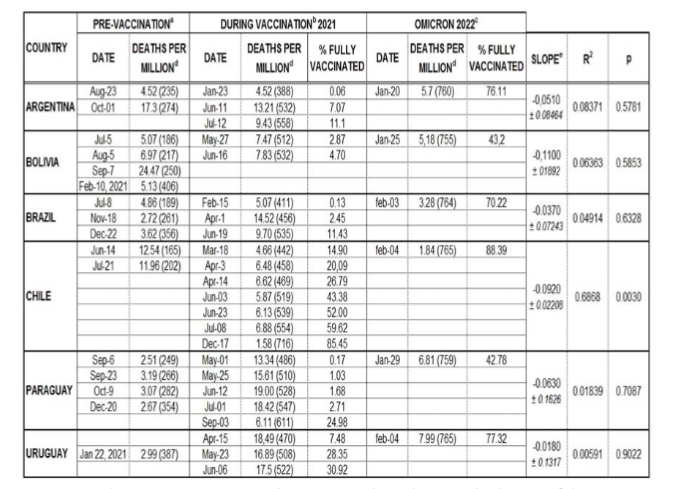
Footnote:
a. Peak figures corresponding to pre-vaccination;
b. Corresponds to the partial advance of the vaccination campaign and c. to a more advanced stage of the vaccination campaign.
The 7-day rolling average of new daily deaths per million inhabitants is shown with the days after January 1st 2020 indicated in parenthesis. The slope of the linear regression of daily new mortality as a function of % of the fully vaccinated population (with 2 doses) is indicated, followed by the correlation coefficient (R²) and the probability value (p) of the regression.
At the time when experimental vaccines became available, the Omicron variant circulating was highly transmissible but with low mortality. This was desirable for conferring natural immunity against SARS-Co V-2. The beneficial effect of natural attenuation, well established by Sabin in the 1950’s⁴⁶, seems to have been ignored during COVID-19. It is reasonable to assume that natural attenuation of SARS-CoV-2 through millions of human hosts (resulting in the later Omicron variant), augmented at the time by fewer hospitalizations, resulting in fewer nosocomial infections and deaths ascribed to SARS-Co V-2, could explain fully a decreasing mortality without any contribution by massive vaccination. The failure to prevent infection or to substantially reduce mortality as shown by the official data reported by the countries presented in Figure 5 should have raised questions about the value of the massive vaccination campaigns, considering the potential risks of adverse reactions (still to be fully determined) of experimental vaccines and the considerable cost to the national economies of the region already stressed by COVID-19 wide spread closures.
Concluding remarks
The virucidal role of sunlight and a seasonal pattern of coronavirus infections was determined and published early in the pandemic¹⁷˒³¹. A minimum of 11 minutes in tropical countries and longer farther away from the tropics was required for 90% of SARS-Co V-2 to be inactivated (Figure 1). For the observed seasonal progression of the pandemic, the virus must remain infectious in the environment for a relatively long period of time in order to be inactivated by sunlight. Person-to-person transmission does not allow the virus to remain aerosolized long enough (over 11 minutes) to be substantially inactivated by sunlight³¹. Then, health measures to impede person-to-person transmission of the disease, such as lock downs, face masks and social distancing should have been deemed, at best, of limited value to stop the pandemic. On the contrary, lock-downs, forcing people to remain indoors, may have increased (or assured) contagion of COVID-19 among same house-hold dwellers and between patients and personnel inside the same hospital or geriatric facility. In addition, isolation of individuals indoors (thus deprived of sunlight, lowered their levels of vitamin D, and weakened their immune competence by staying long periods indoors) may have altered the natural progression of the pandemic from a single incident into a set of re-occurring waves, as susceptible individuals become eventually released from their confinement.
Also, unfortunate were the costly and ineffective massive vaccination campaigns, at least in the Latin American countries studied here, were COVID-19 remained unchecked even after large segments of the population received at least two doses of a variety of experimental vaccines approved by either the US Food and Drug Administration or by the WHO (Figure 5). Regardless of the inefficiency of massive vaccination in the progression of COVID-19 in the countries studied, refusal by individuals to receive experimental vaccines resulted too often in lost jobs and a severe hardship that seems to have escaped the attention of lawyers in most countries.
Considering the effect on society and the economy, the burden of proof should always fall heavily on proving a substantial benefit of every mandated public health measure, (be it lock-downs, wearing of face masks, keeping social distancing or massive vaccination) and not on demonstrating their irrelevance.
One central lesson for the next pandemic to come (unsure of when but certain that it will) is that the bias of prestige, individual or institutional, should not be considered in policy-making, ever again in any way. For example, in a future pandemic an unknown scientist, from an obscure institution in a developing African or South American country could present correct and valuable findings while renown scientists from a prestigious institution could be again deadly wrong. Every prediction of importance (made by computer or other means) should be evaluated on its own merits and checked against real data before taking decisions that negatively impact the whole world.
In any case, the wrong predictions from the Imperial College of London are only part of the story in this turn of events. Part of the responsibility also sits squarely between a world dazzled by computers and sensationalist news from an industry leaning frequently toward show business, that moved many (but not all) governments to accept (without understanding the limitations and caveats underlying computer modeling) a non-peer reviewed report with apocalyptic predictions coming from the virtual world. Often discounting advice from local scientists, many governments chose to take action running with the stampeding herd.
The global handling of COVID-19 questions whether elected government officials as well as managers of scientific institutions, used to decide political and economic matters, are qualified to take scientifically responsible measures to control epidemics caused even by a germ having relatively low mortality rate as SARS-Co V-2.
Regardless of the qualifications and expertise of the agency’s political appointees or the pressures exerted by major donors and pharmaceutical corporations, the WHO demonstrated to be unable to control the pandemic. The performance during the pandemic indicates that the WHO may have reached the end of its useful life and could hinder future public health more than promote it. Although homogeneous response to a pandemic under total control of WHO, may sound desirable, the option is contrary to diversity of response which has guaranteed survival of those species that make the right decisions. In contrast, identical response by every country to a future pandemic caused by a high mortality germ could result in extinction of the human race if WHO dictates again ineffective responses as the agency repeatedly did during COVID-19.
Last but not least, the complicity of a large segment of the medical community readily imposing to their patients untested mandated health measures that often contradicted well established principles of virology, epidemiology, and immunology, condemned millions of people to unnecessary and deadly hospitalization and intubation, deprived them of the freedom to roam outdoors, isolated individuals from family and friends, recommended them to breathe through masks that could decrease oxygen intake to the brain, and forced even undecided and healthy patients as well as asymptomatic children to be injected with experimental vaccines some which, that by reverse transcribing into genomic DNA⁴⁷, could impair the long-term health of vaccine recipients and also of their offspring.
Without individual and institutional accountability for: irrational predictions, sensationalist press news, irresponsible governments, and for medical practices (all of which promoting unnecessary lock-downs, hospitalizations, staggering numbers of unnecessary deaths, economic loss and individual suffering) the world population will remain vulnerable to similar catastrophic policies, practices, and outcomes during the next pandemic.
To maintain independence from questionable WHO global mandates, each country should be wise in identifying a group of true experts (as demonstrated by documented pertinent achievements), within, as well as outside government institutions, from which meaningful counsel and guidance may be drawn in times of a health crisis. This panel or council of experts in infectious diseases should be identified before it is needed. The next germ to emerge could be one of the many pathogens producing much higher mortality than coronaviruses. Any germ of fulminant virulence could not give enough time to identify experts without risking another deadly and costly confusion where many governments, rather than blindly, embrace apocalyptic predictions as unfounded as those considered during COVID-19 and make policies that devastate the world.
It is hoped that the present article will promote free and honest discussion and constructive criticism leading to improved public health responses in future pandemics. This goal will only be attainable without a) the censorship by any scientific journals, b) sensationalisms of news media, c) greed from pharmaceutical corporations, d) servitude and ignorance of large segments of the medical community, and e) expectations of personal gain (political or economic) by some high visibility governmental public health servants.
Inferences
The data and findings presented in this article, as supported by the pertinent references allow to draw the following considerations:
I. Lock-downs, quarantines, face mask use and social distancing were ineffective in controlling COVID-19.
II. The actual cause of death of uncompromised patients that were hospitalized, intubated and likely died of iatrogenic infections during the pandemic must be statistically established.
III. Massive campaigns with experimental vaccines did not reduce infections nor mortality at least in the countries of South America that were studied here.
IV. The burden of proof must always fall with demonstrating the safety and effectiveness of mandated public health measures and not in demonstrating their irrelevance.
V. Computer simulation, although cheaper and less laborious than laboratory or field research, could, at best, complement but never replace actual data in policy making.
VI. A sensationalist press, more eager of attention and rating than truth, is a major enemy during health emergencies. Within this definition fall leading “scientific” journals that censored research critical of official mandates, thus preventing scientific discourse and dissent.
VII. Politicians or managers in charge of scientific institutions were unable to make adequate scientific decisions during the pandemic. A national panel of experts selected only by their merits in pertinent disciplines like infectious diseases, immunology and epidemiology, seems a safer alternative to draw guidance when it is necessary to take decisions during a public health emergency.
VIII. WHO failed to control the pandemic. Homogeneous response by every country to ineffective measures dictated by WHO could prevent diversity of national responses and result in catastrophic global consequences.
IX. A medical community that does not critically evaluates guidelines for soundness and follows blindly untested government measures is responsible of negative health outcomes during the pandemic and is unqualified to serve the public.
X. To capitalize for the future the experience that could be gained from the pandemic, the number of unnecessary deaths produced by ineffective public health measures should be approximated and any criminal and civil responsibilities during COVID-19 should be delineated.
Conflict of Interest Statement:
This study, as well as the previous research on COVID-19 published by the author, was funded by personal savings supplemented by a retirement pension without receiving any grant or benefiting from funding agencies in the public, commercial, or not-for-profit sectors. The author is not associated to any industrial or commercial enterprise, not-for-profit organization, nor to any political party. No political issues were considered during the study presented here and the findings should not be construed as supporting or criticizing any party, particular person, or specific government.
In memory of Dr. C. David Lytle, a true expert on the bioeffects of solar radiation.
Funding Statement:
None.
Acknowledgements:
None.
References
1. Kaplan, J., Frias, L. and McFall, M. A Third of the Global World Population Is in Coronavirus Lockdown. 2020. https://news.yahoo.com/countries-lockdown-because-coronavirus-183100697.html
2. Sandford, A. Coronavirus: Half of Humanity Now on lockdown as 90 Countries Call for Confinement. 2020. Euronews. https://yournews.com/2020/04/02/1544253/coronavirus-half-of-humanity-now-on-l ockdown-as-90-countries/
3. McNeil, W.H. Plagues and Peoples. 1977. Doubleday Publishing Group, New York.
4. Peiris, J.S.M., Lai, S.T., Poon, L.L.M., Guan, Y, Yam, L.Y.C., Lim, W., Nicholls, J., Yee, W.K.S., Yan, W.W., Cheung, M.T., Cheng, V.C.C., Chan, K.H., Tsang, D.N.C., Yung, R.W.H., Ng, T.K. and Yuen, K.Y. Coronavirus as a Possible Cause of Severe Acute Respiratory Syndrome. 2003. Lancet, 361, 1319-1325. https://doi.org/10.1016/S0140-6736(03)13077-2
5. Ramadan, N., Shaib, H. Middle East Respiratory Syndrome Corona Virus (MERS-CoV): A Review. 2019. Germas, 9, 35-42. https://doi.org/10.18683/germs.2019.1155
6. Holmes, K.V. Coronaviridae and Their Replication. In: Fields, B.N. and Knipe, D.M., Eds., Fields Virology, 1990. Second Edition, Chapter 29, Raven Press, New York, 841-856.
7. Jahrling, P.B. Viral Hemorrhagic Fevers. In: Zajtchuk, R., Ed., Textbook of Military Medicine, Medical Aspects of Chemical and Biological Warfare, Warfare, Weaponry and the Casualty, Part I, Chapter 29. 1997. Office of the Surgeon General Publications, Washington D.C., 591-602.
8. John’s Hopkins’ Center for System Sciences and Engineering. Coronavirus Statistics. Stats real time. 2020. https://epidemic-stats.com/
9. Browne, E. Fauci Was ‘Untruthful’ to Congress About Wuhan Lab Research, New Documents Appear To Show. US Congress meetings. Published September 9, 2021 https://www.congress.gov/117/meeting/house/114270/documents/HHRG-117-GO24-20211201-SD004.pdf
10. Newsweek. Fauci Was ‘Untruthful’ to Congress About Wuhan Lab Research. Published Sep 9, 2021. https://www.newsweek.com/fauci-untruthful-congress-wuhan-lab-research-documents-show-gain-function-1627351
11. The Scientist. NIH Cancels Funding for Bat Coronavirus Research Project. Published April 28, 2020 https://www.ncbi.nlm.nih.gov/search/research-news/9563/
12. Johnson, N.P., Mueller, J. Updating the accounts: global mortality of the 1918 –1920 “Spanish” influenza pandemic. 2002. Bull. Hist. Med. 76: 105–115.
13. Taubenberger, J.K., Reid, A.H., Krafft, A.E., Bijwaard, K.E., Fanning,T.G. Initial genetic characterization of the 1918 “Spanish” influenza virus. 1997. Science 275:1793–1796.
14. Tumpey, T.M., et al. Characterization of the reconstructed 1918 Spanish influenza pandemic virus. 2005. Science 310:77– 807.
15. Zhang, S., Diao, M., Yu, W., Pei, L., Lin, Z., Chen, D. Estimation of the reproductive number of novel coronavirus (COVID-19) and the probable outbreak size on the Diamond Princess cruise ship: a data-driven analysis. 2020. Int J Infect Dis 93:201 –204. https://doi.org/10.1016/j.ijid.2020.02.033 [PMC free article] [PubMed] CrosRef] [Google Scholar]
16. Li, Q., Guan, X., Wu, P., et al. 2020. Early Transmission Dynamics in Wuhan, China, of Novel Coronavirus. Infected Pneumonia March 26, 2020. 2020. N Engl J Med 382:1199-1207 DOI: 10.1056/ NEJMoa2001316https://www.nejm.org/doi/full/10.1056/NEJMOa2001316
17. Sagripanti, J-L., Lytle, D. Estimated inactivation of corona viruses with special reference to COVID-19. 2020. Photochemistry & Photobiology Jul;96(4) :731-737. doi: 10.1111/php.13293. Epub 2020 Jul 9.
18. Tufekci, Z. Don’t Believe the COVID-19 Models. That’s not what they’re for. April 2 2020. https://www.theatlantic.com/technology/archive/2020/04/coronavirus-models-arent-supposed-be-right/609271/ Retrieved June 1 2020.
19. Flajnik, M., Singh, N.J., Holland, S.M. Fundamental Immunology. Eighth Edition. 2022.
20. Celentano, D.D., Szklo, M. Gordis Epidemiology. 6th Ed. 2018
21.Ferguson, N.M., Laydon, D., Nedjati-Gilani, G., Imai, N., Ainslie, K., Baguelin, M., Bhatia, S., Boonyasiri, A., Cucunubá, Z., Cuomo-Dannenburg, G., Dighe, A., Dorigatti, I., Fu, H., Gaythorpe, K., Green, W., Hamlet, A., Hinsley, W., Okell, L.C., van Elsland, S., Thompson, H., Verity, R., Volz, E., Wang H, Wang Y, Walker PGT, Walters C, Winskill P, Whittaker C, Donnelly CA, Riley S and Ghani AZ. Impact of non-pharmaceutical interventions (NPIs) to reduce COVID19 mortality and healthcare demand. 2020. Rep. 9, The Royal Society. https://www.imperial.ac.uk/media/imperial-college/medicine/sph/ide/gida-fellowships/Imperial-College-COVID19-NPI-modelling-16-03-2020.pdf
22. Patrick, G.T., Walker, P.G.T., Whittaker, C., Watson, O., et al. 2020 Report 12 – The global impact of COVID-19 and strategies for mitigation and suppression. 26 March 2020. Retrieved March 28 and June 1 2020. https://www.imperial.ac.uk/mrc-global-infectious-disease-analysis/covid-19/report-12-global-impact-covid-19/
23. Scher, I. Without any interventions like social distancing, one model predicts the coronavirus could have killed 40 million people this year. March 27 2020. https://www.businessinsider.com/covid19-model-predicts-40-million-people-could-die-without-interventions-2020-3 ))
24. Cheng, C., Barceló, J., Hartnett, S., Kubinec, R., Messerschmidt, L. COVID-19 Government Response Event Dataset (CoronaNet v.1.0) Nature Human Behaviour. 23 June 2020 https://www.nature.com/articles/s41562-020-0909-7
25. Begley, S. Influential Covid-19 model uses flawed methods and shouldn’t guide U.S. policies, critics say. April 17, 2020. https://www.statnews.com/2020/04/17/influential-covid-19-model-uses-flawed-methods-shouldnt-guide-policies-critics-say/
26. O’Neil, C. Meet the Covid Models That Are Running the World. Bloomberg News. May 14, 2020. https://finance.yahoo.com/news/meet-covid-models-running-world-210029807.html
27. Osborne, M. Inaccurate Virus Models Are Panicking Officials Into Ill-Advised Lockdowns. March 25, 2020 https://thefederalist.com/2020/03/25/inaccurate-virus-models-are-panicking-officials-into-ill-advised-lockdowns/
28. Prestigiacomo, A. Epidemiologist Behind Highly-Cited Coronavirus Model Drastically Downgrades Projection. March 26, 2020 DailyWire.com https://www.dailywire.com/news/epidemiologist-behind-highly-cited-coronavirus-model-admits-he-was-wrong-drastically-revises-model
29. World Health Organization. The-true-death-toll-of-covid-19. Estimating-global-excess-mortality. Published May 2021. Consulted July 11, 2024. https://www.who.int/data/stories/the-true-death-toll-of-covid-19-estimating-global-excess-mortality
30. The Johns Hopkins. Coronaviruses Research Center. Global tracking. consulted July 11, 2024 https://coronavirus.jhu.edu/map.html
31. Sagripanti, J-L. Seasonal Effect of Sunlight on COVID-19 among Countries with and without Lock-Downs. 2021. Open Journal of Epidemiology. Vol. 11, Issue 3, August 2021. DOI: 10.4236/ojepi.2021.113027.https://www.scirp.org/journal/paperinforcitation?paperid=111464
32. Wikipedia, the free encyclopedia. COVID-19 pandemic lockdowns. Retrieved 29 May 2020. https://en.wikipedia.org/wiki/COVID-19_pandemic_lockdowns#Countries_and_territories_without_lockdowns
33. Roser, M., Ritchie, H., Ortiz-Ospina, E., Hasell, J. Coronavirus Pandemic (COVID-19) 2020. Published Online at OurWorldInData.org. https://ourworldindata.org/COVID-hospitalizations
34. Garcia, P.J., Alarcón, A., Rojas, A.K., Saenz, R., Salgado de Snyder, N., Solimano, G., Torres, R., Tobar, S., Tuesca, R., Vargas, G., Atun, R., Bayer, A., Buss, P., Guerra, G. and Ribeiro, H. COVID-19 Response in Latin America. 2020. The American Journal of Tropical Medicine and Hygiene, 103, 1765-1772. https://doi.org/10.4269/ajtmh.20-0765
35. Block, S.S. Disinfection, Sterilization and Preservation. 5th. Edition, 2001. Lippincott Williams & Wilkins, New York.
36. Sagripanti, J.-L., Eklund, C.A., Trost, P.A., Jinneman, K.C., Abeyta, C., Kaysner, C.A., Hill, W.E. Comparative Sensitivity of Thirteen Species of Pathogenic Bacteria to Seven Chemical Germicides. 1997. American Journal of Infection Control, 25, 335-339. https://doi.org/10.1016/S0196-6553(97)90026-2
37. European Centre for Disease Prevention and Control. Infographic: Healthcare-Associated Infections—A Threat to Patient Safety in Europe. 2018. https://www.ecdc.europa.eu/en/publications-data/infographic-healthcare-associated -infections-threat-patient-safety-europe
38. Medalia. Check Market. Sample size calculator. Accessed July 2021 https://www.checkmarket.com/sample-size-calculator/
39. Sagripanti, J-L. Unexpected effect of sunlight, the environment, and public health measures in the progression of COVID-19. Conference: General Assembly. European Society of Medicine, August, 4, 2022. https://esmed.org/video-detail/?id=86
40. Chan, J.F., Yuan, S., Kok, K.H., To, K.K., Chu, H., Yang, J. A Familial Cluster of Pneumonia Associated with the 2019 Novel Corona Virus Indicating Person-to-Person Transmission: A Study of a Familial Cluster. 2020. Lancet, 395, 514-523. https://pubmed.ncbi.nlm.nih.gov/31986261/https://doi.org/10.1016/S0140-6736(20)30154-9
41. Sagripanti, J-L., Aquilano, D. Reduced Social Distancing and Face Mask Wearing at Massive Soccer-Related Gatherings Did Not Affect Daily COVID-19 Infections in Argentina. Medical Research Archives. Vo.11(2). February issue 2023. https://esmed.org/MRA/mra/article/view/3471
42. Reiling, J. Dissemination of bacteria from mouth during speaking coughing and otherwise. 2000. J. Am. Med. Assoc. 284, 156
43. McNulty, M. Avon lands 33 million mask contract from US. 2014. https://www.rubbernews.com/article/20140707/NEWS/306309997/avon-lands-33-million-mask-contract-from-u-s. Accessed July 11, 2021.
44. Army protection website. Avon Protection has received an order from US Department of Defense for M50 protection mask 110 03161. 2016. https://www.armyrecognition.com/march_2016_global_defense_security_news_industry/avon_protection_has_received_an_order_from_us_department_of_defense_for_m50_protection_mask_11003161.html Accessed May 25, 2021
45. Sagripanti, J-L., Aquilano, D.R.. Progression of COVID-19 in six South American countries with different vaccination coverage. 2022. Med. Res. Arch. Vol:10, Issue 3. https://esmed.org/MRA/mra/article/view/2723/193546052
46. Sabin, A.B. Properties and behavior of orally administered attenuated poliovirus vaccine. 1957. JAMA 164,1216-1223.PMID:13438685 DOI: 10.10 01/jama.1957.62980110008008 Available Online at https://pubmed.ncbi.nlm.nih.gov/13438685/
47. Aldén, M., Olofsson, F., Yang, D., Barghouth, M., Luan, C., Rasmussen, M., De Marinis, Y. Intracellular reverse transcription of Pfizer BioNTech COVID-19 mRNA vaccine BNT162b2 in vitro in human liver cell line. 2022. Curr. Issues Mol. Biol. Vol 44:1115–1126. doi: 10.3390/cimb440300 73. [PMC free article] [PubMed]