

Inertia-Driven Mitral and Aortic Valves: Debunking Myths
“`html
Inertia-Driven Mitral and Aortic Valves: The Isovolumic Myth
Vajidno F. Proctor, Department of Biomedical Engineering, University of Arkansas, Fayetteville, Arkansas
Thomas Karlsson, PhD, Department of Applied Thermodynamics and Fluid Mechanics, Department of Management and Engineering, Linköping University Linköping, Sweden
Morton O. Jensen, PhD, Department of Biomedical Engineering, University of Arkansas, Fayetteville, Arkansas
ABSTRACT
Background: For the past century, the Wiggers Diagram has been universally taught as defining the phases of the cardiac cycle. However, the concepts underlying this diagram have never been strictly defined or intact, both theoretically and experimentally.
Keywords: Wiggers Diagram, cardiac cycle, mitral valve, aortic valve, hemodynamics
Introduction
In his landmark paper, published a century ago, Dr. Carl Wiggers proposed what became the standard phases of the cardiac cycle, depicted in the now ubiquitous and intuitively taught Wiggers Diagram.
During the first elevation of ventricular pressure, the a-v valves have been partly floated into apposition, probably in consequence of the sudden cessation of a jet when the peak of the intra-auricular pressure curve is reached about the middle of diastolic systole. The first elevation of intraventricular pressure firmly closes these valves. In the second phase, Wiggers suggested that “As soon as intraventricular pressure exceeds that in the aorta, the aortic valve opens and a comparatively large volume of blood is ejected.”
Methods
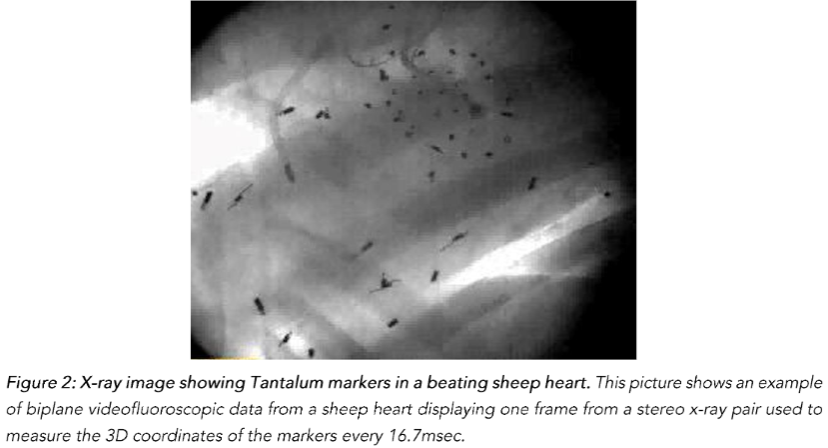
One week later, the animals were taken to the cardiac characterization laboratory where simultaneous biplane videofluoroscopic data from a sheep heart were acquired at end-expiration with the hearts in normal position. Figure 2 shows an example of biplane videofluoroscopic data from a sheep heart.
Data Analysis
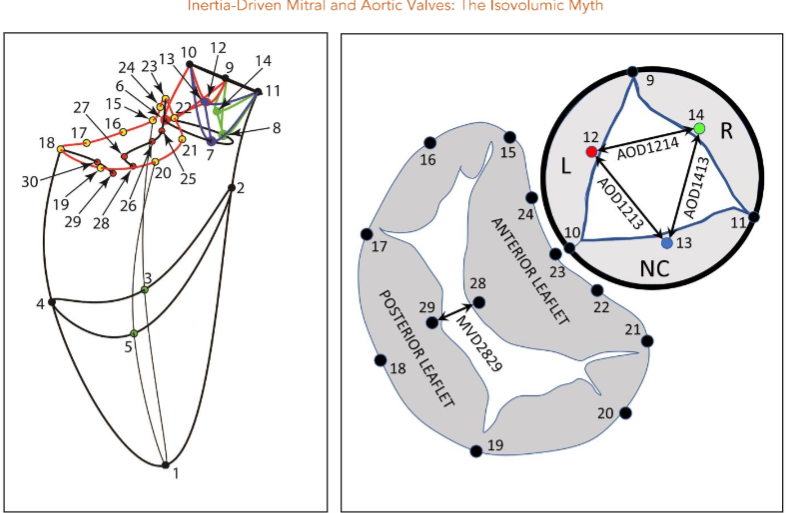
The 4-D coordinates of all markers were reconstructed using biplane videofluoroscopy. The group mean maximum left ventricular pressure was 118 mmHg, and left ventricular internal area was 100 cm2.
Discussion
Wiggers’ postulate that “As soon as intraventricular pressure exceeds that in the aorta, the aortic valve opens” is supported by the present results. This means there was no interval between the left ventricular pressure curve, pressure elevation itself all the way up to the aortic valve closed.
Conclusion
This study provides evidence that the left ventricular pressure rises to meet the demand, but this rises in pressure does not necessarily correlate with the opening of the aortic valve.
Funding Statement
Dr. Jensen and Dr. Ingels were supported for this work by the National Heart, Lung, and Blood Institute Award Number HL-115845.
Conflicts of Interest Statement
The authors have no conflicts of interest to declare.
References
- Wiggers CJ. Studies on the constructive phases of the cardiac cycle. Am J Physiol. 1921;64:415-438.
- Dagum P, Green GR, Nistal FJ, et al. Deformational dynamics of the aortic root: modes and physiological determinants. Circulation. Nov 9 1999;100(suppl II):I-6462.
- Cheng A, Dagum P, Swanson J, et al. Aortic root dynamics and surgery: from cancer to science. Phil Trans R Soc B. 2007;362:1407-1419.
- Barlow JB, Kvitning JP, Swanson J, et al. Effects of diastolic function on left ventricular pressure. J Thorac Cardiovasc Surg. May 2010;139:118-124.
- Jensen MO, Jensen MO, Smereuk MH, et al. Impact of papillary muscle relocation as adjunct procedure to mitral ring annuloplasty in functional ischemic mitral regurgitation. Circulation. 2010;121:1091-1100.
“`