

Inertia-Driven Mitral and Aortic Valves: Key Insights
Inertia-Driven Mitral and Aortic Valves: The Isovolumic Myth
Neil B. Ingels, Jr., Ph.D.¹, Matts Karlsson, Ph.D.², Morten O. Jensen, Ph.D., Dr.Med., FAHA³
- Adjunct Professor; Department of Biomedical Engineering, University of Arkansas, Fayetteville, Arkansas
- Professor; Division of Applied Thermodynamics and Fluid Mechanics, Department of Management and Engineering, Linköping University, Linköping, Sweden
- Professor; Department of Biomedical Engineering, University of Arkansas, Fayetteville, Arkansas
OPEN ACCESS
PUBLISHED: 30 June 2025
CITATION: Ingels, Jr., N., et al., 2025. Inertia-Driven Mitral and Aortic Valves: The Isovolumic Myth. Medical Research Archives, [online] 13(6).
https://doi.org/10.18103/mra.v13i6.6694
COPYRIGHT:© 2025 European Society of Medicine. This is an open-access article distributed under the terms of the Creative Commons Attribution License, which permits unrestricted use, distribution, and reproduction in any medium, provided the original author and source are credited.
DOI https://doi.org/10.18103/mra.v13i6.6694
ISSN 2375-1924
ABSTRACT
Keywords
Wiggers Diagram, cardiac cycle, mitral valve, aortic valve, hemodynamics
Introduction
In his landmark paper, published a century ago, Dr. Carl Wiggers proposed what became the standard definition of the eight phases of the cardiac cycle, encapsulated in the classic, universally-taught Wiggers Diagram¹.
During the first phase, Wiggers suggested that “At the beginning of ventricular systole, the a-v valves have been partly floated into apposition, probably in consequence of the sudden cessation of a jet when the peak of the intra-auricular pressure curve is reached about the middle of auricular systole. The first elevation of intraventricular pressure firmly closes these valves…” During the second phase he proposed that “As soon as intraventricular pressure exceeded intra-aortic pressure the semilunar valves open and a comparatively large volume of blood is ejected.” During the fourth phase, he proposed that the cusps of the aortic valve floated toward a position of closure as systole waned, and “not until such closure has been effected, however, does a steep decline of intraventricular pressure, such as one might logically associate with a relaxation process in muscle take place.” For the fifth phase, he wrote “following closure of the semilunar valves and until the a-v valves have opened, the ventricle relaxes without any flow of blood either from or into its cavity” and that “the time interval existing between the complete closure of the semilunar valves and the opening of the a-v valves represents the isometric relaxation phase.”
These proposals were based on Wiggers’ years of careful pressure measurements in beating hearts, but while his interpretations above required validation with studies of leaflet and cusp positions and ventricular flows, he did not have access to such direct measurements. His proposals were thus important, sophisticated conjectures that could not be fully tested at that time and, indeed, although presently universally taught, have never been fully and directly tested on intact, beating hearts.
In the present study we directly test these conjectures utilizing datasets obtained from the beating hearts of closed-chest sheep. In these experiments, high frequency sampling of left ventricular and aortic pressures was recorded along with the simultaneous 4-D coordinates of 30 miniature radiopaque markers. The markers were arrayed to silhouette the left ventricle and track key specific anatomical landmarks of both the aortic and mitral valves, including the leaflets and cusps, every 16.7 msec. This method has been used extensively in prior, widely cited publications²–⁵, as well as more detailed assessments in the book “Mitral Valve Mechanics”¹⁰. Our analysis of these data allows simultaneous measurement of the instantaneous relationships between pressures, motions, and flows in the relevant regions and thereby directly test the validity of Wiggers’ widely taught concepts. Our present findings do not support these concepts.
Methods
This study reports the findings of our current analysis of datasets arising from experiments in ovine subjects that were approved by the Stanford Medical Center Laboratory Research Animal Review Committee, accredited by the Association for Assessment and Accreditation of Laboratory Animal Care International, and conducted according to Stanford University Policy. The methods involved are described in detail in publications arising from this work²,³, as well as a freely downloadable book describing in detail the mechanics of the mitral valve¹⁶, and thus will only be summarized here.
Eight sheep had surgical implantation of thirty miniature radiopaque tantalum markers at the locations shown in Figure 1. Three sub-epicardial markers were placed around the left ventricular equator at anterior (#3), lateral (#4), and posterior (#5) sites. An additional sub-epicardial marker was placed at the left ventricular apex (#1), alongside an indwelling Konigsberg high frequency micromanometer to measure left ventricular pressure.
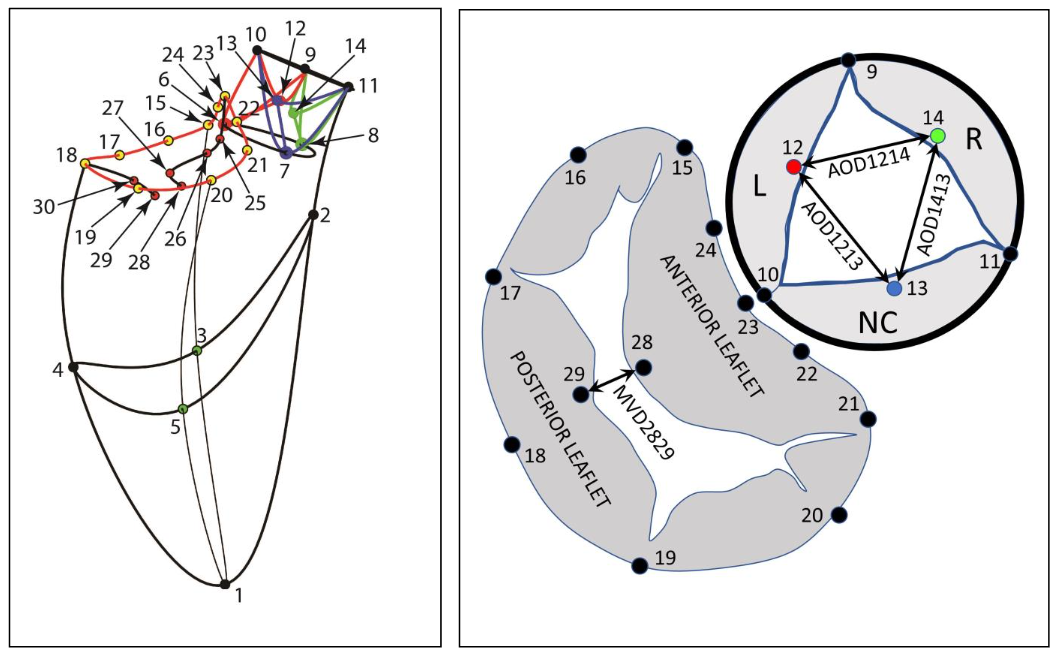
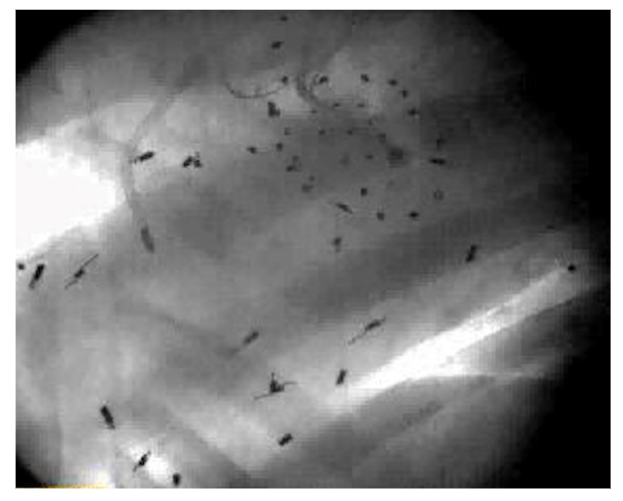
Figure 2: X-ray image showing Tantalum markers in a beating sheep heart. This picture shows an example of biplane videofluoroscopic data from a sheep heart displaying one frame from a stereo x-ray pair used to measure the 3D coordinates of the markers every 16.7 msec.
At the end of the experiment, aortic root angiography was used to confirm aortic valve competence. The present report analyzes data from the five technically successful runs from this experiment.
Distances between marker pairs were computed from the norm of the 3D vector constructed between them.
Data Analysis
The 4-D coordinates of all 30 markers were reconstructed using biplane videofluorography with a spatial resolution of 0.1 mm¹⁸ and temporal resolution of 16.7 msec (60 frames/sec) for three consecutive beats in each heart.
Left ventricular instantaneous inflow and outflow was estimated by a multiple tetrahedral space-filling approach that yields changes in left ventricular volume (V) at each frame (f) (i.e. flow into and out of the left ventricular chamber) as previously validated with aortic ultrasonic flowmeters¹⁹. Left ventricular flow, i.e., left ventricular volume change ΔV (mL) at each frame (f), was computed using a second order centered finite difference method.
Results
Figure 3 graphically displays the results from a representative heart. These data, along with frame-by-frame analysis of the computer animations, were used to characterize each of the three beats analyzed in each of the five hearts, 15 beats in all.
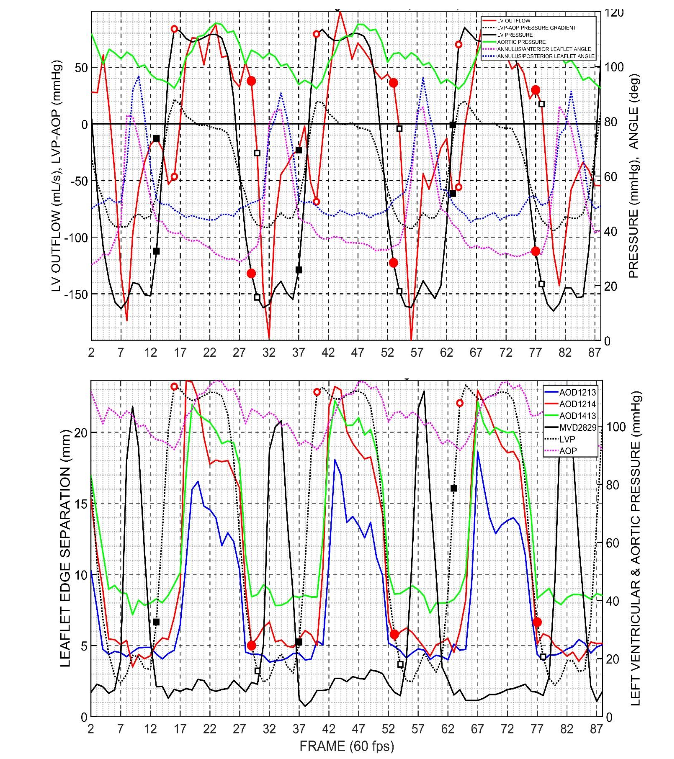
Figure 3: Data from a representative heart in this study. Black squares, mitral valve. Red circles, aortic valve. Open symbols, initiation of valve opening. Closed symbols, time of valve closure. Top Panel shows left ventricular pressure (LVP), aortic pressure (AOP), left ventricular flow (positive, outflow; negative, inflow), LV-Aortic pressure difference (LVP-AOP), annulus/anterior mitral leaflet angle, annulus/posterior mitral leaflet angle. Bottom Panel shows left ventricular pressure, aortic pressure, distance between mitral valve markers on the anterior and posterior cusp edges, distance between aortic valve markers on the Left-Non Coronary cusps, Left-Right cusps, Right-NC cusps.
In Figure 3 top panel, the left ventricular pressure (LVP) is solid black line. Aortic pressure (AOP), solid green line. Left ventricular flow (positive, outflow; negative, inflow), solid red line. LV-Aortic pressure difference (LVP-AOP), dotted black line. Annulus/Anterior mitral leaflet angle (18-23-28), dotted magenta line. Annulus/Posterior mitral leaflet angle (23-18-29), dotted blue line. In the bottom panel, Left ventricular pressure, dotted black line. Aortic pressure, dotted magenta line. Distance between mitral valve markers on the anterior and posterior cusp edges (MVD2829), solid black line. Distance between aortic valve markers on the Left-NC (Non Coronary) cusps (AOD1213), solid blue line; Left-Right cusps (AOD1214), solid red line; Right-NC cusps (AOD1413), solid green line.
The Group mean maximum left ventricular pressure was 118 ± 7 mmHg (range 109-129) and minimum left ventricular pressure was 11 ± 5 mmHg, (range 3-15 mmHg), both normal values. Mean heart rate was 142 ± 15 beats/minute, (range 124-161), roughly twice the normal resting rate for sheep, but not unusual in this experimental setting. Stroke volumes were 11 ± 2 mL (range 9-14 mL) and cardiac output was 1.8 ± 0.2 L/min (range 1.5-2.0 L/min) both low values, but typical for those recorded under these experimental conditions.
An important finding in this study is that the aortic valve closed in all 15 beats at low left ventricular pressures (group mean LVP 28 ± 6 mmHg; range 18 to 35 mmHg) in the last third of the “isovolumic relaxation” (IVR) interval and that there was no statistically significant difference between the time the aortic valve closed and the initiation of mitral valve opening (group mean 10±19 msec; range 17 to +33 msec; p=0.06 NS from 0). In the 12 beats where LV inflow and outflow could be computed, the final closure of the aortic valve occurred immediately before rapid left ventricular flow deceleration during IVR. Group mean flow at the time of aortic valve closure was 0.4±23 mL/sec, ranging from -28 to +38 mL/sec, with mean aortic valve closure being about one-fifth of the maximum systolic outflow during the associated systole (mean 19±15%; range 0 to 43%).
Statistically, for the group, the mitral valve closed (MC) before the aortic valve started opening (ASO) during so-called “isovolumic contraction”, IVC (ASO-MC interval 29 ± 34 msec, p=0.005 from 0) at a group mean left ventricular pressure of 59 ± 41 mmHg (range 8-109 mmHg). But differences in individual hearts were more revealing than this lumped statistical behavior. Final mitral closure occurred in 8 of the beats analyzed during the first third of IVC (supporting the traditional view of mitral closure, as in Figure 2), 1 beat closed in the middle third, but 6 beats exhibited mitral closure in the last third of IVC at left ventricular pressures exceeding 100 mmHg. In 4 of these 6 beats, both the mitral and aortic valves were open at the same time and in 3 the aortic valve was opening before the mitral valve had closed. At the time of mitral valve closure, group mean left ventricular outflow had ceased (0.00 ± 0.51 mL/frame, range -1.02 to +0.75 mL/frame) then quickly reversed with a group mean initial inflow at the initiation of aortic valve opening of -0.31 ± 0.71 mL/frame (range -1.3 to 0.71).
From initiation of closing to fully closed required 37 ± 36 msec (range 0-100 msec) for the mitral valve and 66 ± 18 msec (range 50-100 msec) for the aortic valve. From initiation of opening to fully opened required 57 ± 8 msec (range 50-67 msec) for the mitral valve and 60 ± 15 msec (range 50-100 msec) for the aortic valve.
Discussion
For more than a century, the periods of “isovolumic contraction” (IVC) and “isovolumic relaxation” (IVR) have been defined based on presumed (not measured) valve opening and closing times. The present study demonstrates, for the first time, by direct, high-resolution, simultaneous temporal and spatial measurements of aortic and mitral valve opening and closing in relation to instantaneous left ventricular pressures and volumes, that these IVC and IVR periods are not consistently isovolumic,
as left ventricular volume changes were observed throughout these periods. In this paper we will continue to use the terms IVC and IVR, however, in deference to their historic role as a shorthand notation for the periods of rapidly increasing left ventricular pressure (IVC) and rapidly decreasing pressure (IVR) but recognize that these terms must be eventually dissociated from their role as acronyms for these misleading phrases.
Wiggers’ postulate that the first elevation of intraventricular pressure firmly closes the mitral valve is not supported by the present results. Mitral valve closing was observed everywhere along the rising left ventricular pressure curve, from pressure elevation onset all the way up to peak systolic pressure.
Wiggers’ proposal that “As soon as intraventricular exceed intra-aortic pressure the semilunar valves open and a comparatively large volume of blood is ejected” is somewhat supported by this work, but the valve was not fully open at this time, it was just starting to open and, due to the inertial lag in blood flow after pressure difference reversal, the aortic cusps didn’t fully open for another 60 msec after this pressure crossover, with the result that the “comparatively large volume of blood” is actually ejected well after aortic valve opening, closer to mid-systole.
Wiggers’ suggestion that the steep decline of intraventricular pressure during isovolumic relaxation is preceded by closure of the aortic valve is not supported by the present results. The steep decline of intraventricular pressure in these hearts always took place before the aortic valve closed, with aortic valve closure always occurring in the final third of the LV pressure drop in all beats studied, in direct contradiction to this concept.
Wiggers’ statements “…following closure of the semilunar valves and until the a-v valves have opened, the ventricle relaxes without any flow of blood either from or into its cavity” and “the time interval existing between the complete closure of the semilunar valves and the opening of the a-v valves represents the isometric relaxation phase” are in conflict with the results of the present analysis in two ways: (1) in these hearts there was no interval between closure of the aortic valve and opening of the mitral valve during isovolumic relaxation; and (2) a considerable outflow of blood occurred throughout isovolumic relaxation, with flow being, on average, 0.94 mL/frame when the aortic valve just begins its closing motion as left ventricular pressure starts to fall, and continuing outflow of 0.07 mL/frame when the aortic valve finally sealed shut.
Why are the results of this study, particularly those having to do with isovolumic periods and valve closures, so incompatible with current textbook views of how the left ventricle interacts with the mitral and aortic valves? The problem is that the textbooks describe valve opening and closing solely in terms of pressure difference (i.e., only the left side of Newton’s Second Law, [F=ma]), but pressure differences across the valves do not open and close the valves; it is flow through the valves. Discussing valve performance only in terms of pressure difference neglects the inertia of the mass of the flowing blood, and pressure differences (which can be transmitted almost instantaneously through the ventricle due to blood’s incompressibility) lead to flows that are governed not only by these pressure differences, but, very importantly, by inertial mass. This problem has long been known. More than 30 years ago Beyar and Sideman wrote “…to determine the opening of the aortic valve and the termination of isovolumetric contraction one must also consider the kinetic energy (dynamic pressure) and the acceleration term (associated with Newton’s Second Law).”²⁰ More recently, Pasipoularides wrote “Central pulsatile blood flows are… dominated by inertial effects and almost all the driving phasic pressure gradient goes into acceleration or deceleration, i.e., into overcoming blood inertia.”²¹ and Jensen, et al. demonstrated the inertial effects associated with the closing of isolated porcine mitral valves.²² Detailed leaflet tracking has only been analyzed more recently with medical imaging modalities²³–²⁵.
whereas simultaneous tracking of mitral and aortic valve leaflets with untethered miniature markers in beating hearts has not been analyzed until now. To the best of our knowledge, this is the first study where aortic cusp positions, mitral leaflet positions, and left ventricular pressures and volumes could all be measured simultaneously and directly in the beating heart to reveal the impact of inertial blood flow on the aortic cusps and mitral valve leaflets throughout the cardiac cycle.
The present study makes clear that understanding the left ventricle as a pump is going to require understanding the importance of inertial mass in the movement of the blood through its chambers. As noted in Results, 6 of the 15 beats analyzed exhibited mitral closure in the last third of IVC at left ventricular pressures exceeding 100 mmHg. In 4 of these 6 beats, both the mitral and aortic valves were open at the same time and in 3 the aortic valve actually opened before the mitral valve closed. This can only happen through inertial effects. Depending on the temporal relationship between left atrial and left ventricular force development, A-wave-driven left ventricular inflow drives mitral valve leaflet opening while, simultaneously, LV-driven outflow drives aortic cusp opening. Thus, for a very brief moment, an inertially-supported flow condition can exist allowing both valves to be open at the same time. This moment lasts no more than about 33 msec when left ventricular blood flow patterns adjust, in accordance with Newton’s Second Law, to turn the inflow through the mitral valve into mitral regurgitation, thereby closing the mitral leaflets, while, at the same time, continuing to drive the aortic cusps further apart.
In order to put the results of the present study in context, we illustrate these concepts with the simple model shown in Figure 4.
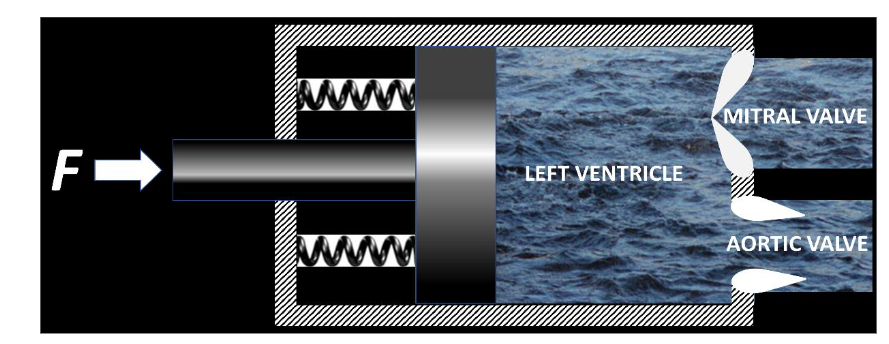
Figure 4: Simplified left heart model to illustrate the concepts of this paper.
1. Wiggers CJ. Studies on the consecutive phases of the cardiac cycle. I. The duration of the consecutive phases of the cardiac cycle and the criteria for their precise determination. Am J Physiol. 1921;56:415-438.
2. Dagum P, Green GR, Nistal FJ, et al. Deformational dynamics of the aortic root: modes and physiologic determinants. Circulation. Nov 9 1999;100(Suppl II):II54-II62.
3. Cheng A, Dagum P, Miller DC. Aortic root dynamics and surgery: from craft to science. Phil Trans R Soc B. 2007;362:1407-1419.
4. Bothe W, Kvitting JP, Swanson JC, Hartnett S, Ingels NB, Jr., Miller DC. Effects of different annuloplasty rings on anterior mitral leaflet dimensions. J Thorac Cardiovasc Surg. May 2010; 139(5):1114-22. doi:10.1016/j.jtcvs.2009.12.014
5. Bothe W, Rausch MK, Escobar Kvitting JP, et al. How do annuloplasty rings affect mitral annular strains in the normal beating ovine heart? 126/11_suppl_1/S231pii;10.1161/CIRCULATIONAHA.111.084046 doi. Circulation. 2012;126(11 Suppl 1): S231-S238.
6. Dagum P, Timek TA, Green GR, et al. Coordinate-free analysis of mitral valve dynamics in normal and ischemic hearts. Circulation. Nov 07 2000;102(19 Suppl 3):III62-9.
7. Glasson JR, Komeda M, Daughters GT, et al. Early systolic mitral leaflet “loitering” during acute ischemic mitral regurgitation. J Thorac Cardiovasc Surg. Aug 1998;116(2):193-205.
8. Goktepe S, Bothe W, Kvitting JP, et al. Anterior mitral leaflet curvature in the beating ovine heart: a case study using videofluoroscopic markers and subdivision surfaces. BiomechModelMechanobiol. 2009;
9. Itoh A, Krishnamurthy G, Swanson JC, et al. Active stiffening of mitral valve leaflets in the beating heart. Am J Physiol Heart Circ Physiol. Jun 2009; 296(6):H1766-73. doi:10.1152/ajpheart.00120.2009
10. Swanson JC, Krishnamurthy G, Itoh A, et al. Vagal nerve stimulation reduces anterior mitral valve leaflet stiffness in the beating ovine heart. S0021-9290(12)00227-8pii;10.1016/j.jbiomech.2012.04.009 doi. J Biomech. Jul 26 2012;45(11):2007-13. doi:10.1016/j.jbiomech.2012.04.009
11. Tibayan FA, Rodriguez F, Langer F, et al. Increases in mitral leaflet radii of curvature with chronic ischemic mitral regurgitation. J Heart Valve Dis. Sep 2004;13(5):772-8.
12. Timek T, Dagum P, Lai DT, et al. The role of atrial contraction in mitral valve closure. J Heart Valve Dis. May 2001;10(3):312-9.
13. Timek TA, Green GR, Tibayan FA, et al. Aorto-mitral annular dynamics. Ann Thorac Surg. Dec 2003;76(6):1944-50.
14. Timek TA, Liang D, Daughters GT, Ingels NB, Jr., Miller DC. Effect of semi-rigid or flexible mitral ring annuloplasty on anterior leaflet three-dimensional geometry. J Heart Valve Dis. Mar 2008;17(2):149-54.
15. Timek TA, Nielsen SL, Lai DT, et al. Mitral annular size predicts Alfieri stitch tension in mitral edge-to-edge repair. J Heart Valve Dis. Mar 2004; 13(2):165-73.
16. Ingels, Jr., Neil B, Karlsson M. Mitral Valve Mechanics (https://www.diva-portal.org/smash/get/diva2:896340/FULLTEXT01.pdf). 2015.
17. Timek T, Glasson JR, Dagum P, et al. Ring annuloplasty prevents delayed leaflet coaptation and mitral regurgitation during acute left ventricular ischemia. J Thorac Cardiovasc Surg. 2000;119:774-783.
18. Niczyporuk MA, Miller DC. Automatic tracking and digitization of multiple radiopaque myocardial markers. Computers and Biomedical Research. 1991;24:129-142.
19. Moon MR, DeAnda A, Daughters GT, Ingels NB, Miller DC. Experimental evaluation of different chordal preservation methods during mitral valve replacement. Ann Thorac Surg. 1994;58:931-944.
20. Beyar R, Sideman S, eds. Simulation and imaging of the cardiac system. Proceedings of the Henry Goldberg Workshop, held in Haifa, Israel, March 4-7, 1984. Martinus Nijhoff Publ, The Hague; 1985. Simulation and imaging of the cardiac system Proceedings of the Henry Goldberg Workshop, held in Haifa, Israel, March 4-7, 1984.
21. Pasipoularides A. Heart’s Vortex. Intracardiac Blood Flow Phenomena. Peoples Medical Publishing House – USA; 2010.
22. Jensen MO, Lemmon JD, Gessaghi VC, Conrad CP, Levine RA, Yoganathan AP. Harvested porcine mitral xenograft fixation: impact on fluid dynamic performance. J Heart Valve Dis. Jan 2001;10(1): 111-24.
23. Jensen H, Jensen MO, Smerup MH, et al. Impact of papillary muscle relocation as adjunct procedure to mitral ring annuloplasty in functional ischemic mitral regurgitation. Circulation. Sep 15 2009;120(11 Suppl):S92-8. doi:10.1161/CIRCULAT IONAHA.108.817833
24. Jensen MO, Hagege AA, Otsuji Y, Levine RA, Leducq Transatlantic MN. The unsaddled annulus: biomechanical culprit in mitral valve prolapse? Circulation. Feb 19 2013;127(7):766-8. doi:10.116 1/CIRCULATIONAHA.112.000628
25. Jensen MO, Jensen H, Levine RA, et al. Saddle-shaped mitral valve annuloplasty rings improve leaflet coaptation geometry. J Thorac Cardiovasc Surg. Sep 2011;142(3):697-703. doi:10.1016/j.jtcv s.2011.01.022
26. Askov JB, Honge JL, Jensen MO, Nygaard H, Hasenkam JM, Nielsen SL. Significance of force transfer in mitral valve-left ventricular interaction: in vivo assessment. J Thorac Cardiovasc Surg. Jun 2013;145(6):1635-41.
27. Jensen MO, Jensen H, Smerup M, et al. Saddle-shaped mitral valve annuloplasty rings experience lower forces compared with flat rings. Circulation. Sep 30 2008;118(14 Suppl):S250-5. doi:10.1161/CI RCULATIONAHA.107.746776
28. Nielsen SL, Timek TA, Green GR, et al. Influence of anterior mitral leaflet second-order chordae tendineae on left ventricular systolic function. Circulation. Jul 29 2003;108(4):486-91. doi:10.1161/01.CIR.0000080504.70265.05
29. Jimenez JH, Soerensen DD, He Z, He S, Yoganathan AP. Effects of a saddle shaped annulus on mitral valve function and chordal force distribution: an in vitro study. Annals of biomedical engineering. Nov 2003;31(10):1171-81.
30. Holmes JW, Hunlich M, Hasenfuss G. Energetics of the Frank-Starling effect in rabbit myocardium: economy and efficiency depend on muscle length. Am J Physiol Heart Circ Physiol. Jul 2002;283(1):H324-30. doi:10.1152/ajpheart.0068 7.2001
31. Suga HY, Goto Y, Igarashi Y, Yamada O, Nozawa T, Yasumura Y. Ventricular suction under zero source pressure for filling. Am J Physiol 251 (Heart Circ Physiol 20). 1986:H47-H55.
32. Yellin EL, Nikolic SD, Frater RW. Left ventricular filling dynamics and diastolic function. Prog Cardiovasc Dis. 1990;32:247-271.
33. Ingels NB, Jr., Daughters GT, 2nd, Nikolic SD, et al. Left atrial pressure-clamp servomechanism demonstrates LV suction in canine hearts with normal mitral valves. Am J Physiol. Jul 1994;267(1 Pt 2):H354-62.
34. Ingels NB, Jr., Daughters GT, Nikolic SD, et al. Left ventricular diastolic suction with zero left atrial pressure in open-chest dogs. Am J Physiol. Apr 1996;270(4 Pt 2):H1217-24.
35. Bolger AF, Heiberg E, Karlsson M, et al. Transit of blood flow through the human left ventricle mapped by cardiovascular magnetic resonance. Journal of Cardiovascular Magnetic Resonance. 2007;9:741-747.