

Leber’s Hereditary Optic Neuropathy vs. Optic Neuritis
Comparison of Patients with Leber’s Hereditary Optic Neuropathy Mutations to Patients with Other Optic Neuritis Manifestation Diseases
Marah Elkabouli 1,2, Mario Kontolemos 1,3, Vered Tsehmaister 1,3, Eduardo De Oliveira 1,3, Nerses Nersesyan 3, Hong-An Nguyen 1,2, Nooran Badeeb 5, Danah Alberiki 2,6, Carolina Rush 1,4, Rustum Karanjia 1,2
- Ottawa Hospital Research Institute, Ottawa, Ontario, Canada
- University of Ottawa Eye Institute, Ottawa, Ontario, Canada
- Radiology, The Ottawa Hospital, Ottawa, Ontario, Canada
- MS Clinic, Ottawa Hospital, Ottawa, Ontario, Canada
- Department of Surgery, Ophthalmology, University of Jeddah, Jeddah, Saudi Arabia
- King Fahad Medical City, Riyadh, Saudi Arabia
OPEN ACCESS
PUBLISHED: 31 May 2025
CITATION: Author1, X., Author2, Z., et al., 2025. Comparison of Patients with Leber’s Hereditary Optic Neuropathy Mutations to Patients with Other Optic Neuritis Manifestation Diseases. Medical Research Archives, [online] 13(5). https://doi.org/10.18103/mra.v13i5.6555
COPYRIGHT: © 2025 European Society of Medicine. This is an open-access article distributed under the terms of the Creative Commons Attribution License, which permits unrestricted use, distribution, and reproduction in any medium, provided the original author and source are credited.
DOI https://doi.org/10.18103/mra.v13i5.6555
ISSN 2375-1924
ABSTRACT
Background: The onset of vision loss in Leber’s Hereditary Optic Neuropathy (LHON) is often mistaken for other types of optic neuritis. This study compares the prevalence of brain imaging findings at time of onset in affected LHON patients and other types of optic neuritis; namely Clinically Isolated Syndrome, Multiple Sclerosis, Myelin Oligodendrocyte antibody, and Neuromyelitis Optica.
Methods: A masked analysis of MRIs from a group of genetically confirmed LHON patients was compared to MRIs from the sex and age-matched Optic Neuritis group. Brain imaging obtained within 12 months of the onset of visual loss were used.
Results: We identified 23 LHON patients with a total of 46 affected eyes. The average age at time of diagnosis was 45 ± 13.3 years old. Retrospective analysis of previously interpreted MRIs was completed and revealed that the most affected optic nerve segment was the optic chiasm (39.1%) followed by the orbital segment and optic tract each with 34.8% patient involvement. Canalicular involvement was observed in 29.2% of patients and intracranial segment involvement was observed in 17.2% of patients.
Ten of the 23 LHON identified patients were matched to their optic neuritis group based on age and sex. Eight males and two females with a total of 20 affected eyes were included. All patients had a confirmed genetic mutation with a median age of 33 (IQR 26 – 39) years (range 22 – 62 years) at time of diagnosis. The time interval from vision loss to MRI (TIVM) ranged from 1 to 12 months in all 20 affected eyes. The median TIVM was 1 (IQR 1 – 4) month. The ON group consisted of four patient groups based on diagnosis. We included ten patients with clinically isolated syndrome with thirteen affected eyes with a median age of 34.5 (IQR 25 – 44) years (range 15 – 57 ) at time of diagnosis, ten multiple sclerosis patients with eleven affected eyes and a median age of 32.5 (IQR 30 – 37) years (range, 22 – 65 years), ten myelin oligodendrocyte antibody patients with fourteen affected eyes and median age of 32.5 (IQR 30 – 41) years (range, 24 – 61 years) at time of diagnosis, and three neuromyelitis optica patients (2 males and 1 female) with four affected eyes; median age of 30 (IQR 25 – 45) years (range 25 – 45 years) at time of diagnosis.
Conclusion: Our results illustrate that chiasmal involvement is more common in LHON patients than in ON patients (specifically in the myeline oligodendrocyte antibody group) during the first year of vision loss p=0.057. Optic tract involvement was also more common in the LHON cohort compared to the optic neuritis cohort (specifically when compared the clinically isolated syndrome and multiple sclerosis groups) p=0.087 in both groups. White matter involvement was only seen in one LHON patient (in the periventricular region). When compared to the optic neuritis cohort, brain white matter involvement was seen in 70%, 80%, and 80% (p=0.02, p=0.006, and p=0.006) in each of the clinically isolated syndrome, multiple sclerosis and myeline oligodendrocyte antibody groups respectively. Brain white matter involvement was not observed in any of the neuromyelitis optica patients. Regression analysis revealed a slight trend that higher involvement might be associated with slightly worse visual acuity, but this trend is not statistically significant p = 0.246. Only one patient with an involvement along the optic chiasm presented with normal visual acuity of 20/30 and 20/40, right eye and left eye respectively.
Keywords
Leber’s Hereditary Optic Neuropathy, optic neuritis, MRI, visual acuity, brain imaging
1. Introduction
Leber Hereditary Optic Neuropathy (LHON) is a mitochondrial disorder causing bilateral vision loss often resulting in legal blindness. Approximately 90 – 95% of cases are linked to one of the following three primary mitochondrial DNA (mtDNA) point mutations: m14484T>C; most common in French Canadians, m11778G>A; most common in Northern Europe and Australia, and m3460G>A, all of which impair complex (I) in the electron transport chain (ETC).
Vision loss secondary to LHON is typically sudden and may initially mimic optic neuritis, leading to frequent misdiagnoses. LHON patients and optic neuritis (ON) manifestation disease patients secondary to Clinically Isolated Syndrome (CIS), Multiple Sclerosis (MS), Myelin Oligodendrocyte antibody (MOG), and Neuromyelitis Optica (NMO) often present with visual symptoms and optic disc characteristics that overlap each other.
In the acute stage, LHON presents with painless central vision loss, in one eye classically followed by the second eye within six to eight weeks, although bilateral simultaneous onset has been described. This sudden, central, subacute vision loss is similar to the one seen in ON patients secondary to CIS and MS, making clinical differentiation difficult at onset. In LHON, vision continues to degrade over a four to six week period with Snellen visual acuity (VA) dropping to 20/200 or worse. Patients also present with centrally dense or cecocentral scotomas and an obvious colour vision impairment. Furthermore, patients tend to have a relative preservation of pupillary reflex to light, and their dilated fundus exams reveal central retinal vessels tortuosity, and RNFL swelling. In about 20% of cases, normal optic discs can be observed and documented with functional vision loss. This natural history is often too late to allow a distinction between LHON and optic neuritis from other causes where early intervention with immunosuppression or plasmapheresis has the potential to preserve vision.
MRI findings not unique to these particular diseases are challenging to distinguish radiologically. Previous reports of LHON patients have demonstrated a hyperintense lesion in the optic nerve, optic chiasm on T2-weighted MRI and to a lesser extent, the optic tract involvement and some reports mentioned white matter changes mimicking the findings seen in MS patients. Other studies noted occasional enhancement in the subacute phase of the disease. Previous studies have reported optic nerve and optic chiasm lesions on T2-weighted MRIs and, in some cases, white matter changes that resemble MS patterns. Some patients can also be affected by both entities (LHON-MS) in a rare condition known as Harding syndrome. In a study where MRIs of patients with relapsing-remitting MS and Harding syndrome were analyzed by masked radiologists, both entities were found to be non-distinguishable by experts. The study also revealed that the majority of male patients with LHON who did not exhibit an MS-like illness presented with either normal brain MRIs or non-specific white matter lesions. Additionally, there was a strong relationship between female patients and positive radiological appearances of MS even if they had LHON alone. These studies are limited by the sample size as LHON has an incidence of 1:30,000 to 1:50,000. Furthermore, systematic comparisons between MRI findings in LHON and optic neuritis manifestation diseases (such as MS, MOG, and NMO) are lacking in the literature.
This study is novel and aims to systematically compare MRI findings in LHON with those in optic neuritis manifestation diseases to identify distinguishing imaging markers that could support earlier diagnosis, especially where genetic testing is inaccessible, and ultimately help feed the literature about LHON disease imaging manifestations.
2. Methods
2.1 – DATA COLLECTION
This is a retrospective chart review that evaluated a group of 23 genetically diagnosed LHON patients from the Department of Ophthalmology, The Ottawa Hospital Eye Institute, between Jan 1st, 2013, and Mar 31st, 2023. All patients had bilateral vision loss. Patients with other ocular conditions known to affect visual acuity or the optic nerve were excluded. LHON mutations were collected from previously completed mtDNA testing. From the 23 LHON patients, ten patients with available imaging within 12 months since onset of vision loss were age and sex-matched to ten patients in each of the following optic neuritis patient categories: CIS, MS, & MOG, in addition to a group of 3 NMO patients. This study was approved by the Research Ethics Board (REB) of the Ottawa Hospital Research Institute. Data collected from medical charts included gender, age at time of diagnosis, visual acuity (VA) at different stages of the disease and at the latest visit, mean deviation (MD) from visual field at different stages of the disease, retinal nerve fiber layer (RNFL) and ganglion cell complex (GCC) from optical coherence tomography (OCT) at different stages of the disease, and treatment.
2.2 – CONVERSION OF COUNTING FINGER VISUAL ACUITY TO LOGMAR
Snellen visual acuity was converted to the logarithmic of the minimum angle of resolution (logMAR). Counting Fingers (CF) VA was converted into logMAR using a previously developed formula that uses the width of the index, middle and ring fingers along with the interdigit distances of the examiner’s hand which, in total, approximates to 5’ of arc, similar to the large letter “E” on the Snellen chart.
2.3 – MRI PROTOCOL AND IMAGING REVIEW
The time interval from the onset of vision loss to MRI performance was documented; only patients with an MRI performed within twelve months of the onset of visual loss were included. Due to the retrospective nature of the study, specific MRI sequences and imaging planes that were available for review varied somewhat between cases. However, in all cases, T2-weighted images (either T2 or T2 FLAIR images) covering the optic pathways and brain were extracted and sent to readers for review for findings. In cases where dedicated coronal T2 weighted images through the optic nerves and chiasm were not available, reformatted 3D T2 or 3D T2 FLAIR images were reviewed by the radiologist readers. MRIs were evaluated by three masked neuro-radiologists, and an abnormality was considered present if at least two of three readers agreed to the presence of a T2 hyperintensity. The three readers consisted of two attending neuroradiologists (with 9 and 7 years’ of clinical experience) and one neuroradiology fellow.
2.4 – STATISTICS
Descriptive statistics were expressed as median (interquartile range, IQR) for nonnormally distributed continuous variables, whereas numbers and percentages were presented for categorical variables. The Fisher’s exact test was used to analyze differences in categorical variables. A 2-tailed P value of less than 0.05 was considered significant for all. A regression analysis was used to determine the correlation between VA, and each of MD, RNFL thickness, GCC, and the level of optic nerve involvement.
3. Results
3.1 – DEMOGRAPHIC AND BASELINE DATA
Clinical data of 23 patients; 17 males and 6 females, with a total of 46 affected eyes was included. The average age at time of diagnosis was 45 ± 13.3 years old. The average worst peak BCVA in this group was 2.01 ± 0.64 logMAR ranging from 3.77 to 0.30 logMAR. The average BCVA at final visit was 1.63 ± 0.70 logMAR ranging from 2.81 to 0.00 logMAR.
Retrospective analysis of previously interpreted MRIs was completed and revealed that the most affected optic nerve segment was the optic chiasm (39.1%) followed by the orbital segment and optic tract each with 34.8% patient involvement. Canalicular involvement was observed in 29.2% of patients and intracranial segment involvement was observed in 17.2% of patients.
The prospective imaging analysis study included 10 patients in the LHON cohort with a female to male ratio of 1:4 and a total of 20 affected eyes. All patients had a confirmed genetic mutation with a median age of 33 (IQR 26-39) years (range 22 – 62 years) at the time of diagnosis. The TIVM ranged from 1 to 12 months in all 20 affected eyes, but the median TIVM was 1 with an inter quartile range of 1-4 months. The ON group consisted of 10 CIS patients with 13 affected eyes and median age of 34.5 (IQR 25 – 43) years (range, 15 – 57 years), 10 MS patients with 11 affected eyes and median age of 32.5 (IQR 30-37) years (range, 22 – 65 years), 10 MOG patients with 14 affected eyes and median age was 32.5 (IQR 30-41) years (range, 24-61 years) at time of diagnosis. Each group had a female to male ratio of 1:4. We also matched 3 NMO patients (2 males and 1 female) with 4 affected eyes and median age of 30 (IQR 25 – 45) years (range 25 – 45 years) at time of diagnosis.
Summary of LHON Mitochondrial Mutations
| Primary mtDNA Mutation | Total No. of Patients |
|---|---|
| m.11778G>A | 8 |
| m.14484T>C | 9 |
| m.3460G>A | 1 |
| m.3697G>A | 1 |
| m.6951 | 1 |
| m.3388 | 1 |
| m.11420 | 1 |
Table 1: Summary of mtDNA mutations in the LHON group. *One patient tested positive for an atypical variant with a toxic nutritional component not previously reported in the literature.
Demographics and Visual Acuity
| Group | LHON N = 10 | CIS N = 10 | MS N = 10 | MOG N = 10 | NMO N = 3 |
|---|---|---|---|---|---|
| Average Age at Time of Diagnosis | 39.5 | 38.0 | 39.7 | 38.4 | 34.7 |
| Age Range at Time of Diagnosis | 22 – 62 | 25 – 57 | 22 – 65 | 24 – 61 | 25 – 45 |
| Female to male ratio | 1:4 | 1:4 | 1:4 | 1:4 | 1:2 |
| Range BCVA a lowest Point (logMAR) | 3.77 – 0.30 | HM – (-0.10) | LP – 0.00 | LP – 0.00 | LP – 0.00 |
| Range BCVA at final visit (logMAR) | 2.81 – 0.00 | 0.18 – (-0.10) | 0.30 – 0.00 | 0.30 – 0.00 | HM – 0.00 |
Table 2: Summary of baseline age, gender and visual acuity data comparing the LHON cohort to each group in the optic neuritis cohort. BCVA is best corrected visual acuity.
3.2 – IMAGING FINDINGS
Three masked neuro-radiologists reported their findings. Reader agreement among all three-radiologists was 63%, 82%, 64%, 69% and 77% in each of LHON, CIS, MS, MOG and NMO groups respectively. In the LHON group, the readers had 60% agreement on the orbital segment, 50% canalicular segment, 45% intracranial segment, 80% chiasm, 50% optic tract, and 60% WM. In the CIS group, the readers had 50% agreement on the orbital segment, 50% canalicular segment, 50% intracranial segment, 85% chiasm, 95% optic tract, and 80% WM. In the MS group, the readers had 40% agreement in the orbital segment, 35% canalicular segment, 35% intracranial segment, 80% chiasm, 70% optic tract, and 60% WM. In the MOG group, the readers had 50% agreement in the orbital segment, 45% canalicular segment, 50% intracranial segment, 70% chiasm, 70% optic tract, and 60% WM. In the NMO group, the readers had 67% agreement in the orbital segment, 83% canalicular segment, 67% intracranial segment, 67% chiasm, and 100% optic tract. There was no agreement between the 3 readers regarding brain WM involvement in the NMO group. Agreement between at least 2 readers was available 100% of the time.
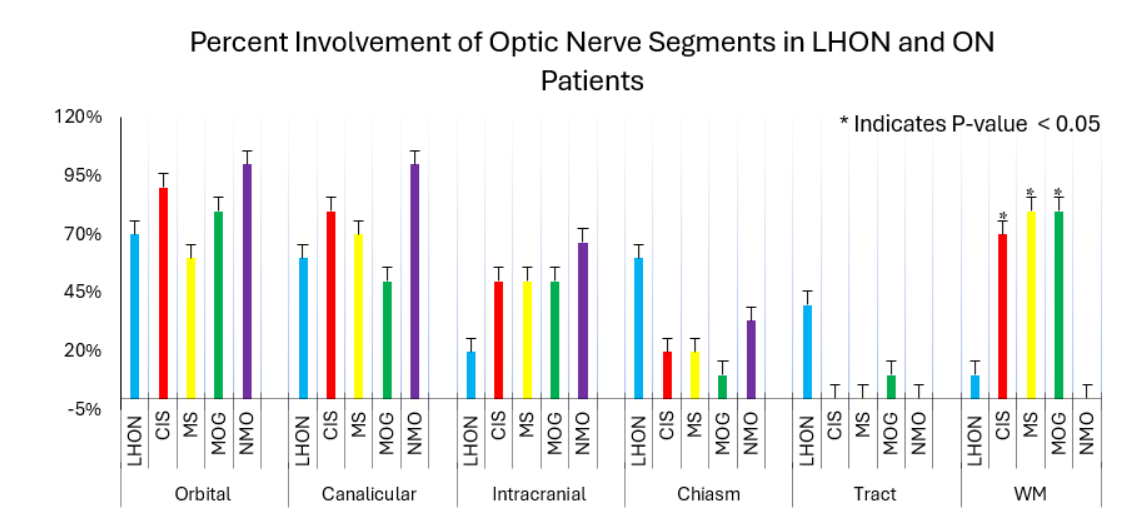
In the prospective cohort, T2 hyperintensity was present in a total of 18 out of 20 eyes in the LHON group and in 38 out of 41 eyes in the ON group. T2 hyperintensity involvement of the orbital segment was observed in 11 eyes with LHON, 10 eyes with CIS, 6 eyes with MS, 7 eyes with MOG antibody disease, and 3 eyes with NMO. In the canalicular segment, involvement was noted in 8 eyes with LHON, 8 eyes with CIS, 8 eyes with MS, 7 eyes with MOG, and 3 eyes with NMO. The intracranial segment involvement was observed in 4 eyes with LHON, 5 eyes with CIS, 5 eyes with MS, 4 eyes with MOG, and 2 eyes with NMO. Chiasmal involvement was observed in 12 eyes with LHON, 4 eyes with CIS, 4 eyes with MS, 2 eyes with MOG, and 2 eyes in NMO. Optic tract involvement was observed in 8 eyes with LHON, and 2 eyes in the MOG group. No optic tract involvement was observed in CIS, MS or NMO patients.
In the CIS group, two patients with only one clinically affected eye exhibited a T2 hyperintensity in the contralateral eye (without optic neuritis) along the canalicular segment. In the MS group, a T2 hyperintensity in the contralateral eye was observed in 6 patients along the orbital segment (3 patients), canalicular segment (6 patients), and the intracranial segment (2 patients). In the MOG group, a T2 hyperintensity in the contralateral eye was observed in one patient along the intracranial segment. The presence of a hyperintensity in the contralateral eye in the optic neuritis group was not included in the analysis.
In the LHON group, brain white matter involvement was observed in only one patient who presented with several 5-10 mm confluent lesions along the periventricular region with the largest lesion being >10 mm. Among the optic neuritis group, 7 CIS patients presented with brain WM involvement, predominantly along the subcortical and periventricular regions. Among the MS group, 8 patients presented with brain white matter involvement with the most common regions being the subcortical first and periventricular second. In the MOG group, 8 patients presented with brain white matter involvement with the most common involved regions being the subcortical first and periventricular second. In the NMO group, no brain WM involvement was seen in any of the 3 patients.
3.3 – T2 Hyperintensity Manifestation in LHON, NMO and MS patients
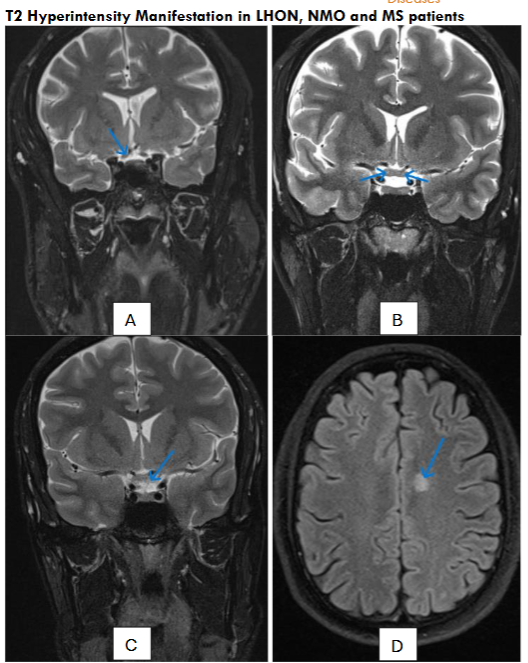
Nine LHON patients exhibited a T2 hyperintensity along multiple segments across the pregeniculate pathway except for one patient who exhibited a normal MRI. In five patients with the 11778G>A genetic mutation, the average TIVM was 6 months and all patients with this mutation presented with a T2 hyperintense signal somewhere along the visual pathway. In the ten eyes that were affected, orbital segment involvement was observed in 5 eyes, canalicular segment involvement was observed in 6 eyes, intracranial segment involvement was observed in 4 eyes, chiasmal involvement was observed in 8 eyes, and optic tract involvement was observed in 4 eyes. In four patients with the 14484T>C genetic mutation, the average TIVM was 2.4 months. Of these eight eyes, orbital segment involvement was observed in 5 eyes, canalicular segment involvement was observed in 2 eyes, chiasmal involvement was observed in 2 eyes, and optic tract involvement was observed in 2 eyes. Intracranial segment involvement was not observed in any of these eyes. Only one patient with the genetic m.3460 mutation was included in the study which presented involvement along the whole pregeniculate pathway sparing the intracranial segment.
Optic Nerve Segment Involvement Across LHON Mutations
| m.11778G>A N = 9 | m.14484T>C N = 8 | m.3460G>A N = 1 | m.3697G>A N = 1 | m.6951 N = 1 | m.3388 N = 1 | m.11420 N = 1 |
|---|---|---|---|---|---|---|
| Orbital | 3 | 2 | 1 | 0 | 0 | 1 |
| Canalicular | 2 | 3 | 1 | 0 | 0 | 1 |
| Intracranial | 2 | 0 | 0 | 0 | 0 | 1 |
| Chiasm | 4 | 3 | 1 | 0 | 0 | 1 |
| Tract | 2 | 4 | 1 | 0 | 0 | 1 |
Table 3: Summary of T2 hyperintensity involvement along the optic nerve in relation to the type of LHON mutation.
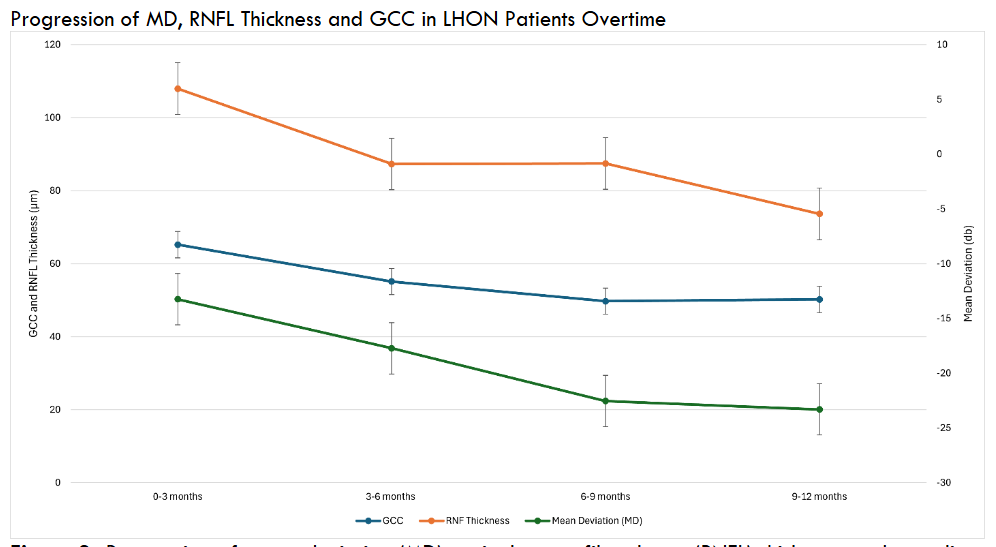
3.4 – MEAN DEVIATION, RETINAL NERVE FIBER LAYER THICKNESS, AND GANGLION CELL COMPLEX ANALYSIS FINDINGS
3.5 – VISUAL ACUITY REGRESSION ANALYSIS
Simple linear regression analysis was conducted for the retrospective LHON group to determine the effect of optic nerve involvement level, ganglion cells complex analysis (GCC), retinal nerve fiber layer (RNFL) and mean deviation (MD) on visual acuity. The regression model was not statistically significant for the level of optic nerve involvement p = 0.246. Analysis revealed a weak, negative relationship between GCC and visual acuity, however the result was not statistically significant, p =0.144. RNFL analysis illustrates that for every 1µm decrease in RNFL, the visual acuity decreases by approximately 0.0098 logMAR. Although this relationship is not statistically significant, p =0.072, it suggests that RNFL may be a more relevant biomarker for VA in LHON than GCC and level of optic nerve involvement. Finally, the regression analysis comparing VA and MD revealed a statistically significant relationship p=0.039 where for every 1 decibel (db) decrease in MD, visual acuity worsens by 0.02 logMAR.
Simple regression analysis for the level of optic nerve involvement was also conducted for the prospective LHON cohort and the ON group. The regression model for the LHON group did not reach statistical significance, F(1,18) = 0.22, p = 0.647, indicating that MRI involvement was not a significant predictor of peak worst visual acuity. The coefficient for MRI involvement was β = 0.05, 95% CI [–0.17, 0.27]. The model explained only 1.2% of the variance (R² = 0.01), suggesting a negligible and non-significant association between MRI involvement and visual acuity outcomes in this group. The regression model for the CIS group did not reach significance, F(1,9) = 0.02, p = 0.983. The MRI involvement coefficient was β = 0.02, 95% CI [–1.72, 1.75], with an R² of 0.05, suggesting that MRI involvement was not predictive of visual acuity outcomes in this group. The regression model for the MS group was not statistically significant, F(1,9) = 0.52, p = 0.491, indicating that MRI involvement did not significantly predict peak work visual acuity. The coefficient for MRI involvement was β = 0.27, 95% CI [–0.58, 1.13]. The model explained only 5.4% of the variance (R² = 0.05), suggesting a weak, non-significant association. Finally, the regression model for the MOG group was statistically significant, F(1,12) = 9.76, p = 0.009. MRI involvement was a significant predictor of peak worst visual acuity, with a coefficient of β = 0.57, 95% CI [0.17, 0.97]. The model accounted for 44.9% of the variance in visual acuity scores (R² = 0.45), indicating a moderate-to-strong effect.
Multiple and simple regression analyses were conducted to assess the relationship between MD values, optic nerve involvement level, and the outcome variable across the LHON, CIS, MS, and MOG groups. In the LHON group, the multiple regression model was statistically significant (R² = 0.380, p = 0.035), explaining a moderate proportion of variance in the outcome. MD (p = 0.019) emerged as a significant negative predictor, while optic nerve involvement did not contribute meaningfully (p = 0.309). The corresponding simple regression model including only MD also demonstrated a significant association (R² = 0.330, p = 0.016), reinforcing the importance of MD as a single predictor in this group. In the CIS group, the multiple regression model was not statistically significant (R² = 0.157, p = 0.504), with neither MD (p = 0.312) nor involvement (p = 0.812) contributing meaningfully. The simple regression model including only MD similarly showed no significant association (R² = 0.151, p = 0.238). For the MS group, the multiple regression model explained a modest proportion of variance (R² = 0.206, p = 0.452), with MD (p = 0.297) and involvement (p = 0.465) both remaining non-significant. The corresponding simple regression model using only MD yielded a comparable R² value of 0.138 and was not statistically significant (p = 0.290). In the MOG group, the multiple regression model explained a greater proportion of variance (R² = 0.221, p = 0.325), with involvement approaching significance (p = 0.148), while MD remained non-significant (p = 0.617). The simple regression model using only MD in the MOG group was not significant (R² = 0.004, p = 0.836), indicating that involvement contributed more substantially to the variance explained in this group.
Multiple and simple regression analyses were conducted to assess the relationship between RNFL thickness, optic nerve involvement level, and the outcome variable across the LHON, CIS, MS, and MOG groups. In the LHON group, the multiple regression model was not statistically significant (R² = 0.232, p = 0.304), with neither RNFL (p = 0.169) nor involvement (p = 0.278) contributing significantly. The corresponding simple regression model using only RNFL also failed to reach significance (R² = 0.119, p = 0.273), suggesting limited explanatory value of RNFL thickness in isolation or combined with involvement for predicting the outcome in this group. In the CIS group, the multiple regression model was not statistically significant (R² = 0.013, p = 0.974), with neither RNFL thickness (p = 0.829) nor involvement (p = 0.853) contributing meaningfully. The simple regression model including only RNFL similarly showed no significant association (R² = 0.003, p = 0.900). For the MS group, the multiple regression model explained a moderate proportion of variance (R² = 0.469, p = 0.206), with RNFL trending toward significance (p = 0.097) and involvement remaining non-significant (p = 0.781). The corresponding simple regression model including only RNFL yielded a comparable R² value of 0.460 and approached statistical significance (p = 0.065). In contrast, the MOG group demonstrated a statistically significant multiple regression model (R² = 0.576, p = 0.049), with optic nerve involvement emerging as a significant predictor (p = 0.021), and RNFL showing a near-significant negative association (p = 0.053). However, the simple regression model using only RNFL in the MOG group was not significant (R² = 0.040, p = 0.578), indicating that involvement substantially improved the explanatory power of the model in this group.
GCC was only documented in a small group of patients in each cohort and was thus insufficient for a regression analysis.
4. Discussion
Our results reveal that optic chiasm and tract involvement appeared more commonly in the LHON group than in the CIS, MS, MOG, and NMO groups. Specifically, T2 hyperintensity was observed in the optic chiasm in 60% of LHON patients compared to 20% in CIS and MS, 10% in MOG, and 0% in NMO, although these differences did not reach statistical significance (LHON vs. CIS: p = 0.1698; LHON vs MS: p = 0.1698; LHON vs. MOG: p = 0.0573). Similarly, optic tract involvement was observed in 40% of LHON cases but was absent in both CIS and MS groups (p = 0.0867), and minimal in MOG (10%) and NMO (0%) groups. This trend suggests that LHON more commonly affects posterior optic pathway in contrast to inflammatory optic neuritis secondary to CIS, MS and MOGAD, which typically demonstrate more prominent lesions along the anterior optic nerve segments. This contrasts with a previous study that reported T2 hyperintensities extending beyond the intraorbital segment into the optic chiasm and tract in a subset of LHON patients, with only 8 of 82 affected eyes showing involvement along the optic chiasm and only 4 out of 82 affected eyes showing involvement along the optic tract.
Our results reinforce the theory that LHON associated optic neuropathy exhibits a unique posterior extension pattern that may help in differential diagnosis. The distinct vulnerability of the optic chiasm and tract in LHON patients may be explained partially by anatomical and developmental features of these structures. The examination of axonal distribution according to diameter observed in adult hooded rats revealed that the optic tract, particularly in the dorsal regions, contains higher density of coarse (larger diameter) axons compared to other regions of the optic nerve. This hallmark suggests particular vulnerability to mitochondrial dysfunction due to the metabolically demanding coarse axons. Additionally, during development, retinal ganglion cell (RGC) axons undergo critical changes as they progress beyond the optic chiasm and into the optic tracts including defasciculation and shifts in their position relative to the pial surface. These transitions, even on a microstructural level may create localized environments more susceptible to metabolic stress and degeneration.
More importantly, the timing of MRI imaging relative to the onset of vision loss plays a critical role in interpreting observed patterns. Early imaging may not capture the full extent of neural involvement due to evolving processes like retrograde trans-synaptic degeneration (RTSD), where post-retinal structures undergo delayed degeneration following retinal ganglion cell death. A pivotal study that observed the progressive thinning of the RNFL post occipital lobe and optic radiation damage due to stroke revealed that RTSD in the human visual system can be detected using optical coherence tomography (OCT). They observed that patients with lesions in the occipital cortex exhibited thinning of the retinal nerve fiber layer (RNFL) and ganglion cell layer, indicative of RTSD. This degeneration was noted to be a slow and silent process, often occurring without immediate clinical symptoms, and could be visualized months after the initial cortical injury. Similarly, white matter abnormalities may emerge over time as a result of secondary demyelination or metabolic stress affecting oligodendrocytes, particularly in mitochondrial diseases like LHON. As such, early MRI scans might underestimate the burden of neural injury, and follow-up imaging could provide a more accurate assessment of disease progression and spatial extension. This temporal dynamic in lesion evolution is especially relevant in distinguishing LHON from demyelinating disorders such as MS and MOG, where lesions may be more visible acutely. In our study, MRI scans were performed within the first month of vision loss in five patients, at two months in one patient, at four months in two patients, at nine months in one patient, and at twelve months in another. These varying intervals highlight the importance of accounting for imaging timing when comparing structural findings across disease entities.
Our results also indicate significant differences in brain WM involvement between the LHON and the optic neuritis group as supported by p-values. LHON WM involvement compared to each of CIS, MS, and MOG yielded p=0.02, p=0.006, and p=0.006 respectively. These findings highlight possible imaging biomarkers for differentiating LHON from optic neuritis associated diseases. WM involvement is pronounced in MS when compared to LHON, where the LHON patients show only minor white matter changes. This aligns with the existing literature that suggests MS is characterized by WM lesions, while LHON may present with normal or non-specific WM findings. This difference can also help in the differential diagnosis, especially in the early stages. This study also reported T2 hyperintense white matter lesions in approximately 26% of patients with LHON which ranged from 2-20 lesions and were typically small (2–5 mm; with one lesion measuring 15mm). In comparison, we observed such lesions in only one of ten patients (10%) in our LHON cohort. This patient presented with several confluent lesions which ranged from 1-10 and were 3 to 10 mm in size along the periventricular region, with the largest lesion exceeding 10 mm. While this pattern shares anatomical overlap with MS-prone regions, the patient was still correctly diagnosed as an LHON patient by our readers. Notably, although one reader in our study reported fewer than five lesions and the other estimated five to ten, both agreed on the presence of T2 hyperintense white matter involvement. This inter-rater agreement highlights the subtle subjectivity involved in lesion quantification, adding to the growing evidence that, although white matter lesions may be present in a subset of LHON patients, their characteristics are distinct from demyelinating pathologies and should be interpreted with more attention in clinical assessment. This study also evaluated patients with LMS (MS-like disease in association with LHON) who presented with a wider range of lesions that exceeded 20 at times, with three patients presenting with confluency. Lesion sizes were also generally larger in LMS patients which ranged from 2-25 mm. This was similar to the findings in our study where 80% of our MS cohort presented with WM; two of which had less than five lesions, three had 5-10 lesions, and three had more than ten lesions. Subcortical involvement was seen in all eight patients with WM involvement, periventricular involvement was seen in five patients, subcallosal/callosal involvement was seen in four patients, cortical/juxtacortical involvement was seen in two patients, and peritentorial involvement was seen in two patients. None of these patients presented with confluent lesions.
This study also looked at how multiple factors such as optic nerve involvement level, MD, RNFL, and GCC can impact VA in each group. Our results demonstrate MD as the most consistent predictor of visual acuity in the LHON where it showed a significant negative association (p = 0.019). RNFL thickness also appeared important in the LHON and MS groups, where it approached statistical significance (p=0.072, p = 0.065) respectively, which suggests that it may be a useful marker of structural damage in some optic neuropathies. Optic nerve involvement on MRI was only significantly associated with VA in the MOG group. GCC showed a negative trend with VA in LHON but was not significant. Overall, these findings suggest that different markers vary in their predictive value depending on the condition and that a multi-modal, diagnosis specific approach may be helpful when assessing visual outcomes in patients with optic neuropathies.
The strength of this study is that all the MRIs were age and sex matched to the LHON subjects and reread by the same group of neuroradiologists who were masked to the clinical diagnosis of the patients. The study does have several limitations including retrospective data collection, heterogeneous LHON patients’ population, and the small sample size especially in the NMO subgroup. Regardless, the findings of a distinct clinical pattern in MRI findings of LHON patients is novel. Misdiagnosis with MS and the inappropriate administration of steroids can complicate LHON progression, as indicated in previous studies where patients were empirically treated for optic neuritis before an LHON diagnosis. Establishing early and accurate radiologic indicators, such as limited brain WM, chiasmal and tract involvement in LHON patients could mitigate unnecessary treatments and ultimately allow timely management.
5. Conclusion
In conclusion, our findings suggest that structural MRI involvement patterns vary significantly between LHON and optic neuritis-related diseases. LHON patients showed more involvement along the optic chiasm and tract, while brain white matter involvement was far more common in ON secondary to CIS, MS, and MOG. White matter lesions were not observed in NMO patients. While a trend toward worsening visual acuity was noted with greater involvement along the optic nerve, this was not statistically significant. Among the imaging and functional markers examined, MD consistently demonstrated the strongest association with visual acuity in LHON, highlighting its potential to serve as a functional biomarker. RNFL thickness also approached a statistically significant relationship with VA in LHON and MS, which suggests that it can be a more relevant structural marker than GCC or optic nerve involvement level in certain subtypes. Our study also revealed that in MOG, optic nerve level involvement was a significant predictor of visual outcomes, indicating that its role in visual prognosis may be disease specific. These results support a tailored, disease specific approach when interpreting MRI and OCT, and visual field findings when evaluating visual prognosis.
References
- Yu-Wai-Man P, Griffiths PG, Chinnery PF. Mitochondrial optic neuropathies – Disease mechanisms and therapeutic strategies. Progress in Retinal and Eye Research. 2011;30(2):81-114. doi:https://doi.org/10.1016/j.preteyeres.2010.11.002
- Batioglu F, Atilla H, Eryilmaz T. Chiasmal High Signal on Magnetic Resonance Imaging in the Atrophic Phase of Leber Hereditary Optic Neuropathy. Journal of Neuro-Ophthalmology. 2003;23(1). doi:10.1097/00041327-200303000-00007
- Blanc C, Heran F, Habas C, Bejot Y, Sahel J, Vignal-Clermont C. MRI of the Optic Nerves and Chiasm in Patients with Leber Hereditary Optic Neuropathy. Journal of Neuro-Ophthalmology. 2018;38(4):434-437. doi:10.1097/WNO.0000000000000621
- Zhao J, Zhang Q, Wang J. Magnetic Resonance Imaging Findings in the Pregeniculate Visual Pathway in Leber Hereditary Optic Neuropathy. Published online 2021. doi:10.1097/WNO.0000000000001383
- Matthews L, Enzinger C, Fazekas F, et al. MRI in Leber’s hereditary optic neuropathy: the relationship to multiple sclerosis. Journal of Neurology, Neurosurgery, and Psychiatry. 2015;86(5):537-542. doi:https://doi.org/10.1136/jnnp-2014-308186
- Mascialino B, Leinonen M, Meier T. Meta-analysis of the prevalence of Leber hereditary optic neuropathy mtDNA mutations in Europe. European Journal of Ophthalmology. 2012;22(3):461-465. doi:10.5301/ejo.5000055
- Karanjia R, Hwang TJ, Chen AF, Pouw A, Tian JJ, Chu ER, Wang MY, Tran JS, Sadun AA. Correcting Finger Counting to Snellen Acuity. Neuroophthalmology. 2016 Aug 22;40(5):219-221. doi:10.1080/01658107.2016.1209221. PMID: 27928408; PMCID: PMC5122922.
- Zhao J, Zhang Q, Wang J. Magnetic Resonance Imaging Findings in the Pregeniculate Visual Pathway in Leber Hereditary Optic Neuropathy. Published online 2021. doi:10.1097/WNO.0000000000001383
- La Morgia C, Cascavilla ML, De Negri AM, et al. Recognizing Leber’s Hereditary Optic Neuropathy to avoid delayed diagnosis and misdiagnosis. Frontiers in Neurology. 2024;15. doi:https://doi.org/10.3389/fneur.2024.1466275
- Bargiela D, Chinnery PF. Mitochondria in neuroinflammation – Multiple sclerosis (MS), leber hereditary optic neuropathy (LHON) and LHON-MS. Neuroscience Letters. 2019;710. doi:10.1016/j.neulet.2017.06.051
- Reese, B. E. (1987). The distribution of axons according to diameter in the optic nerve and optic tract of the rat. Neuroscience, 22(3), 1015–1024. https://doi.org/10.1016/0306-4522(87)92977-0
- Kruger, K., Tam, A. S., Lu, C., & Sretavan, D. W. (1998). Retinal ganglion cell axon progression from the optic chiasm to initiate optic tract development requires cell autonomous function of GAP-43. The Journal of Neuroscience, 18(15), 5692–5705. https://doi.org/10.1523/jneurosci.18-15-05692.1998
- Jindahra, P., Petrie, A., & Plant, G. T. (2012a). The time course of retrograde trans-synaptic degeneration following occipital lobe damage in humans. Brain, 135(2), 534–541. https://doi.org/10.1093/brain/awr324
- Zhi, J.-J., Wu, S.-L., Wu, H.-Q., Ran, Q., Gao, X., Chen, J.-F., Gu, X.-M., Li, T., Wang, F., Xiao, L., Ye, J., & Mei, F. (2023). Insufficient oligodendrocyte turnover in optic nerve contributes to age-related axon loss and visual deficits. The Journal of Neuroscience, 43(11), 1859–1870. https://doi.org/10.1523/jneurosci.2130-22.2023