

Lower Limit of Cerebral Autoregulation in Cardiac Surgery
An Illustrated Explanation of the Lower Limit of Cerebral Autoregulation and the Clinical Significance of Its Monitoring during Cardiac Surgery
Benjamin Gavish, PhD 1; Jochen Steppan2
- School of Medical Engineering, Afeka Tel-Aviv Academic College of Engineering in Tel Aviv, Israel
- Johns Hopkins University, Department of Anesthesiology and Critical Care Medicine, Baltimore, MD, USA
OPEN ACCESS
PUBLISHED: 30 November 2024
CITATION: Gavish, B., and Steppan, J., 2024. TITLE HERE. Medical Research Archives, [online] 12(11). https://doi.org/10.18103/mra.v12i11.5862
DOI https://doi.org/10.18103/mra.v12i11.5862
ISSN 2375-1924
Abstract
Autoregulation of cerebral blood flow is a vital function that guarantees that cerebral blood flow is being maintained over a wide range of blood pressure values. The matching between cerebral blood flow and the cerebral metabolic requirements involves vasodilation/constriction of the cerebral arterioles in response to decrease/increase of the cerebral perfusion pressure, respectively. The lower limit of cerebral autoregulation is defined as the mean arterial pressure below which cerebral blood flow becomes pressure passive. Keeping blood pressure within the cerebral autoregulatory range for patients undergoing cardiac surgery has been shown to improve postoperative outcomes. The objective of this article is to summarize the results of recent studies that may enable us to estimate the lower limit of cerebral autoregulation to reduce the risk of cerebral hypoperfusion.
Keywords
- cerebral autoregulation
- cerebral blood flow
- cardiac surgery
- mean arterial pressure
- cerebral hypoperfusion
Introduction
The brain is the most energy-demanding organ in the body accounting for 20% of the body’s resting energy consumption but weighing only 2% of the total body mass. Its function requires high stability under fluctuations in the internal and external environment. More specifically, the insensitivity of cerebral blood flow (CBF) to naturally occurring arterial pressure changes, called ‘CBF autoregulation’, is a vital function expressed by the observed relationship between CBF and the mean arterial pressure (MAP) depicted in the upper panel of
. This relationship includes the desired cerebral autoregulation range, in which CBF is actively controlled and remains relatively stable in a limited range of mean arterial pressure values; a lower-pressure range, in which CBF is reduced passively with further reductions in blood pressure, displaying the so-called ‘pressure passivity’ and similarly, a higher-pressure range, at which CBF increases passively upon further blood pressure elevation. The matching between CBF and the cerebral metabolic requirements involves vasodilation/constriction of the cerebral arterioles in response to decrease/increase of the cerebral perfusion pressure, respectively. This process, which is mediated by changes in the tone of the arteriolar smooth muscles, is referred to as cerebral pressure autoregulation.
The ‘lower limit of cerebral autoregulation’ marks the mean arterial pressure value at the borderline between the lower-pressure passive and autoregulated ranges, as depicted in the lower panel of
. Quantitatively, starting with mean arterial pressure at the lower-pressure passive range, lower limit of cerebral autoregulation is defined as the mean arterial pressure value above which the Pearson correlation coefficient between CBF and mean arterial pressure change drops below a pre-selected value. It is important to mention that cerebral autoregulation is effective for slow enough variations in mean arterial pressure, typically over the frequency range 0.05 Hz to 0.003 Hz, which leads to the ‘static view’ of cerebral autoregulation presented in
. Keeping mean arterial pressure within the cerebral autoregulatory range for patients undergoing cardiac surgery is most important in the perioperative setting. It appears that during cardiopulmonary bypass the duration and magnitude of mean arterial pressure values below the cerebral autoregulatory range are associated with major morbidity and operative mortality. The problem of high blood pressures that may result in cerebral edema is beyond the scope of this paper.
What is the clinical problem?
We traditionally have assumed a lower limit of cerebral autoregulation of 50mmHg and an upper limit of 150 mmHg for mean arterial pressure. However, more recent studies have questioned this traditional view of the autoregulatory range. Since CBF autoregulation is functional during cardiopulmonary bypass, mean arterial pressure targets of 50 to 60 mmHg have been empirically chosen and are modified depending on patient age, preoperative blood pressure, or medical history. One out of many reasons for the variability in the limits of the normal CBF autoregulation range is surgical patients having cerebral vascular disease that may predispose them to cerebral ischemic injury. The lower limit of cerebral autoregulation of individual patients measured during surgery and anesthesia varies over the range of 40 to 90 mmHg. These findings question the validity of the said assumed mean arterial pressure target, and strongly suggest measuring or estimating the lower limit of cerebral autoregulation during cardiopulmonary bypass. Thus, success in selecting mean arterial pressure targets, to be within a patient’s individual autoregulatory range, might prevent cerebral hypoperfusion. However, measuring the lower limit of cerebral autoregulation requires special equipment, which is likely to decrease the applicability of such measurement, despite its clinical significance.
How to determine the lower limit of cerebral autoregulation?
The lower limit of cerebral autoregulation was determined by Bradly et al, and by Joshi et al, using CBF velocity measured by transcranial Doppler monitoring of the right and left middle cerebral artery simultaneously with direct continuous radial artery monitoring of arterial pressure, and near-infrared spectroscopy (NIRS) via self-adhesive sensors placed on the right and left forehead. Analysis included the following steps: 1) filtering out frequencies greater than 0.04-0.05 Hz and below 0.003 Hz that are used to improve the signal-to-noise ratio and are believed to represent autoregulatory compensations to slow hemodynamic oscillations. 2) calculating consecutive and paired 10-second averaged values of filtered arterial pressure to obtain the mean arterial pressure, CBF velocity and NIRS values at 30 time points over a moving time window of 300 sec. 3) calculating the Pearson correlation coefficient (R) between mean arterial pressure and CBF velocity or NIRS at those time points. 4) Attributing R≥R0 to pressure passivity and R
How to estimate the lower limit of cerebral autoregulation?
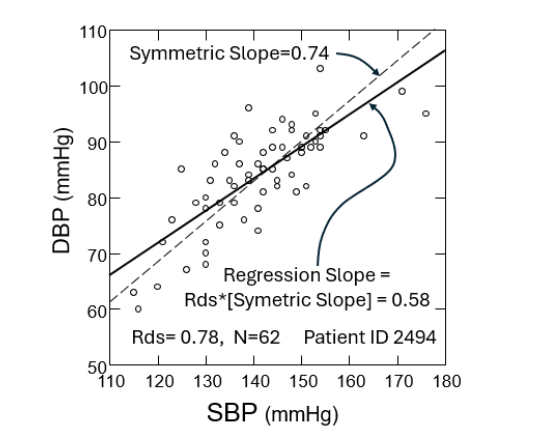
The simplest association between the lower limit of cerebral autoregulation (LLA) and a Predictor can be expressed by the regression model LLA = α+β·[Predictor] where α & β are adjustable parameters determined from the measured lower limit of cerebral autoregulation and the Predictor values for the patients’ population by univariate regression analysis. Given a Predictor value the estimated lower limit of cerebral autoregulation (‘est_LLA’) is given by est_LLA = α+β·[Predictor], which is the so-called ‘regression line’. This estimation is meaningful if the Pearson correlation coefficient R between the lower limit of cerebral autoregulation and the Predictor is statistically significant. Obata et al investigated the lower limit of cerebral autoregulation association with a Predictor called ‘ambulatory arterial stiffness index’ (AASI). AASI was originally calculated from 24-hour ambulatory systolic blood pressure and diastolic blood pressure measurements, and was demonstrated to be a predictor of cardiovascular mortality. The AASI is defined as 1 minus the regression slope of diastolic over systolic blood pressure readings. Analytic derivation of the Regression Slope shows that it equals Rds·[Symmetric Slope], where Rds is the Pearson correlation coefficient between diastolic blood pressure (DBP) and systolic blood pressure (SBP) readings, and the ‘Symmetric Slope’ is the Slope of the dashed line given by SD(DBP)/SD(SBP). The Symmetric Slope best fits the slope of a linear relationship between diastolic and systolic blood pressure, and was shown to be an arterial property, as its reciprocal value expresses the pressure dependence of the arterial stiffness (‘stiffening’). Obata et al determined AASI from intraoperative continuous blood pressure readings measured directly from the radial artery before the initiation of cardiopulmonary bypass, while Zhang et al used it during non-cardiac surgery. Hereafter, we will replace AASI with 1-AASI to achieve a negative correlation with the lower limit of cerebral autoregulation.
In addition to AASI, independent Predictors associated with the lower limit of cerebral autoregulation in a statistically significant way were recently found by Gavish et al, using the data of 181 patients, who received routine intraoperative care, reported by Obata et al. These Predictors included the systolic blood pressure (SBP) coefficient of variation (SBP_cv) defined as SD(SBP)/(average SBP), where SD(SBP) is the systolic blood pressure variability (SD stands for standard deviation); body mass index (BMI), and the composite multiplicative Predictor MULT=BMI·(1-AASI) ·SBP_cv was investigated, as well. Results showed that all Predictors were negatively correlated with the measured lower limit of cerebral autoregulation. Given a Predictor value the estimated lower limit of cerebral autoregulation (‘est_LLA’) was expressed by the regression line est_LLA = α +β·[Predictor] where α & β were determined for each Predictor by univariate analysis and reported in
| Predictor | R | α (mmHg) | β | Median | Threshold | OR |
|---|---|---|---|---|---|---|
| 1-AASI | -0.26 | 77.5 | -31.2 | 0.42 | 0.59 | 2.14 |
| SBP_cv | -0.26 | 78.4 | -84.9 | 0.16 | 0.24 | 2.59 |
| BMI (kg/m2) | -0.27 | 81.5 | -0.59 | 28.9 | 37.3 | 3.49 |
| MULT (kg/m2) | -0.41 | 76.1 | -5.6 | 1.95 | 2.75 | 6.1 |
Determining if mean arterial pressure is lower or higher than the measured lower limit of cerebral autoregulation
This is the main goal of attempting to reduce the risk associated with exposing the patient to a mean arterial pressure below the lower limit of cerebral autoregulation (as measured prior to cardiopulmonary bypass). As the lower limit of cerebral autoregulation is not routinely measured during cardiac surgery, getting more indications to whether the mean arterial pressure is below the lower limit of cerebral autoregulation or above it in a subpopulation by using the lower limit of cerebral autoregulation Predictors is clinically significant.
USING A REFERENCE VALUE OF MEAN ARTERIAL PRESSURE OR LOWER LIMIT OF CEREBRAL AUTOREGULATION
The previous study demonstrated that a mean arterial pressure below the lower limit of cerebral autoregulation did not occur in 48% of patients having a lower limit of cerebral autoregulation of less than 65 mmHg but did occur in the rest of patients with a lower limit of cerebral autoregulation of 65 mmHg or above. However, this indication requires measuring the lower limit of cerebral autoregulation. Furthermore, a mean arterial pressure below the lower limit of cerebral autoregulation did not occur in 8.8% of patients having a mean arterial pressure of at least 87 mmHg but did occur for the rest of patients with a mean arterial blood pressure below 87 mmHg.
USING ESTIMATED LOWER LIMIT OF CEREBRAL AUTOREGULATION
An indication for a mean arterial pressure lower than the lower limit of cerebral autoregulation is the sign of the difference between mean arterial pressure and estimated lower limit of cerebral autoregulation (est_LLA), where est_LLA is calculated for different Predictors, as described in the previous section. It is likely that the chance for correctly identifying the occurrence of a mean arterial blood pressure below the lower limit of cerebral autoregulation is greater if the difference between the mean arterial blood pressure and the estimated lower limit of cerebral autoregulation (est_LLA) is negative for a larger number of Predictors.
USING THE PREDICTOR THRESHOLD
Figure 2D depicts schematically the finding that each of the lower limit of cerebral autoregulation Predictors had a threshold level (‘Threshold’) above which a mean arterial blood pressures below the lower limit of cerebral autoregulation did not occur, but it did occur in the rest of patients with Predictor
USING PREDICTOR-BASED ODDS RATIO (OR)
Using the Median of a Predictor we define a dichotomized outcome equals 1 for when the mean arterial pressure is below the lower limit of cerebral autoregulation (undesired) and 0 for if is equal or larger than the lower limit of cerebral autoregulation (desired, if the mean arterial pressure is not too high). Furthermore, we define a dichotomized Predictor equals 1 for Predictor
Conclusions
The estimation of the lower limit of cerebral autoregulation from routine perioperative data in cardiac surgery of an individual prior to the cardiopulmonary bypass, and the use of the suggested indications for increasing the chance of finding when mean arterial pressure is below or above the lower limit of cerebral autoregulation may be helpful in selecting perioperative management strategies that may keep blood pressure in the cerebral autoregulation range during cardiopulmonary bypass without directly measuring the lower limit of cerebral autoregulation. However, it is not unlikely that the numerical values given here for the Predictors (Median, Threshold, etc.) and their association with the lower limit of cerebral autoregulation may vary with the population characteristics and the perioperative management. This suggests that routine accumulation of said Predictors and the occurrence of undesired outcomes that could be attributed to a mean arterial pressure below the lower limit of cerebral autoregulation might be clinically valuable.
Acknowledge
The authors have no conflicts of interest to declare. The Research reported in this publication was supported by an NHLBI grant of the National Institutes of Health under award number 1R56HL169285 to JS.
References
- Clarke DD, Sokoloff L (1999) Regulation of cerebral metabolic rate. In: Siegel GJ, Agranoff BW, Albers RW (eds) Basic neurochemistry: molecular, cellular and medical aspects, 6th edn. Lippincott-Raven, Philadelphia.
- Lassen NA. Cerebral blood flow and oxygen consumption in man. Physiol Rev. 1959;39:183–238.
- Tzeng YC, Ainslie PN. Blood pressure regulation IX: cerebral autoregulation under blood pressure challenges. Eur J Appl Physiol 2014; 114:545–559.
- Kontos HA, Wei EP, Navari RM, Levasseur JE, Rosenblum WI, Patterson JL Jr. Responses of cerebral arteries and arterioles to acute hypotension and hypertension. Am J Physiol. 1978 Apr;234(4):H371-83. doi: 10.1152/ajpheart.1978.234.4.H371. PMID: 645875.
- Peterson EC, Wang Z, Britz G. Regulation of cerebral blood flow. Int J Vasc Med. 2011;2011:823525.
- Rhee CJ, Kibler KK, Easley RB, Andropoulos DB, Smielewski P, Brady KM, Czosnyka M. Renovascular reactivity measured by near-infrared spectroscopy. J Appl Physiol. 2012;113:307–314.
- Meng L, Gelb AW. Regulation of cerebral autoregulation by carbon dioxide. Anesthesiology. 2015;122:196–205.
- Donnelly J, Budohoski KP, Smielewski P, Czosnyka M. Regulation of the cerebral circulation: bedside assessment and clinical implications. Crit Care. 2016;20:129.
- Claassen JAHR, Thijssen DHJ, Panerai RB, Faraci FM. Regulation of cerebral blood flow in humans: physiology and clinical implications of autoregulation. Physiol Rev. 2021 Oct 1;101(4):1487-1559. doi: 10.1152/physrev.00022.2020. Epub 2021 Mar 26. PMID:33769101; PMCID: PMC8576366.
- Rickards CA, Tzeng YC. Arterial pressure and cerebral blood flow variability: friend or foe? A review. Front Physiol. 2014 Apr 7;5:120. doi: 10.3389/fphys.2014.00120. PMID: 24778619; PMCID: PMC3985018.
- Ono M, Brady K, Easley RB, Brown C, Kraut M, Gottesman RF, Hogue CW. Duration and magnitude of blood pressure below cerebral autoregulation threshold during cardiopulmonary bypass is associated with major morbidity and operative mortality. J Thorac Cardiovasc Surg. 2014;147:483–489.
- Brady K, Joshi B, Zweifel C, Smielewski P, Czosnyka M, Easley RB, Hogue CW Jr. Real-time continuous monitoring of cerebral blood flow autoregulation using near-infrared spectroscopy in patients undergoing cardiopulmonary bypass. Stroke. 2010 Sep;41(9):1951-6. doi:10.1161/strokeaha.109.575159. Epub 2010 Jul 22. PMID:20651274; PMCID: PMC5544901.
- Vu EL, Brown CH, Brady KM, Hogue CW. Monitoring of cerebral blood flow autoregulation: physiologic basis, measurement, and clinical implications. British Journal of Anaesthesia, Volume 132, Issue 6, 1260 – 1273.
- Taylor K. The hemodynamics of cardiopulmonary bypass. Sem Thorac Cardiovasc Surg. 1990;2:300–12.
- Schell R, Kern F, Greeley W, Schulman S, Frasco P, Croughwell N, Newman M, Reves J. Cerebral blood flow and metabolism during cardiopulmonary bypass. Anesth Analg. 1993; 76:849–865.
- Moraca R, Lin E, Holmes J IV, Fordyce D, Campbell W, Ditkoff M, Hill M, Gutyon S, Paull D, Hall R. Impaired baseline regional cerebral perfusion in patients referred for coronary artery bypass. J Thorac Cardiovasc Surg. 2006; 131:540–546.
- Gottesman R, Sherman P, Grega M, Yousem D, Borowicz LJ, Selnes O, Baumgartner W, McKhann G. Watershed strokes after cardiac surgery: Diagnosis, etiology, and outcome. Stroke. 2006; 37:2306–2311.
- Joshi B, Ono M, Brown C, Brady K, Easley RB, Yenokyan G, Gottesman RF, Hogue CW. Predicting the limits of cerebral autoregulation during cardiopulmonary bypass. Anesth Analg. 2012 Mar;114(3):503-10. doi:10.1213/ane.0b013e31823d292a. Epub 2011 Nov 21. PMID: 22104067; PMCID: PMC3288415.
- Tripathi A, Obata Y, Ruzankin P, Askaryar N, Berkowitz DE, Steppan J, Barodka V. A Pulse Wave Velocity Based Method to Assess the Mean Arterial Blood Pressure Limits of Autoregulation in Peripheral Arteries. Front Physiol. 2017;8:855.
- Steppan J, Hogue CW Jr. Cerebral and tissue oximetry. Best Pract Res Clin Anaesthesiol. 2014;28(4):429-39.
- Smielewski P, Kirkpatrick P, Minhas P, Pickard JD, Czosnyka M. Can cerebrovascular reactivity be measured with near-infrared spectroscopy? Stroke. 1995; 26:2285–92.
- Pfister D, Siegemund M, Dell-Kuster S, Smielewski P, Rüegg S, Strebel S, Marsch S, Pargger H, Steiner L. Cerebral perfusion in sepsis-associated delirium. Crit Care Med. 2008; 12:R63. Epub 2008 May 5.
- Czosnyka M, Smielewski P, Kirkpatrick P, Menon D. Monitoring of cerebral autoregulation in head-injured patients. Stroke. 1996; 27:1829–34.
- Obata Y, Barodka V, Berkowitz DE, Gottschalk A, Hogue CW, Steppan J. Relationship between the ambulatory arterial stiffness index and the lower limit of cerebral autoregulation during cardiac surgery. J Am Heart Assoc 2018; 7:e007816.
- Gavish B, Gottschalk A, Hogue CW, Steppan J. Additional predictors of the lower limit of cerebral autoregulation during cardiac surgery. J Hypertens. 2023 Nov 1;41(11):1844-1852. doi: 10.1097/HJH.0000000000003556. Epub 2023 Sep 14. PMID: 37702558; PMCID: PMC10552816.
- Li Y, Wang JG, Dolan E, Gao PJ, Guo HF, Nawrot T, et al. Ambulatory arterial stiffness index derived from 24-h ambulatory blood pressure monitoring. Hypertension 2006;47:359–364.
- Dolan E, Thijs L, Li Y, Atkins N, McCormack P, McClory S, O’Brien E, Staessen JA, Stanton AV. Ambulatory arterial stiffness index as a predictor of cardiovascular mortality in the Dublin Outcome Study. Hypertension. 2006 Mar;47(3):365-70. doi:10.1161/01.HYP.0000200699.74641.c5. Epub 2006 Jan 23. PMID: 16432047.
- Zhang S, Tamargo RJ, Bergmann J, Gottschalk A, Steppan J. The relationship between intraoperative surrogates of vascular stiffness, cerebral aneurysms, and surgical outcomes. J Stroke Cerebrovasc Dis. 2024 Sep 7;33(11):108003.
- Gavish B, Ben-Dov IZ, Kark JD, Mekler J, Bursztyn M. The association of a simple blood pressure-independent parameter derived from ambulatory blood pressure variability with short-term mortality. Hypertens Res 2009; 32:488–495.
- von Eye A. Symmetric regression. In: von Eye A, Schuster C (eds), Regression Analysis for Social Sciences. Academic Press: San Diego, 1998, 209–233.
- Gavish B. Repeated blood pressure measurements may probe directly an arterial property. [abstract] In: Abstract Book. American Journal of Hypertension 2000; 13 (part 2 B012):190A–191A.
- Gavish B, Izzo JL Jr. Arterial stiffness: going a step beyond. Am J Hypertens 2016;29:1223–1233.