

Machine Learning in Implantable Defibrillator Algorithms
Implementation of Machine Learning to Improve Implantable Cardioverter-Defibrillator Detection Algorithms
Samuel Newell*, MS,¹,² Trenton Callaway*, BBME,² Selçuk Adabag, MD, MS, FHRS,³,⁴,⁵ Elena G. Tolkacheva, PhD²,⁶,⁷
- University of Minnesota Medical School, Minneapolis, Minnesota,
- Department of Biomedical Engineering, University of Minnesota, Minneapolis, Minnesota,
- Division of Cardiology, Minneapolis VA Health Care System, Minneapolis, Minnesota,
- Department of Medicine, University of Minnesota, Minneapolis, Minnesota
- Division of Epidemiology & Community Health, University of Minnesota, Minneapolis, Minnesota
- Lillehei Heart Institute, University of Minnesota, Minneapolis
- Institute for Engineering in Medicine, University of Minnesota, Minneapolis
OPEN ACCESS
PUBLISHED 30 October 2024
CITATION Newell, S., et al., 2024. Implementation of Machine Learning to Improve Implantable Cardioverter-Defibrillator Detection Algorithms. Medical Research Archives, [online] 12(10). https://doi.org/10.18103/mra.v12i10.5913
COPYRIGHT © 2024 European Society of Medicine. This is an open-access article distributed under the terms of the Creative Commons Attribution License, which permits unrestricted use, distribution, and reproduction in any medium, provided the original author and source are credited.
DOI https://doi.org/10.18103/mra.v12i10.5913
ISSN 2375-1924
ABSTRACT
Background: Sudden cardiac death is a leading cause of death in the US and globally. Implantable cardioverter-defibrillators (ICD) prevent this through electrical therapy, but inappropriate therapy for non-life threatening heart rhythms remains pervasive.
Objective: The goal of this study was to improve upon current ICD discrimination algorithms by using supervised machine learning techniques on an annotated database of ICD electrograms (EGM) preceding therapy to discriminate between appropriate (App) or inappropriate (InApp) therapies.
Methods: A total of 54 EGMs of therapy events adjudicated by cardiologists were digitized from 49 cases. The signals were analyzed within either a single long window, or four short overlapping windows preceding therapy. The discrimination between App and InApp therapies was done using EGMs recorded over specific windows by separately calculating RR-based and nonlinear dynamic (NLD) based metrics, and creating RR- and NLD-scores, respectively. Linear and quadratic discriminant analysis (LDA and QDA) were then used on the obtained RR- and NLD-scores to predict the App or InApp therapy. These results were then compared to the App and InApp designation by cardiologists. Error rates based on incorrect classifications were used to evaluate the performance of both techniques.
Results: We demonstrated that the optimal windows for LDA and QDA can both greatly improve upon modern error rates, with our QDA error going as low as nearly 2% when using an optimal window, as compared to the errors up to 25% found in recent studies. Despite QDA having a lower overall error across all windows, the QDA error came mostly from more dangerous false negatives, whereas the majority of LDA error came from less dangerous false positives.
Conclusions: This novel strategy shows promise for use in retrospective discrimination of inappropriate and appropriate ICD therapy events and could improve real time decision making algorithms in ICDs. Additional studies should be completed to assess its utility in real time decision making and case adjudication.
Introduction
Sudden cardiac death (SCD) is a major health problem in the United States and globally with over four million deaths related to SCD per year globally.¹–⁴ SCD can be prevented by implantable cardioverter-defibrillators (ICDs), a surgically implanted device that detects and terminates life threatening arrhythmias such as ventricular fibrillation (VF) and ventricular tachycardia (VT) through anti-tachycardia pacing and high voltage shock therapies. Thus, by implanting ICDs in individuals deemed at high risk for SCD, many cases of SCD are prevented.
Despite ICDs decreasing mortality in numerous large, multicenter studies,⁵–¹⁰ they are not without risk. ICDs detect VT/VF through several embedded criteria. When an ICD correctly detects VT/VF and delivers therapy to terminate the event, the intervention is labeled as an “appropriate” (App) therapy. Annually, 10-20% of patients with an ICD experience inappropriate ICD therapy to terminate a non-life-threatening rhythm, such as rapid atrial fibrillation (AF), as VT/VF and deliver “inappropriate” (InApp) therapy, which may cause pain, suffering and post-traumatic stress disorder, thereby reducing overall quality of life and increasing morbidity and mortality.¹³,¹⁴
Current ICDs rely heavily on the heart rate (HR) calculation from RR intervals on electrograms (EGMs) for determining if current signals necessitate therapy.¹⁵ If the calculated HR for a potentially arrhythmic signal is above a predetermined threshold, and other criteria on onset, stability and morphology are met, the rhythm will be labeled as VT/VF and therapy will ensue. Recent studies have shown that up to 1 in every 4 applied ICD shocks may be applied inappropriately.¹⁶,¹⁷ Given these shortcomings, devising an alternative approach to discriminate between App and InApp therapy is imperative.
The goal of this study was to improve upon current ICD discrimination algorithms by using supervised machine learning techniques with both traditional RR-based metrics as well as novel nonlinear-dynamics (NLD) based metrics. The accuracy of linear discriminant analysis (LDA) and quadratic discriminant analysis (QDA) were quantified by calculating the error for each technique.
Materials and Methods
DATA DESCRIPTION
Patients with heart failure who had an ICD implanted for primary prevention of SCD according to the practice guideline criteria were included in this analysis.¹⁷ Briefly, the patients had heart failure (New York Heart Association class II–III) with left ventricular ejection fraction ≤35% while on optimal medical therapy for at least 3 months were eligible. Those who had a myocardial infarction in the last 40 days, or coronary revascularization in the last 90 days were excluded. The cohort included patients with ECG characteristics that increased SCD risk.¹⁸ However, those with left bundle branch block or intraventricular conduction delay or left EF < 35% with QRS ≥ 130 ms, who were eligible for cardiac resynchronization therapy were excluded. ICDs were implanted from 2016 to 2020 and followed centrally by the Veterans Affairs National Cardiac Device Surveillance Program (average follow up 31.5 months).
ICDs are electronic devices that monitor the heart rhythm continuously for any arrhythmias. When an arrhythmia occurs or an ICD therapy is delivered, a rhythm strip, called EGM, is saved in the device’s memory. These EGMs can be accessed for analysis and interpretation by ICD interrogation with a programmer or remotely.
The database used consists of 54 case reports in the form of PDF files. Each file consists of EGM signals for both App and InApp therapy in accordance with an institutional review board #1594876 approved protocol. Within this database, EGMs recorded by ICDs were professionally labeled and annotated, allowing for identification of arrhythmia onset, App or InApp therapy delivery, and visualization of the temporal windows used to capture patient EGM signals. Specifically, each EGM was reviewed by two cardiac electrophysiologists and adjudicated as App or InApp therapy, using tachycardia onset, stability and QRS morphology criteria. Differences were resolved by discussion.
The EGMs from each case report were reviewed for their ability to be digitized. 5 cases were excluded at this point because they had thick solid-lined grids obscuring much of the EGM signals on the PDF dataset. 1 other case was excluded because the device was BioTronik manufactured, while all other case reports were from Boston or Medtronic manufactured devices. In summary, 49 acceptable cases with a total of 54 therapy events (42 App, and 12 InApp) were used for analysis.
DATA DIGITIZATION AND WINDOWING
First, each PDF image of the far-field EGM from the case reports was digitized, and corresponding RR intervals were transferred by hand. The digitized signal recording typically had 20 to 40 RR intervals (see Figure 1).
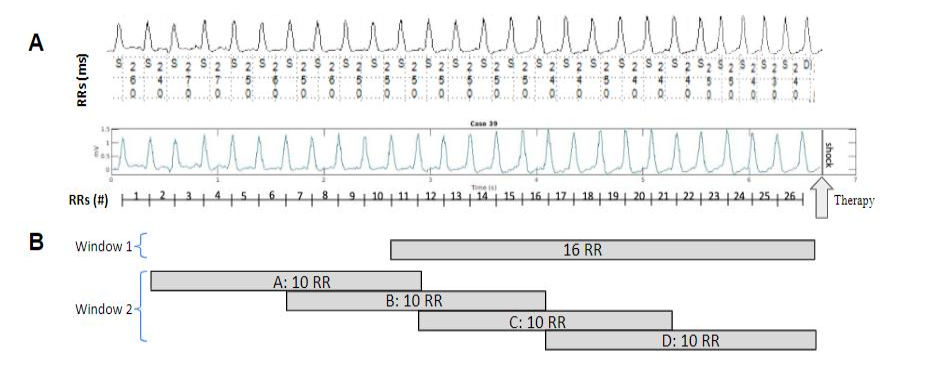
Figure 1: Diagram of the workflow for the data digitization and pre-analysis. Panel A (top) shows a representative example of an EGM from a Medtronic single chamber Transvenous ICD, together with annotated RR intervals. Panel A (bottom) shows the digitized signal and a count of RR intervals prior to the therapy event indicated by an arrow labeled “Therapy.” Panel B demonstrates Window 1 and Window 2 approaches.
The ASCII EGMs and RR interval data for each event were segmented into several windows using two approaches as shown in Figure 1B. In the first approach (Window 1), we used 16 RR intervals prior to therapy delivery (see top panel in Fig. 1B). This approach was chosen as it was the largest window at which all App therapy cases displayed VT/VF for the entire EGM.
In the second approach (Window 2), we used 25 RR intervals prior to therapy delivery, and split them into 4 overlapping 10 RR windows (see bottom panel in Figure 1B). The Window 2 strategy was chosen to allow for therapy decisions closer to the most optimal time point for delivery. In addition to this, a practical implementation of Window 2 in an ICD would result in a higher frequency of App or InApp decision making, allowing therapy to be administered closer to the most optimal time point than allowed by the Window 1 approach.
TRADITIONAL RR-BASED AND NONLINEAR-DYNAMICS-BASED METRICS
A total of 7 traditional RR-based metrics were calculated using the provided RR intervals from the EGMs digitized from each case report in the database: the mean RR interval (MeanRR) over the windowed range, the proportion of the successive differences in RR intervals (NNs) that exceeds 50 ms (pNN50), the root mean square of the NNs (RMS), standard deviation of the NNs (STD), two Poincaré metrics (SD1 and SD2), and the ratio of those two (SD1/SD2). The mean values of all 7 RR metrics were calculated for the Windows 1 of all 54 EGM case reports (see Table
-
separately for all App and InApp EGMs. Table 1 indicates that 6 out of 7 RR-based metrics are statistically significant (*, p<0.05) between App and InApp EGMs. These metrics were further used to calculate an RR Score according to the following formula:
RR Scoreₓ = MeanRRₓ + pNN50ₓ + RMSₓ + STDₓ + SD1ₓ + SD2ₓ
where x = [1, 54] is the case number.
Table 1: Mean values and their standard deviations of RR and NLD metrics calculated for all App and InApp therapies using Window 1 for all EGMs. * indicates a statistical significance between App and InApp parameters at 0.05 level.
| RR Metrics | App | InApp |
|---|---|---|
| MeanRR | 270.87±34.05* | 311.93±35.19 |
| pNN50 | 0.01±0* | 0.40±0.18 |
| RMS | 14.43±13.32* | 85.54±41.96 |
| STD | 11.52±9.45* | 66.52±30.33 |
| SD1 | 10.49±9.76* | 62.92±30.06 |
| SD2 | 11.91±9.86* | 69.15±33.12 |
| SD1/SD2 | 0.81±0.49 | 0.96±0.27 |
| NLD Metrics | App | InApp |
|---|---|---|
| MSE | 4.95±1.27* | 6.65±1.08 |
| MSE | 0.53±0.19 | 0.65±0.18 |
| SE | 8.30±0.39* | 7.49±0.57 |
| Kt | 3.73±1.53* | 6.89±2.12 |
The NLD-based metrics identify changes in the intrinsic electrical complexity of the EGMs. In this study we utilized four NLD-based metrics that were shown to be applicable to short non-stationary signals: the information-theory based multi-scale entropy (MSE) and Shannon entropy (SE), statistic-based Kurtosis (Kt), and frequency-based multi-scale frequency (MSF).¹⁹,²²,¹⁵ The mean values of all 4 NLD metrics were calculated for the Window 1 of all 54 EGM case reports (see Table 1) separately for all App and InApp EGMs. Table 1 indicates that 3 out of 4 NLD-based metrics are statistically significant (*, p<0.05) between App and InApp EGMs. These metrics were further used to calculate an NLD Score according to the following formula:
NLD Scoreₓ = MSFₓ − SEₓ + Ktₓ
where x = [1, 54] is the case number. The value of -1 was used for SE to maximize the difference in the scores for the App and InApp cases.
STATISTICAL ANALYSIS
All RR-based and NLD-based metrics from Table 1 were statistically compared between App and InApp therapies with a one-way ANOVA. Statistical significance was defined at p<0.05.
LINEAR DISCRIMINANT ANALYSIS AND QUADRATIC DISCRIMINANT ANALYSIS TO DISCRIMINATE BETWEEN App AND InApp THERAPIES
By calculating an RR and NLD Score for all 54 EGM signals in the database, we represent every EGM as a point in an RR-NLD Score space. We further utilized linear discriminant analysis (LDA) and quadratic discriminant analysis (QDA) to create a decision boundary (DB) that will separate all EGMs into an App Zone and an InApp Zone based on whichever window was used for the given EGM, deemed the instantaneous window. App and InApp Zones were created to better visualize false positive therapy (any InApp therapy in the App zone) and a false negative
therapy (any App therapy in the InApp zone) in the RR-NLD Score space. In an ICD, false positive is the application of an unwarranted shock, and false negative is to withhold a warranted shock. In the context of an ICD, a false negative is considered more dangerous than a false positive, given that a missed therapy can withhold life saving treatment, and that an unwarranted therapy, just like a warranted therapy, should come with an exceedingly small mortality risk.
Both LDA and QDA were performed separately on the Window 1 and Window 2 approaches. To quantify the errors for LDA and QDA, we calculated the ratio of incorrectly classified points based on RR and NLD Scores to the total number of data points in each Window, as within data classification error (WDCE). In addition to WDCE, we also use a more sophisticated, predictive approach by calculating built-in error in the MATLAB “classify” function, which gives a misclassification rate unbiased based on the training data, called the apparent error rate (AER).²³ Here, the training data was a list of every RR score, NLD score, and App or InApp classification, for all 54 EGM files. The sample data used to determine the AER was an even distribution of 10,000 sample points across the score space for the given window.
Results
(i) DISCRIMINATION OF App AND InApp THERAPIES USING LINEAR DISCRIMINANT ANALYSIS
Figure 2 shows App (blue triangles) and InApp (red triangles) therapies from Window 1 in the RR-score and NLD-score parameter space. Since these therapies are from Window 1, the pink instantaneous decision boundary (IDB) for Figure 2 is an LDA line calculated using metrics from Window 1 EGMs. The black DB is an LDA line calculated using metrics from Window 2D. The two DBs divide the parameter space into two regions, an App zone (blue area), and an InApp zone (red area), which are different when calculated for Window 1 (pink IDB line) and Window 2 (black DB line). Window 2D is closest to the therapy application, and is therefore expected to be the most representative of a fibrillatory state when compared to all other windows. Several InApp therapies (red triangles) were placed into the App zone by the pink IDB line. These false positives represent an incorrectly classified event, which indicates that the shock was appropriate despite it not being so. The results of misclassification are summarized in Table 2.
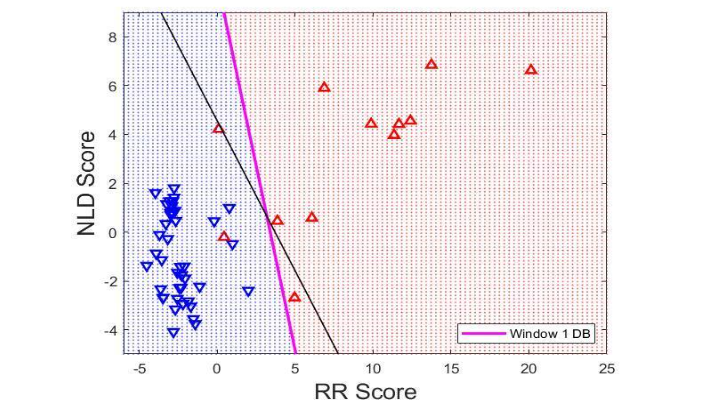
Figure 2: This plot shows App (red triangles) and InApp (blue triangles) therapies for Window 1, along with the respective LDA instantaneous decision boundary (IDB) (pink) for Window 1. The LDA decision boundary (black line) from Window 2 is also plotted. The IDB divides the RR Score / NLD Score parameter space into an App zone (blue area) and an InApp zone (red area).
Table 2: WDCE, AER, False Negative, and False Positive calculated for all windows when using LDA to calculate the IDB. WDCE: Within Data Classification Error, AER: Apparent Error Rate, LDA: Linear Discriminant Analysis, IDB: Instantaneous Decision Boundary
| LDA Error | WDCE (%) | AER (%) | False Negatives | False Positives |
|---|---|---|---|---|
| Window 1 | 3.7037 | 8.3333 | 0 | 2 |
| Window 2A | 20.3704 | 22.0238 | 8 | 3 |
| Window 2B | 20.3704 | 25 | 7 | 4 |
| Window 2C | 3.7037 | 8.3333 | 0 | 2 |
| Window 2D | 5.5556 | 12.5 | 0 | 3 |
Figure 3 shows App and InApp therapy results for Window 2 A, B, C, and D, along with an IDB (pink line) calculated using LDA from the respective Window and dividing the RR-score and NLD-score parameter space into an App zone (blue area) and an InApp zone (red area). DB (black lines) are calculated using LDA from Window 2D. Figure 3 shows the presence of misclassified points indicated by App therapies in the InApp zone and vice versa. The error rates for Figure 3 are summarized in Table 2.
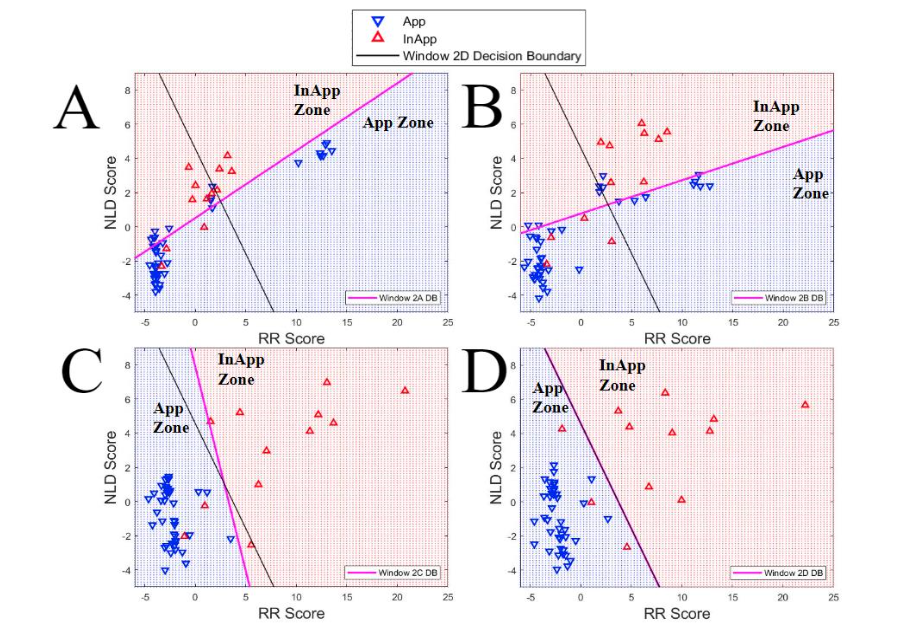
Figure 3A-D: This plot shows App (red triangles) and InApp (blue triangles) therapies for Windows A, B, C, and D, along with the respective LDA instantaneous decision boundaries (IDB) (pink line) for each Window. The LDA decision boundary (black line) from Window 2D is also plotted for each. The IDB divides the RR Score / NLD Score parameter space into an App zone (blue area) and an InApp zone (red area).
DISCRIMINATION OF App AND InApp THERAPIES USING QUADRATIC DISCRIMINANT ANALYSIS
Figure 4 shows App and InApp therapies for Window 1 in the RR-score and NLD-score parameter space. Since LDA is not necessarily the best way to discriminate App and InApp therapies on the basis of calculated RR and NLD metrics, QDA was also used to calculate an IDB. The black DB line in Figure 4 was also created using QDA based on Window 2D. The error rate for this Figure is summarized in Table 3.
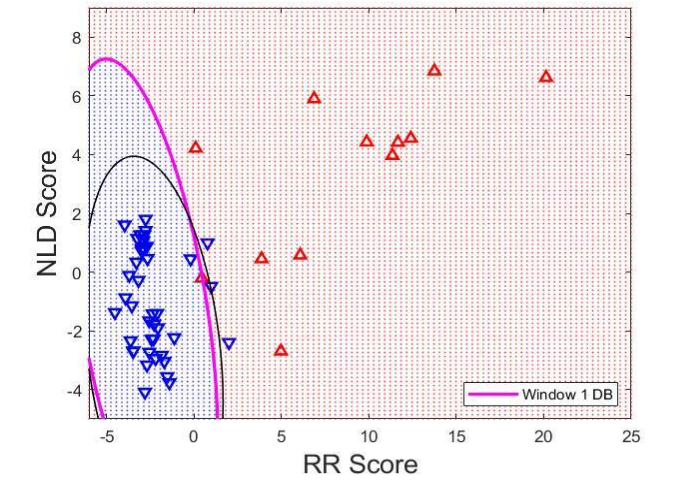
Figure 4: This plot shows App (red triangles) and InApp (blue triangles) therapies for Window 1, along with the respective QDA instantaneous decision boundary (IDB) (pink line) for Window 1. The QDA decision boundary (black line) from Window 2 is also plotted. The IDB divides the RR Score / NLD Score parameter space into an App zone (blue area) and an InApp zone (red area).
Table 3:
WDCE, AER, False Negative, and False Positive calculated for all windows when using QDA to calculate the IDB.
WDCE: Within Data Classification Error
AER: Apparent Error Rate
LDA: Linear Discriminant Analysis
IDB: Instantaneous Decision Boundary
| QDA Error | WDCE (%) | AER (%) | False Negatives | False Positives |
|---|---|---|---|---|
| Window 1 | 5.5556 | 7.7381 | 3 | 0 |
| Window 2A | 14.8148 | 18.4524 | 5 | 3 |
| Window 2B | 16.6667 | 22.619 | 5 | 4 |
| Window 2C | 5.5556 | 7.7381 | 2 | 0 |
| Window 2D | 3.7037 | 2.381 | 2 | 0 |
Figure 5 shows four plots, each displaying App and InApp therapy results for Window 2 A, B, C, and D respectively. Each plot in Figure 5 contains a pink IDB from the respective windows. Each IDB in Figure 5 was calculated using QDA, and was used to separate App and InApp therapies into App and InApp zones.
Each plot also shows a black DB line from Window 2D calculated using QDA. All misclassified therapies are summarized as error rates in Table 3, which indicates that QDA had lower occurrences of misclassified therapies than LDA across all Windows using AER.
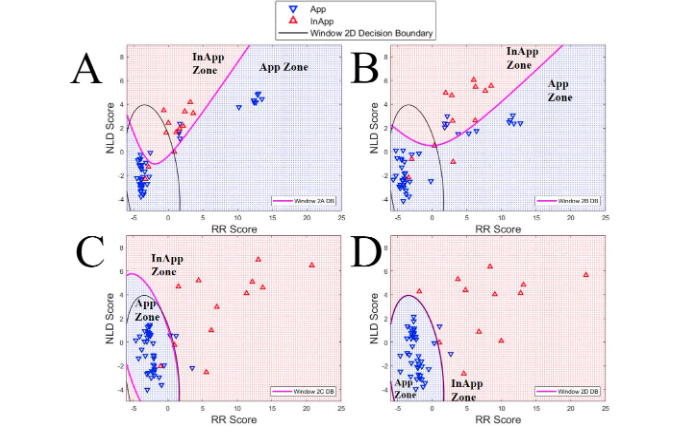
Figure 5A-D: This plot shows App (red triangles) and InApp (blue triangles) therapies for Windows A, B, C, and D, along with the respective QDA instantaneous decision boundaries (IDB) (pink line) for each Window. The QDA decision boundary (black line) from Window 2 is also plotted for each. The IDB divides the RR Score / NLD Score parameter space into an App zone (blue area) and an InApp zone (red area)
Discussion
(i) OVERALL FINDINGS
Our goal was to improve upon current ICD discrimination algorithms by using supervised machine learning techniques (LDA and QDA). These techniques discriminated EGM data based on traditional RR-based metrics as well as novel NLD metrics. The accuracy of LDA and QDA were quantified by calculating the error for each technique.
The LDA Window 2C error was ~8.3%, and the QDA Window 2D error was ~2.4%. As compared to the errors of up to 25% found in recent studies, we demonstrated that the optimal windows for LDA and QDA can both greatly improve upon modern error rates.¹⁶
It was expected that QDA would outperform LDA, given that its nonlinearity terms can be better fine-tuned to discriminate between groups of data, but in the upper limit, an exceedingly complex IDB would run the risk of over-fitting to its training model.
(ii) ISSUE WITH CURRENT ICDs
In the PainFree trial, using rate-based decision making and novel discriminations algorithms as described above, patients with Medtronic single chamber TV-ICD implanted between 2009 and 2013 had a 1 year InApp therapy incidence of 3.4%. However, across both single chamber and multi chamber devices, an alarming 115 out of 804 (14%) therapeutic shock episodes were InApp. The number one cause for InApp therapy in this study (PainFree SST) was AF.¹¹
These differences in InApp therapy rates are likely attributed to differences in algorithms between the studies, more so with differences in the hardware. It was further supported by the Multicenter Automatic Defibrillator Implantation Trial—Reduce Inappropriate Therapy (MADIT RIT) study, where
AER for LDA at 8.333%. 2) Window 2D had the best AER for QDA at 2.381%. 3) QDA had lower AERs for all windows. 4) LDA error came mostly from false positives. 5) QDA error came mostly from false negatives.
Based on these conclusions, it would be easy to claim that QDA is superior to LDA for use in retrospective discrimination of ICD EGMs, but this is not clearly the case. Despite the fact that QDA has a lower percent error than LDA, these QDA errors are more likely to come from the more dangerous false negatives (withholding needed therapy), as opposed to the less dangerous false positives (delivering unneeded therapy). This means that QDA as compared to LDA has a trade off of higher accuracy in exchange for higher stakes in the case of a misclassified EGM.
Conclusion
In conclusion, this study set out to create a machine learning algorithm for the discrimination of InApp and App ICD therapies. To do this, NLD-based metrics were introduced as novel parameters for analyzing the ICD EGMs, in addition to standard RR-based metrics. Combining 3 NLD-based metrics and 6 RR-based metrics into linear combination scores allowed for effective separation between the InApp and App therapy across all time windows. Discrimination of EGMs based on RR and NLD scores was done using both LDA and QDA for each time window.
When comparing LDA and QDA both by percent errors and by false positive and false negative errors, it was shown that QDA is more accurate (<= 2.381% error), at discriminating between the InApp and App EGMs but its errors come mostly from false negatives, which would result in withholding life-saving therapy.
In addition, the most accurate time windows across the study were Window 1, Window 2C, and Window 2D, which unsurprisingly demonstrates that a representative ICD EGM should encompass a large duration of time, indicated by the accuracy of Window 1 (the longest window) and that a representative ICD EGM should show a time just prior to therapy, indicated by the accuracy of Windows 2C and 2D (the windows closest in time to the actual therapy application).
Due to the success of the study objectives, the next steps of this project should likely be to expand the existing database, and to develop new metrics to be used in the calculation of RR and NLD scores. This would potentially allow for more accurate differentiation of the InApp and App therapy instances.
Conflicts of Interest Statement:
The authors have no conflicts of interest to declare.
Acknowledgement:
This research was supported by the National Science Foundation grant DMS-2327185 to E.G.T., and by the Minnesota Partnership for Biotechnology and Medical Genomics (MNP #21.30) to E.G.T.
References
1. N. Srinivasan and R. Schilling, “Sudden Cardiac Death and Arrhythmias,” Arrhythmia and Electrophysiology Review, vol. 7, no. 2, pp. 111-7, 2018.
2. Adabag, A. S., Roger, V. L., Gersh, B. J., & Luepker, R. V. (2010). Sudden cardiac death: epidemiology and risk factors. Nature Reviews Cardiology, 7(4), 216–225. https://doi.org/10.1038/nrcardio.2010.3
3. Adabag, S., & Langsetmo, L. (2020). Sudden cardiac death risk prediction in heart failure with preserved ejection fraction. Heart Rhythm, 17(3), 358–364. https://doi.org/10.1016/j.hrthm.2019.12.009
4. Adabag, S., Hodgson, L., Garcia, S., Anand, V., Frascone, R., Conterato, M., Lick, C., Wesley, K., Mahoney, B., & Yannopoulos, D. (2017). Outcomes of sudden cardiac arrest in a state-wide integrated resuscitation program: Results from the Minnesota Resuscitation Consortium. Resuscitation, 110, 95–100. https://doi.org/10.1016/j.resuscitation.2016.10.029
5. N. Ghosh, I. Mangat, S. O’Donnell, A. Pinter, V. Korley, C. Lane and P. Dorian, “Outcomes in heart failure patients referred for consideration of implantable cardioverter defibrillator for primary prophylaxis of sudden cardiac death: What are the risks of waiting?,” Can J Cardiol., pp. e342-e346, 2009.
6. B. Schrage, A. Uijl, L. Benson, D. Westermann, M. Stahlberg, D. Stolfo, C. Linde, F. Braunschweig and G. Savarese, “Association Between Use of Primary-Prevention Implantable Cardioverter-Defibrillators and Mortality in Patients With Heart Failure,” Circulation, pp. 1530-1539, 2019.
7. Moss, A. J., Zareba, W., Hall, W. J., Klein, H., Wilber, D. J., Cannom, D. S., Daubert, J. P., Higgins, S. L., Brown, M. W., & Andrews, M. L. (2002). Prophylactic Implantation of a Defibrillator in Patients with Myocardial Infarction and Reduced Ejection Fraction. The New England Journal of Medicine, 346(12), 877–883.
https://doi.org/10.1056/NEJMoa013474
8. Bardy, G. H., Lee, K. L., Mark, D. B., Poole, J. E., Packer, D. L., Boineau, R., Domanski, M., Troutman, C., Anderson, J., Johnson, G., McNulty, S. E., Clapp-Channing, N., Davidson-Ray, L. D., Fraulo, E. S., Fishbein, D. P., Luceri, R. M., & Ip, J. H. (2005). Amiodarone or an Implantable Cardioverter–Defibrillator for Congestive Heart Failure. The New England Journal of Medicine, 352(3), 225–237. https://doi.org/10.1056/NEJMoa043399
9. Anantha Narayanan, M., Vakil, K., Reddy, Y. N., Baskaran, J., Deshmukh, A., Benditt, D. G., & Adabag, S. (2017). Efficacy of Implantable Cardioverter-Defibrillator Therapy in Patients With Nonischemic Cardiomyopathy: A Systematic Review and Meta-Analysis of Randomized Controlled Trials. JACC. Clinical Electrophysiology, 3(9), 962–970. https://doi.org/10.1016/j.jacep.2017.02.006
10. Adabag, S., Patton, K. K., Buxton, A. E., Rector, T. S., Ensrud, K. E., Vakil, K., Levy, W. C., & Poole, J. E. (2017). Association of Implantable Cardioverter Defibrillators With Survival in Patients With and Without Improved Ejection Fraction: Secondary Analysis of the Sudden Cardiac Death in Heart Failure Trial. JAMA Cardiology, 2(7), 767–774. https://doi.org/10.1001/jamacardio.2017.1413
11. A. Auricchio, E. Schloss, T. Kurita, A. Meijer, B. Gerritse, S. Zweibel, … and L. Sterns, “Low inappropriate shock rates in patients with single- and dual/triple-chamber implantable cardioverter-defibrillators using a novel suite of detection algorithms: PainFree SST trial primary results,” Heart Rhythm, 2015.
12. Moss, A. J., Schuger, C., Beck, C. A., Brown, M. W., Cannom, D. S., Daubert, J. P., Estes, N. A. M., Greenberg, H., Hall, W. J., Huang, D. T., Kautzner, J., Klein, H., McNitt, S., Olshansky, B., Shoda, M., Wilber, D., & Zareba, W. (2012). Reduction in Inappropriate Therapy and Mortality through ICD Programming. The New England Journal of Medicine, 367(24), 2275–2283. https://doi.org/10.1056/NEJMoa1211107
13. R. Passman, H. Subacius, B. Ruo, A. Schaechter, A. Howard, S. Sears and A. Kadish, “Implantable Cardioverter Defibrillators and Quality of Life: Results From the Defibrillators in Nonischemic Cardiomyopathy Treatment Evaluation Study,” Arch Intern Med., pp. 2226-2232, 2007.
14. E. Schron, D. Exner, Q. Yao, L. Jenkins, J. Steinberg, J. Cook, … and J. Powell, “Quality of life in the antiarrhythmics versus implantable defibrillators trial: impact of therapy and influence of adverse symptoms and defibrillator shocks,” Circulation, pp. 589-594, 2002. Rep. 2016 Aug 17;2(6):478-483. doi: 10.1016/j.hrcr.2016.06.006. PMID: 28491741; PMCID: PMC5419980.
15. Ellenbogen, K., & Kaszala, K. (2020). Cardiac pacing and ICDs (Sixth ed.). Chichester, West Sussex: John Wiley & Sons. pp. 350-352.
16. Al-Khatib SM, Belbase S, Sauro D, Brock G, Brink K, Jackson KP. inappropriate shocks in a patient with a subcutaneous implantable cardioverter-defibrillator. HeartRhythm Case
17. Singh, S. N., Wininger, M., Raitt, M., Adabag, S., Moore, H., Rottman, J. N., Scrymgeour, A., Zhang, J., Zheng, K., Guarino, P., Kyriakides, T. C., Johnson, G., Williams, A., Beed, A., MacMurdy, K., & Saavedra, P. (2024). Efficacy and safety of implantable cardioverter-defibrillator implantation in the elderly—The I-70 Study: A randomized clinical trial. Heart Rhythm O2, 5(6), 365–373. https://doi.org/10.1016/j.hroo.2024.04.010
18. Maheshwari, A., Norby, F. L., Soliman, E. Z., Alraies, M. C., Adabag, S., O’neal, W. T., Alonso, A., & Chen, L. Y. (2017). Relation of Prolonged P-wave Duration to Risk of Sudden Cardiac Death in the General Population (From the Atherosclerosis Risk in Communities Study). The American Journal of Cardiology, 119(9), 1302–1306.
https://doi.org/10.1016/j.amjcard.2017.01.012
19. S. Arunachalam, S. Kapa, S. Mulpuru, P. Friedman and E. G. Tolkacheva, “Improved Multiscale Entropy Technique with Nearest-Neighbor Moving-Average Kernel for Nonlinear and Nonstationary Short-Time Biomedical Signal Analysis,” Journal of Healthcare Engineering, 2018.
20. V. Ravikumar, E. Annoni, S. Mulpuru, H. Roukoz and E. Tolkacheva, “Evaluation of multiscale frequency approach for visualizing rotors in patients with atrial fibrillation,” Proceedings of IEEE EMBC, 2018.
21. S. Arunachalam, E. Annoni, S. Mulpuru, P. Friedman and E. Tolkacheva, “Novel Multiscale Frequency Approach to Identify the Pivot Point of the Rotor,” Journal of Medical Devices, vol. 10, 2016.
22. C. Shannon, “A mathematical theory of communication,” Bell System Technical Journal, vol. 27, no. 3, pp. 379-423, 1948.
23. classify. Classify observations using discriminant analysis – MATLAB. (n.d.).
https://www.mathworks.com/help/stats/classify.html
24. M. Gold, P. Lambiase, M. El-Chami, K. Reinoud, J. Aasbo, M. Bongiorni, … and L. Boersma, “Primary Results From the Understanding Outcomes With the S-ICD in Primary Prevention Patients With Low Ejection Fraction (UNTOUCHED) Trial,” Circulation, pp. 7-17, 2021.