

Measuring Clinical Trial Generalizability: Key Metrics
How to Measure the Generalizability of Clinical Trials
Yuanyuan Lu¹, Henian Chen², Wei Wang³, Yangxin Huang², Matthew J. Valente²
- Bristol Myers Squibb, Madison, NJ, USA
- Department of Biostatistics and Data Science, College of Public Health, University of South Florida, USA
- Centre for Addiction and Mental Health (CAMH), Toronto, Canada
OPEN ACCESS
PUBLISHED: 30 September 2025
CITATION: Lu, Y., Chen, H., et al., 2025. How to Measure the Generalizability of Clinical Trials. Medical Research Archives, [online] 13(9).
https://doi.org/10.18103/mra.v13i9.6896
COPYRIGHT: © 2025 European Society of Medicine. This is an open-access article distributed under the terms of the Creative Commons Attribution License, which permits unrestricted use, distribution, and reproduction in any medium, provided the original author and source are credited.
DOI https://doi.org/10.18103/mra.v13i9.6896
ISSN 2375-1924
Abstract
Randomized controlled trials are widely regarded as the gold standard in clinical research and public health. However, they have been criticized for potentially lacking generalizability, as trial participants may not fully represent the target patient population due to the inability to obtain a truly random sample for enrollment. Assessing and evaluating the generalizability of randomized controlled trials is an important issue that has not been addressed adequately in literature. Additionally, although the importance of describing clinical trial generalizability is recognized by clinical trial reporting guidelines (e.g., CONSORT), it provides no clear guidance on statistical tests or estimation procedures. In this paper, we compare five generalizability indexes, including Standardized Mean Difference, C-Statistic, β-Index, Kolmogorov-Smirnov Distance, and Lévy Distance. We simulate a patient population with a treatment effect size of 0.5 (Cohen’s d) and seven covariates that include gender, health insurance, race, baseline symptoms, comorbidity, age, and motivation. We then evaluate the performance of the five generalizability indexes using selected nonrandom and random clinical trial samples under different number of covariates and sample sizes. Our work supports the use of β-index and C-statistic due to their strong statistical performance, ease of interpretation and ability to clearly categorize generalizability into levels such as very high, high, medium or low. A β-index value between 1 and 0.8 (inclusive) or a C-statistic value between 0.5 and 0.8 (inclusive) indicates that the trial sample is very highly or highly representative of the patient population.
Keywords
clinical trial; generalizability; measurement; effect size; bias; simulation
1. Introduction
The primary interest of medical research is whether the intervention will be effective in the target population where the intervention may be implemented. To generalize the research finding from a study to the target population, a study requires both random assignment of treatments to experimental units within the sample and random sampling from the population. The randomized controlled trial (RCT) is widely accepted as the gold standard in assessing the effectiveness of an intervention in medical research, as its random treatment assignment assures a causal treatment effect in expectation. Despite the popularity of RCTs, random sampling or generalizability of RCTs has received less attention and is often ignored. RCTs with low generalizability raises doubt about the effect of the intervention in the target population. In practice, most RCTs are limited in size due to geographical, logistical and budgetary issues, and patients in RCTs are rarely selected on a random basis from a well-defined population of interest. A previous review of a cohort of 122 trials funded by the United Kingdom Medical Research Council and the National Institute for Health and Care Research (NIHR) Health Technology Assessment discovered that only 31% of the trials achieved their targeted patient recruitment size and 45.1% achieved less than 80% of their original size. Women, children, the elderly, and those with common comorbidities are frequently underrepresented or excluded from medical clinical trials. Moreover, elderly patients may be underrepresented in clinical trials of drugs that are most likely to be prescribed for heart failure, diabetes, osteoarthritis, cancer, and cardiovascular disease. In cancer trials, less than 5% of elderly patients are enrolled, and only 27% adequately represented older adults and only 11% met the bar for minority racial and ethnic groups. That underrepresentation is attributable primarily to age, race, performance status, comorbid conditions, and other factors such as gender, cancer type, cancer stage, and socioeconomic status. Despite the increasing number of the elderly in the population and the relatively high incidence of cancer in this age group, most cancer trial participants are younger. Additionally, Black cancer patients are less likely to participate in cancer trials compared to their White counterparts. Currently, less than 1% of adult cancer trial participants are minorities, even though the minority population represents about one-third of the total US population. Moreover, most trial enrollees had no or fewer comorbidities and better performance status than nonparticipants, whereas cancer patients residing in rural areas and living on lower incomes or without health insurance are underrepresented.
In November 2020, U.S. Food and Drug Administration (FDA) issued a detailed guidance to enhance the diversity of RCT participants. To improve participation, the guidance discusses how to broaden eligibility criteria, how to conduct consideration for logistical and participant-related factors, and how to broaden eligibility criteria for clinical trials of investigational drugs intended to treat rare diseases. Since January 2022, the New England Journal of Medicine requires all research studies provide background information on the race, ethnicity, age, sex, and gender of the broader population in a supplementary table. The FDA will soon require researchers and companies seeking approval for late-stage clinical trials to submit a plan for ensuring diversity among trial participants and increase the number of participants from under-represented groups in drug testing. Although the importance of describing clinical trial generalizability is recognized by clinical trial reporting guidelines (e.g., CONSORT), it provides no clear guidance on tests of or estimation procedures for the generalizability of the results from RCTs.
Till now, several generalizability metrics have been proposed. Stuart et al. (2011) suggested to use the standardized mean difference (SMD) between propensity scores from a RCT sample and propensity scores from the target population to measure the generalization of the RCT sample. Tipton (2014) proposed generalizability metric β-index which measures the distributional similarity between the propensity scores from an RCT sample and the target population. Wang et al. (2017) proposed to use the C-statistic to quantify the concordance of the two model-based propensity distributions. Kolmogorov–Smirnov Distance (KSD) and Lévy Distance (LD) are used to measure imbalance in an observational study.
Generalizability Index
STANDARDIZED MEAN DIFFERENCE
Standardized mean difference (SMD) was proposed to quantify the similarity between target population and trial sample by using standardized mean difference of propensity scores from a target population and sample. The propensity score is the conditional probability of treatment assignment given a vector of observed covariates. Here, the propensity score is the conditional probability of selection in an RCT given preexisting covariates. SMD is defined as:
SMD = (1/n ∑ P̂i i∈{Si=1} − 1/N − n ∑ P̂i i∈{Si=0})/σ
Where Si indicates the membership in the sample (Si = 1) or in the population (Si = 0); P̂i is the estimated propensity score for the ith subject; N and n represent the size of population and clinical trial sample, respectively; and σ2 is the estimate of the variance of the population propensity score. SMD is a modification to the propensity score methods commonly used in quasi experiments and observational studies to address treatment selection bias.
β-Index
Tipton (2014) proposed the β-index to measure the distributional similarity between the propensity scores from experimental samples and the target population. For a set of covariates X and propensity score s = s(X), the index is defined as:
β-index = ∫ √fs(s)fp(s)ds,
where fs(s) is the distribution of propensity scores (or their logits) for the experimental sample and fp(s) is the distribution of propensity scores (or their logits) for the population.
β-index ranges from 0 to 1. A value of 0 indicates that the experimental sample and population are distantly different in the aspect of covariates X, while a value of 1 indicates that the experimental sample is like a random sample from the population. Possible rules of thumbs divide β-index into four categories: 1.00 ≥ β-index ≥ 0.90 indicating a very high level of generalization; 0.90 > β-index ≥ 0.80 indicating a high level of generalization; 0.80 > β-index ≥ 0.50 representing a medium level of generalization; and β-index < 0.50 indicating a low level of generalization.
C-STATISTIC
C-statistic or area under the receiver operating characteristic curve (AUC) was proposed by Wang et al. to quantify the concordance of the two model-based propensity score distributions. The C-statistic has long been understood to quantify the strength of a set of covariates to discriminate between two classes and is a measure of goodness of fit for binary outcomes in logistic regression models. The C-statistic is equal to the area under receiver operating characteristic (ROC) curve, which is a plot of sensitivity versus 1 minus specificity.
C-statistic = ∫ ROC(t)dt
Hosmer and Lemeshow (2000) suggested cut off points of the C-statistic for assessing discrimination of a model. Here, we applied their rules but in the opposite way when assessing generalizability of RCT. If the experimental sample is approximately a simple random sample from the target population, then C-statistic = 0.5 is considered as no discrimination (random selection); 0.5 < C-statistic < 0.7 is considered as poor discrimination (outstanding generalizability); 0.7 ≤ C-statistic <0.8 is considered as acceptable discrimination (excellent generalizability); 0.8 ≤ C-statistic < 0.9 is considered as excellent discrimination (acceptable generalizability); C-statistic ≥ 0.9 is considered as outstanding discrimination (poor generalizability).
Kolmogorov–Smirnov Distance
Kolmogorov-Smirnov distance (KSD) is defined as the maximum vertical distance between two cumulative distribution functions.
KSD = maxx|Fŝ(x)−F̂p(x)|,
where Fŝ(x) and F̂p(x) represent cumulative functions from two distributions. KSD reaches 0 when Fŝ(x) and F̂p(x) are equivalent, and the similarity decreases when KSD increases, with a maximum value of 1. Low KSD indicates better balance in a cohort study or better RCT generalizability when Fŝ(x) and F̂p(x) are cumulative distribution of propensity scores from the sample and population.
LÉVY DISTANCE
Compared to Kolmogorov-Smirnov distance, Lévy distance (LD) measures both horizontal and vertical distance. LD is the side length of the largest square that can be inscribed between two cumulative distribution functions:
LD = minε {ε > 0: F̂p(x − ε)−ε ≤ F̂s(x) ≤ F̂p(x + ε)+ε for all x},
where Fŝ(x) and F̂p(x) represent cumulative functions from two distributions. LD ranges from 0 to 1, with lower values indicating better balance in a cohort study or better RCT generalizability.
Unfortunately, there is still no consensus on which metrics should be used to measure the generalizability of an RCT. In this paper, we aim to compare various existing statistical indices for assessing the generalizability of RCTs. The remainder of this article is organized as follows. In Section 2, we simulate a target population with treatment effect size of 0.5 and 7 covariates. From the simulated population, random and nonrandom clinical trials with different covariates and sample sizes were created. In Section 3, we calculate and evaluate the 5 indexes described above. We aim to identify indices that are minimally affected by small sample sizes and limited observed covariates, while reliably capturing the bias introduced by trial selection. Our findings and conclusions are discussed in Section 4 and Section 5, respectively.
2. Methodology
2.1 TARGET POPULATION
To simulate the target population, we started with a Bernoulli random variable, X, with marginal probability 0.5 for treatment assignment (new treatment versus a placebo). The outcome was a continuous variable (Y) conditioning on treatment and covariates via a linear regression model with an error term that follows the standard normal distribution. The population regression coefficient of the treatment was 0.5, which resulted in an effect size of 0.5 (Cohen’s d, new treatment was 0.5 SD better than the placebo on a continuous outcome). Age was simulated under a truncated normal distribution with mean = 50 and SD = 14, and it ranged from 18 to 90. The regression coefficient of age was − 0.01. The interaction coefficient between age and treatment was -0.01. A measure of motivation was simulated with mean = 4.5, SD = 2, and ranged from 0 to 10. The regression coefficient of motivation was 0.06. There was an interaction (0.06) between motivation and treatment. Baseline symptoms (BL) was simulated with mean=10 and SD=2. Regression coefficient of BL and interaction coefficient between BL and treatment were -0.03. Gender (coded 1 as female), race (coded 1 as white), comorbidity (coded 1 as having common medical conditions) and health insurance (coded 1 as having insurance) were simulated as dichotomous covariates with probabilities of 0.5, 0.7, 0.4, and 0.4, respectively. The regression coefficients were 0.1, 0.1, −0.1 and 0.1 for gender, race, comorbidity and insurance, respectively. The regression coefficients for the interactions with the treatment were 0.1, 0.1, −0.1 and 0.1 for gender, race, comorbidity and insurance, respectively. We then calculated Y using intercept β0 = 20 from a linear regression model.
2.2 RANDOM TRIALS
Performances of generalizability metrics were first assessed under random trials, where the standard values of SMD, KSD and LD are 0, standard values of β-Index is 1, and the standard value of C-Statistic is 0.5. Absolute bias and mean square error were used as two evaluation criteria. Absolute bias was defined as the absolute deviation of one index value from its standard values. Mean square error measured the average of the squares of the deviation. Metrics were assessed under two aspects: 1. robustness to sample size (from n=20 to n=1000) and 2. robustness to the number of observed covariates (from 1 to 7).
2.2.1 Robustness to Sample Size
Due to geographical, logistical and budgetary issues, most clinical trials are limited in size compared to observational studies. Therefore, investigating the performance of different generalizability indexes with random trials of varying sample size is critically important. A functional generalizability measure should be least affected by the sample size, especially when sample size is small. An index which is closest to its standard value under random sampling regardless of sample size is favored. We generated 18 random clinical trials with sample sizes ranging from 20 to 1000 from the target population. 100 repeated trials were generated for each sample size.
2.2.2 Robustness to Number of Observed Covariates
It is well known that the propensity score is a conditional probability of assignment to one group vs. another group given the observed covariates. Yet, failing to consider influential unobserved covariates results in potential hidden bias, which directly impairs the accuracy of the metrics built on propensity scores, e.g. SMD, β-Index, C-statistic, KSD, and LD. We selected 100 repeated random clinical trials with sample size 100 from the target population (n=1000000). Propensity scores were generated based on different numbers of observed covariates. Aggregated values of 5 metrics from 100 repetitions were calculated based on propensity scores for each set of observed covariates.
2.3 NONRANDOM TRIALS
Inference from clinical trial results to a population requires that the trial subjects are randomly selected from the target population and that the treatment is randomly assigned within the trial. While randomization within the trial can usually be achieved, the randomness of the trial regarding the target population is hardly met. Therefore, comparing indexes and finding which one could measure the deviation of a trial from the patient population has extreme importance in accessing the quality of a trial. In order to explore how sample size and the number of observed covariates impact metrics for assessing the generalizability of nonrandom trials, we compared metrics among 5 circumstances: 1) nonrandom trial with sample size 400 and metrics calculated from 7 observed covariates, 2) nonrandom trial with sample size 100 and metrics calculated from 7 observed covariates, 3) nonrandom trials with sample size 40 and metrics calculated from 7 observed covariates, 4) nonrandom trial with sample size 100 and metrics calculated from 3 observed covariates (motivation, race, and baseline symptom), and 5) nonrandom trial with sample size 100 and metrics calculated from 5 observed covariates (comorbidity, age, motivation, race, and BL). Nonrandom samples were generated from the population by adjusting the distributions of different covariates. The degree of non-randomness of a trial is quantified by bias (%), which was defined as 100 * (sample treatment effect – population treatment effect) / population treatment effect. Biased samples with bias ranging between 1% to 100% were generated and all metrics were calculated for each selected sample. When bias increases, SMD should increase from 0 to positive infinity; C-Statistic should increase from 0.5 to 1; β-Index should decrease from 1 to 0; and LD and KSD should increase from 0 to 1. Except for SMD, all other metrics have both lower bound and upper bound. Mean absolute error (MAE) and R square (R2) from a simple linear regression model were used to evaluate the metrics in predicting bias, with metric as a predictor and bias as the outcome. MAE was calculated as the average absolute error between predicted Bias from a linear fitted model and the true bias. 50 nonrandom samples were selected for each of the 5 scenarios, with bias ranging from 1.0% to 100.0%. For each defined bias, 100 repeated random clinical trials were selected. All 5 metrics were calculated for each sample, and the results from 100 samples were aggregated. MAE, and R2 are reported for each metric.
3. Results
3.1 RANDOM TRIAL
3.1.1 Varying Sample Size
| Sample Size | SMD | ABS | MSE | C | ABS | MSE | β | ABS | MSE | KSD | ABS | MSE | LD | ABS | MSE |
|---|---|---|---|---|---|---|---|---|---|---|---|---|---|---|---|
| 20 | 0.6052 | 0.6052 | 0.4063 | 0.6604 | 0.1604 | 0.0278 | 0.9089 | 0.0911 | 0.0102 | 0.3209 | 0.3209 | 0.1086 | 0.2070 | 0.2070 | 0.0473 |
| 30 | 0.4775 | 0.4775 | 0.2493 | 0.6292 | 0.1292 | 0.0181 | 0.9413 | 0.0587 | 0.0043 | 0.2584 | 0.2584 | 0.0702 | 0.1516 | 0.1516 | 0.0253 |
| 40 | 0.4081 | 0.4081 | 0.1807 | 0.6093 | 0.1093 | 0.0130 | 0.9557 | 0.0443 | 0.0026 | 0.2239 | 0.2239 | 0.0529 | 0.1230 | 0.1230 | 0.0172 |
| 50 | 0.3792 | 0.3792 | 0.1582 | 0.6018 | 0.1018 | 0.0115 | 0.9633 | 0.0367 | 0.0017 | 0.2034 | 0.2034 | 0.0440 | 0.1073 | 0.1073 | 0.0130 |
| 60 | 0.3473 | 0.3473 | 0.1310 | 0.5960 | 0.0960 | 0.0099 | 0.9687 | 0.0313 | 0.0013 | 0.1952 | 0.1952 | 0.0398 | 0.0970 | 0.0970 | 0.0104 |
| 70 | 0.3022 | 0.3022 | 0.0977 | 0.5850 | 0.0850 | 0.0077 | 0.9747 | 0.0253 | 0.0008 | 0.1720 | 0.1720 | 0.0306 | 0.0798 | 0.0798 | 0.0071 |
| 80 | 0.2827 | 0.2827 | 0.0865 | 0.5785 | 0.0785 | 0.0066 | 0.9776 | 0.0224 | 0.0007 | 0.1608 | 0.1608 | 0.0270 | 0.0715 | 0.0715 | 0.0057 |
| 90 | 0.2737 | 0.2737 | 0.0805 | 0.5760 | 0.0760 | 0.0062 | 0.9807 | 0.0193 | 0.0005 | 0.1534 | 0.1534 | 0.0248 | 0.0659 | 0.0659 | 0.0049 |
| 100 | 0.2723 | 0.2723 | 0.0793 | 0.5748 | 0.0748 | 0.0060 | 0.9807 | 0.0193 | 0.0005 | 0.1503 | 0.1503 | 0.0235 | 0.0647 | 0.0647 | 0.0047 |
| 200 | 0.1776 | 0.1776 | 0.0336 | 0.5506 | 0.0506 | 0.0027 | 0.9897 | 0.0103 | 0.0003 | 0.1035 | 0.1035 | 0.0111 | 0.0325 | 0.0325 | 0.0012 |
| 300 | 0.1460 | 0.1460 | 0.0227 | 0.5418 | 0.0418 | 0.0019 | 0.9929 | 0.0071 | 0.0001 | 0.0865 | 0.0865 | 0.0078 | 0.0228 | 0.0228 | 0.0006 |
| 400 | 0.1235 | 0.1235 | 0.0164 | 0.5351 | 0.0351 | 0.0013 | 0.9935 | 0.0065 | 0.0002 | 0.0716 | 0.0716 | 0.0054 | 0.0158 | 0.0159 | 0.0003 |
| 500 | 0.1203 | 0.1203 | 0.0154 | 0.5336 | 0.0336 | 0.0012 | 0.9959 | 0.0041 | 0.0000 | 0.0662 | 0.0662 | 0.0045 | 0.0141 | 0.0141 | 0.0002 |
| 600 | 0.1041 | 0.1041 | 0.0117 | 0.5295 | 0.0295 | 0.0009 | 0.9963 | 0.0037 | 0.0000 | 0.0590 | 0.0590 | 0.0036 | 0.0105 | 0.0107 | 0.0002 |
| 700 | 0.0965 | 0.0965 | 0.0098 | 0.5273 | 0.0273 | 0.0008 | 0.9961 | 0.0039 | 0.0000 | 0.0546 | 0.0546 | 0.0031 | 0.0088 | 0.0088 | 0.0001 |
| 800 | 0.0933 | 0.0933 | 0.0093 | 0.5266 | 0.0266 | 0.0008 | 0.9951 | 0.0049 | 0.0002 | 0.0526 | 0.0526 | 0.0029 | 0.0075 | 0.0080 | 0.0001 |
| 900 | 0.0858 | 0.0858 | 0.0078 | 0.5243 | 0.0243 | 0.0006 | 0.9958 | 0.0042 | 0.0001 | 0.0496 | 0.0496 | 0.0026 | 0.0075 | 0.0076 | 0.0001 |
| 1000 | 0.0849 | 0.0849 | 0.0078 | 0.5238 | 0.0238 | 0.0006 | 0.9974 | 0.0026 | 0.0000 | 0.0474 | 0.0474 | 0.0024 | 0.0059 | 0.0065 | 0.0001 |
Change 0.5203 0.1366 0.0885 0.2735 0.2011
Note: ABS represents absolute bias; MSE represents mean square error; population treatment effect = 0.5 and there are 7 covariates; Standard values of SMD, C-statistic, β-index, KSD and LD are 0, 0.5, 1, 0 and 0.
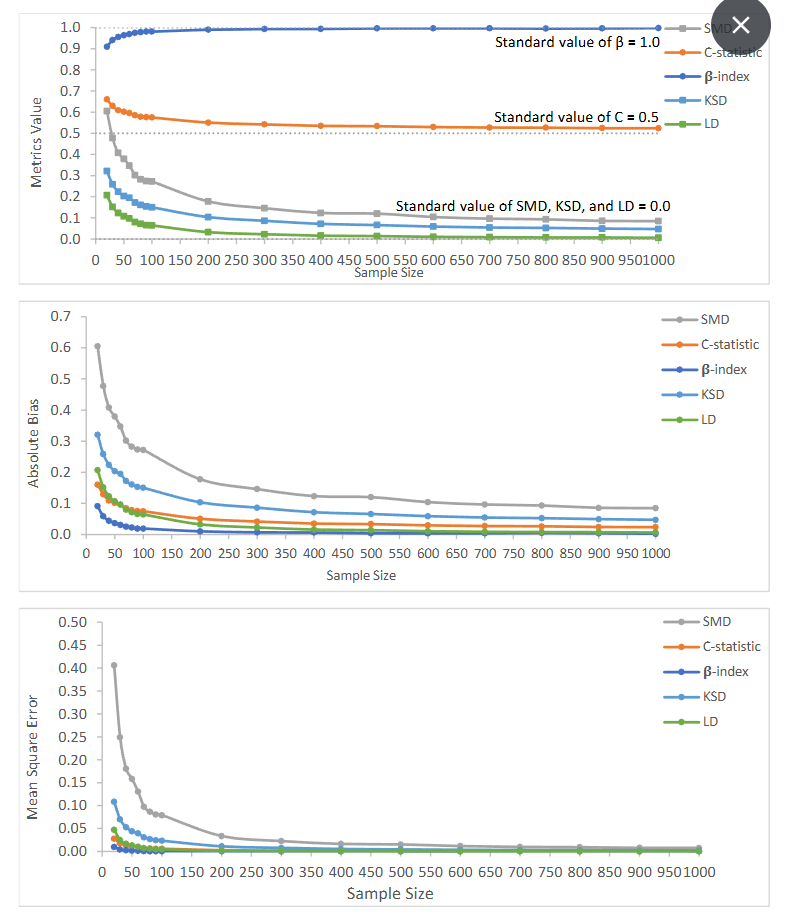
Figure 1: Value of generalizability metrics and their absolute bias and mean square error with increasing sample size
3.1.2 Varying Number of Observed Covariates
| Covariate | SMD | ABS | MSE | C | ABS | MSE | β | ABS | MSE | KSD | ABS | MSE | LD | ABS | MSE |
|---|---|---|---|---|---|---|---|---|---|---|---|---|---|---|---|
| 1 | 0.0770 | 0.0770 | 0.0095 | 0.5219 | 0.0219 | 0.0007 | 0.9736 | 0.0264 | 0.0201 | 0.0847 | 0.0847 | 0.0078 | 0.0140 | 0.0140 | 0.0004 |
| 2 | 0.1200 | 0.1200 | 0.0180 | 0.5334 | 0.0334 | 0.0014 | 0.9500 | 0.0500 | 0.0120 | 0.0966 | 0.0966 | 0.0101 | 0.0303 | 0.0303 | 0.0014 |
| 3 | 0.1604 | 0.1604 | 0.0298 | 0.5457 | 0.0457 | 0.0025 | 0.9773 | 0.0227 | 0.0022 | 0.1122 | 0.1122 | 0.0134 | 0.0370 | 0.0370 | 0.0018 |
| 4 | 0.1949 | 0.1949 | 0.0430 | 0.5555 | 0.0555 | 0.0035 | 0.9875 | 0.0126 | 0.0002 | 0.1237 | 0.1237 | 0.0162 | 0.0427 | 0.0427 | 0.0023 |
| 5 | 0.2205 | 0.2205 | 0.0534 | 0.5626 | 0.0626 | 0.0043 | 0.9844 | 0.0156 | 0.0003 | 0.1307 | 0.1307 | 0.0179 | 0.0497 | 0.0497 | 0.0029 |
| 6 | 0.2416 | 0.2416 | 0.0634 | 0.5686 | 0.0686 | 0.0051 | 0.9833 | 0.0167 | 0.0004 | 0.1399 | 0.1399 | 0.0205 | 0.0563 | 0.0563 | 0.0037 |
| 7 | 0.2631 | 0.2631 | 0.0750 | 0.5742 | 0.0742 | 0.0060 | 0.9828 | 0.0172 | 0.0004 | 0.1467 | 0.1467 | 0.0228 | 0.0621 | 0.0621 | 0.0045 |
Change 0.1861 0.0523 0.0375 0.062 0.0481
Note: ABS represents absolute bias; MSE represents mean square error; population treatment effect = 0.5; Standard values of SMD, C-statistic, β-index, KSD and LD are 0, 0.5, 1, 0 and 0.
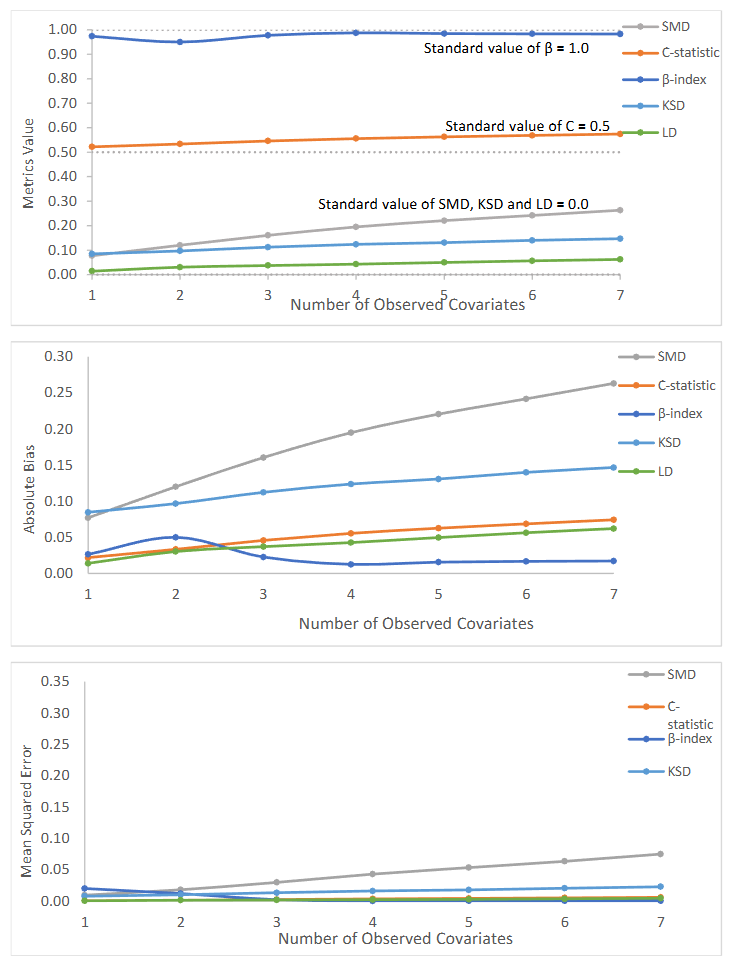
Figure 2: Value of generalizability metrics and their absolute bias and mean square error with varying number of observed covariates.
3.2 NONRANDOM TRIAL
Based on 7 observed covariates and sample sizes 40, 100, and 400, we selected nonrandom trials with bias from 1.8% to 99.4%. Table 3 presents all metrics with increasing sample bias. SMD (0 for random trial) increased from 0.24 to 11.38, C-statistic (0.5 for random trial) increased from 0.57 to 0.98, β-index (1 for random trial) decreased from 0.98 to 0.22, KSD (0 for random trial) increased from 0.12 to 0.88, and LD (0 for random trial) increased from 0.06 to 0.84.
| Sample Size | Sample | ES | Bias | SMD | C | β | KSD | LD |
|---|---|---|---|---|---|---|---|---|
| 40 | 1 | 0.5093 | 1.9% | 0.50 | 0.63 | 0.94 | 0.25 | 0.15 |
| 40 | 2 | 0.5170 | 3.4% | 0.67 | 0.68 | 0.90 | 0.32 | 0.23 |
| 40 | 3 | 0.5238 | 4.8% | 0.58 | 0.66 | 0.92 | 0.29 | 0.19 |
| 40 | 4 | 0.5435 | 8.7% | 0.76 | 0.70 | 0.88 | 0.36 | 0.27 |
| 40 | 5 | 0.5552 | 11.0% | 0.77 | 0.70 | 0.88 | 0.35 | 0.26 |
| 40 | 6 | 0.5687 | 13.7% | 0.77 | 0.71 | 0.89 | 0.36 | 0.26 |
| 40 | 7 | 0.5737 | 14.7% | 0.82 | 0.71 | 0.88 | 0.37 | 0.27 |
| 40 | 8 | 0.5794 | 15.9% | 0.83 | 0.72 | 0.88 | 0.37 | 0.27 |
| 40 | 9 | 0.5886 | 17.7% | 1.04 | 0.76 | 0.83 | 0.44 | 0.35 |
| 40 | 10 | 0.5967 | 19.3% | 1.06 | 0.77 | 0.82 | 0.45 | 0.36 |
| 40 | 11 | 0.6039 | 20.8% | 1.06 | 0.77 | 0.83 | 0.46 | 0.36 |
| 40 | 12 | 0.6309 | 26.2% | 1.21 | 0.79 | 0.80 | 0.48 | 0.38 |
| 40 | 13 | 0.6395 | 27.9% | 1.34 | 0.80 | 0.77 | 0.52 | 0.41 |
| 40 | 14 | 0.6462 | 29.2% | 1.28 | 0.80 | 0.78 | 0.50 | 0.40 |
| 40 | 15 | 0.6541 | 30.8% | 1.39 | 0.81 | 0.75 | 0.52 | 0.41 |
| 40 | 16 | 0.6721 | 34.4% | 1.60 | 0.83 | 0.71 | 0.55 | 0.45 |
| 40 | 17 | 0.6767 | 35.3% | 1.62 | 0.83 | 0.71 | 0.56 | 0.45 |
| 40 | 18 | 0.6906 | 38.1% | 1.81 | 0.85 | 0.67 | 0.60 | 0.49 |
| 40 | 19 | 0.6924 | 38.5% | 1.87 | 0.86 | 0.66 | 0.60 | 0.50 |
| 40 | 20 | 0.7119 | 42.4% | 2.03 | 0.87 | 0.63 | 0.62 | 0.52 |
| 40 | 21 | 0.7175 | 43.5% | 2.20 | 0.88 | 0.60 | 0.64 | 0.55 |
| 40 | 22 | 0.7274 | 45.5% | 2.40 | 0.89 | 0.57 | 0.67 | 0.58 |
| 40 | 23 | 0.7279 | 45.6% | 2.33 | 0.89 | 0.58 | 0.66 | 0.56 |
| 40 | 24 | 0.7421 | 48.4% | 2.68 | 0.91 | 0.54 | 0.69 | 0.61 |
| 40 | 25 | 0.7705 | 54.1% | 2.65 | 0.89 | 0.54 | 0.67 | 0.59 |
| 40 | 26 | 0.7717 | 54.3% | 2.49 | 0.88 | 0.54 | 0.68 | 0.59 |
| 40 | 27 | 0.7980 | 59.6% | 3.00 | 0.91 | 0.49 | 0.70 | 0.62 |
| 40 | 28 | 0.7987 | 59.7% | 2.96 | 0.91 | 0.62 | 0.67 | 0.59 |
| 40 | 29 | 0.8061 | 61.2% | 2.92 | 0.91 | 0.58 | 0.70 | 0.58 |
| 40 | 30 | 0.8168 | 63.4% | 3.30 | 0.91 | 0.63 | 0.68 | 0.59 |
| 40 | 31 | 0.8291 | 65.8% | 3.60 | 0.92 | 0.67 | 0.67 | 0.62 |
| 40 | 32 | 0.8461 | 69.2% | 3.90 | 0.93 | 0.68 | 0.64 | 0.64 |
| 40 | 33 | 0.8570 | 71.4% | 4.06 | 0.93 | 0.67 | 0.63 | 0.65 |
| 40 | 34 | 0.8655 | 73.1% | 4.24 | 0.94 | 0.68 | 0.62 | 0.66 |
| 40 | 35 | 0.8772 | 75.4% | 4.60 | 0.94 | 0.70 | 0.69 | 0.67 |
| 40 | 36 | 0.8835 | 76.7% | 4.95 | 0.95 | 0.71 | 0.68 | 0.68 |
| 40 | 37 | 0.8972 | 79.4% | 5.57 | 0.95 | 0.73 | 0.67 | 0.70 |
| 40 | 38 | 0.9070 | 81.4% | 5.77 | 0.96 | 0.75 | 0.66 | 0.73 |
| 40 | 39 | 0.9139 | 82.8% | 6.35 | 0.96 | 0.76 | 0.64 | 0.74 |
| 40 | 40 | 0.9264 | 85.3% | 6.87 | 0.96 | 0.77 | 0.62 | 0.76 |
| 40 | 41 | 0.9358 | 87.2% | 7.64 | 0.97 | 0.78 | 0.60 | 0.77 |
| 40 | 42 | 0.9434 | 88.7% | 7.65 | 0.97 | 0.79 | 0.58 | 0.78 |
| 40 | 43 | 0.9498 | 90.0% | 8.54 | 0.98 | 0.80 | 0.57 | 0.79 |
| 40 | 44 | 0.9506 | 90.1% | 8.28 | 0.97 | 0.80 | 0.56 | 0.78 |
| 40 | 45 | 0.9590 | 91.8% | 9.01 | 0.97 | 0.80 | 0.56 | 0.79 |
| 40 | 46 | 0.9591 | 91.8% | 8.75 | 0.98 | 0.81 | 0.56 | 0.79 |
| 40 | 47 | 0.9654 | 93.1% | 9.13 | 0.98 | 0.81 | 0.60 | 0.80 |
| 40 | 48 | 0.9737 | 94.7% | 9.65 | 0.98 | 0.82 | 0.58 | 0.81 |
| 40 | 49 | 0.9933 | 98.7% | 11.98 | 0.98 | 0.83 | 0.53 | 0.83 |
| 40 | 50 | 0.9971 | 99.4% | 12.40 | 0.98 | 0.84 | 0.53 | 0.84 |
Note: ES represents trial effect size; population true treatment effect = 0.5; there are 7 covariates; all measurements are calculated based on sample size 40, 100 and 400 and all 7 covariates.
3.2.1 Impact of Number of Observed Covariates
| Sample | ES | Bias | SMD | C | β | KSD | LD |
|---|---|---|---|---|---|---|---|
| 3 | 0.5101 | 2.0% | 0.16 | 0.55 | 0.98 | 0.11 | 0.04 |
| 5 | 0.5195 | 3.9% | 0.17 | 0.55 | 0.96 | 0.11 | 0.04 |
| 7 | 0.5233 | 4.7% | 0.15 | 0.54 | 0.98 | 0.10 | 0.03 |
4. Discussion
While randomized controlled trials are widely considered as the gold standard in medical research, they are criticized because of potential lack of generalizability, as specific groups of trial patients may be underrepresented compared to the target patient population. Few research studies have addressed how to assess and evaluate the generalizability of RCTs. As we know, patients are rarely selected on a random basis from a well-defined patient population of interest into a clinical trial. As patients cannot be forced to join a trial, it is not always possible to have a random sample for a clinical trial. Women, children, the elderly, and those with common comorbidities are frequently underrepresented or excluded from clinical trials. A random and representative sample is one indispensable assumption for generalizing results from a RCT to the general patient population. Determining how a representative RCT sample might be is extremely important. Yet, we can never know how well a treatment effect estimate can be generalized to the patient population without data from the patient population. What we can do is to calculate the generalizability index when a clinical trial is completed. This simulation study evaluated existing statistical methods for generalizability including SMD, C-statistic, β-Index, as well as KSD and LD. There are no conclusive rules of thumb for the SMD. The fact that SMD ranges from 0 to infinity without upper limit may also impair the practicality of the SMD. In contrast, rules of thumb for C-statistic (from 0.5 to 1) and β-Index (from 1 to 0) are well-defined and they are confined within boundary intervals. While KSD and LD range from 0 to 1, little research has proposed cutoff points for them. When all covariates are observed but sample size varies, we observed that β-index had the smallest bias and variation with random trials. According to the cutoff points of the β-index suggested by Tipton (2014), a β-index bigger or equal to 0.90 suggests a very high level of generalization. While a C-statistic between 0.5 and 0.7 is considered as poor discrimination in assessing fit of models, we use this range as an indicator of excellent generalizability in our study. Our results show that β-index stayed above 0.90 and C-statistic stayed between 0.52 and 0.66 as sample size increased from 20 to 1000, suggesting that β-index and C-statistic are reliable in reflecting random selection even when the sample size was small. SMD is sensitive to sample size, as the range of SMD with sample size from 20 to 1000 was largest (0.60515 – 0.08486) compared to other metrics. As we mentioned previously, SMD larger than 0.25 SD or 0.1 SD is considered as a large deviation. From our observation, however, SMD tended to be larger than 0.25 SD when sample size <= 100, and it was larger than 0.1 SD when sample size <= 600. SMD might not be a reliable choice, especially when measuring the generalizability of an RCT which has a small sample size. LD was close to its standard value (0) when sample size was bigger than 70, the bias of LD was smaller than other metrics, except for β-index. Yet, the C-statistic was better than LD with sample size < 70. Our simulated random trials found that the KSD did perform as well as β-index, C-statistic, and LD as its absolute bias was larger than those metrics.
We observed that the β-index was least affected by number of observed covariates compared to other metrics, for randomly selected samples with a sample size of 100. The absolute bias of β-index was least among all metrics when observed covariates >=3. The β-Index and C-statistic excellently reflected the randomness of the selected trials, as values of the β-index were over 0.95 (β-index ≥ 0.90 suggests a very high level of generalizability) and values of the C-statistic were less than 0.58 (between 0.5 and 0.7 is considered as excellent generalizability) with number of observed covariates varying from 1 to 7. SMD was larger than 0.1 SD when the number of covariates >1 and was larger than 0.25 SD when number of covariates >6. Again, SMD failed to show the random status of selected samples if we use the current proposed thresholds. With nonrandom trials based on sample size 400 and 7 covariates observed, our results showed that β-index, followed by LD and KSD, was most associated with bias, compared to other metrics. β-index also had higher prediction ability and lowest mean absolute error between the predicted bias and true bias. When all covariates were observed but sample size was reduced (100 and 40), we did not find significant differences for SMD, C-statistic, β-index, KSD and LD.
β-Index performed well for both random and nonrandom samples. It is based on the distributions of propensity scores rather than only the average difference of the propensity scores from the sample and the population. β-Index did not perform well when the number of covariates was too small. It’s easy to interpret the β-Index value and use in clinical trials as it ranges from 0 to 1, and has the following rules of thumb: 1.00 ≥ β-index ≥ 0.90 indicating a very high level of generalization; 0.90 > β-index ≥ 0.80 indicating a high level of generalization; 0.80 > β-index ≥ 0.50 representing a medium level of generalization; and β-index < 0.50 indicating a low level of generalization. On average, C-statistics performed well. When the number of covariates was small, C-statistics still performed well. It ranges from 0 to 1 and has the following Rules of thumb: C-statistic = 0.5
5. Conclusion
The development of better generalizability metrics for clinical trials remains an important need. The objective of this paper was to demonstrate methods for estimating generalizability indexes and to guide clinical researchers in interpreting these measures. Our work has resulted in recommending the use of the β-index and C-statistic due to their statistical performance, because they are easy to interpret, and because clear categories of generalizability can be determined such as very-high, high, medium, or low levels of generalizability. β-index ranges from 0 to 1, and C-statistic ranges from 0.5 to 1. A β-index value of 1 or a C-statistic value of 0.5 suggests the trial sample closely reflects the characteristics of patient population, demonstrating very high generalizability. In contrast, a β-index value of 0 or a C-statistic value of 1 suggests the trial sample deviate significantly from the patient population, resulting in very low generalizability. The β-index can be used to create four level-of-generalizability categories: 1.00 ≥ β-index ≥ 0.90 indicating a very-high level of generalizability; 0.90 > β-index ≥ 0.80 indicating a high level of generalizability; 0.80 > β-index ≥ 0.50 representing a medium level of generalizability; and β-index < 0.50 indicating a low level of generalizability. Like the β-index, the C-statistic can be used to create four level-of-generalizability categories. We proposed the following cut-off points for the C-statistic: 0.5 ≤ C-statistic < 0.7 indicating a very-high level of generalizability; 0.7 ≤ C-statistic < 0.8 indicating a high level of generalizability; 0.8 ≤ C-statistic < 0.9 indicating a medium level of generalizability; and C-statistic ≥ 0.9 indicating a low level of generalizability. The β-index is recommended if researchers have measured all or most of the relevant covariates that predict selection into the experimental sample. The C-statistic is recommended if researchers have measured a small number of the relevant covariates that predict selection in the trial sample. Our paper provides guidance for clinical doctors and trialists on how to estimate, interpret, and report statistical indexes of generalizability for clinical trials. Trialists should report a generalizability index after completing a trial and encourage requests from CONSORT, academic journals, and the FDA to incorporate generalizability indexes in clinical trial reporting.
Conflict of Interest
The Authors declare that there is no conflict of interest.
References
1. Stuart EA, Cole SR, Bradshaw CP, Leaf PJ. The use of propensity scores to assess the generalizability of results from randomized trials. Journal of the Royal Statistical Society: Series A (Statistics in Society). 2011;174(2):369-386.
2. Greenhouse JB, Kaizar EE, Kelleher K, Seltman H, Gardner W. Generalizing from clinical trial data: a case study. The risk of suicidality among pediatric antidepressant users. Statistics in Medicine. 2008;27(11):1801-1813.
3. Wang W, Ma Y, Huang Y, Chen H. Generalizability analysis for clinical trials: a simulation study. Statistics in Medicine. 2017;36(10):1523-1531.
4. Weng C, Li Y, Ryan P, et al. A distribution-based method for assessing the differences between clinical trial target populations and patient populations in electronic health records. Applied Clinical Informatics. 2014;5(2):463.
5. Dekkers O, Elm Ev, Algra A, Romijn J, Vandenbroucke J. How to assess the external validity of therapeutic trials: a conceptual approach. International Journal of Epidemiology. 2010;39(1):89-94.
6. Cahan A, Cahan S, Cimino JJ. Computer-aided assessment of the generalizability of clinical trial results. International Journal of Medical Informatics. 2017;99:60-66.
7. Rothwell PM. External validity of randomised controlled trials:“to whom do the results of this trial apply?”. The Lancet. 2005;365(9453):82-93.
8. Savoca MR, Ludwig DA, Jones ST, et al. Geographic information systems to assess external validity in randomized trials. American Journal of Preventive Medicine. 2017;53(2):252-259.
9. Teare MD, Dimairo M, Shephard N, Hayman A, Whitehead A, Walters SJ. Sample size requirements to estimate key design parameters from external pilot randomised controlled trials: a simulation study. Trials. 2014;15(1):1-13.
10. Clark T, Berger U, Mansmann U. Sample size determinations in original research protocols for randomised clinical trials submitted to UK research ethics committees. BMJ. 2013;346.
11. Heiat A, Gross CP, Krumholz HM. Representation of the elderly, women, and minorities in heart failure clinical trials. Archives of Internal Medicine. 2002;162(15).
12. Elting LS, Cooksley C, Bekele BN, et al. Generalizability of cancer clinical trial results: prognostic differences between participants and nonparticipants. Cancer. 2006;106(11):2452-2458.
13. Le Strat Y, Rehm J, Le Foll B. How generalisable to community samples are clinical trial results for treatment of nicotine dependence: a comparison of common eligibility criteria with respondents of a large representative general population survey. Tobacco Control. 2011;20(5):338-343.
14. Saunders C, Byrne CD, Guthrie B, et al. External validity of randomized controlled trials of glycaemic control and vascular disease: how representative are participants? Diabetic Medicine. 2013;30(3):300-308.
15. Van Spall HG, Toren A, Kiss A, Fowler RA. Eligibility criteria of randomized controlled trials published in high-impact general medical journals: a systematic sampling review. JAMA, 2007;297(11):1233-1240.
16. Liberopoulos G, Trikalinos NA, Ioannidis JP. The elderly were under-represented in osteoarthritis clinical trials. Journal of Clinical Epidemiology. 2009;62(11):1218-1223.
17. Hutchins LF, Unger JM, Crowley JJ, Coltman Jr CA, Albain KS. Underrepresentation of patients 65 years of age or older in cancer-treatment trials. New England Journal of Medicine. 1999;341(27):2061-2067.
18. Rehman H. Under-representation of the elderly in clinical trials. European Journal of Internal Medicine. 2005;16(6):385-386.
19. Lee PY, Alexander KP, Hammill BG, Pasquali SK, Peterson ED. Representation of elderly persons and women in published randomized trials of acute coronary syndromes. JAMA< 2001;286(6):708-713.
20. Murthy VH, Krumholz HM, Gross CP. Participation in cancer clinical trials: race-, sex-, and age-based disparities. JAMA, 2004;291(22):2720-2726.
21. Swanson GM, Bailar III JC. Selection and description of cancer clinical trials participants—science or happenstance? Cancer. 2002;95(5):950-959.
22. Varma T, Mello M, Ross JS, Gross C, Miller J. Metrics, baseline scores, and a tool to improve sponsor performance on clinical trial diversity: retrospective cross sectional study. BMJ Medicine. 2023;2(1).
23. Al-Refaie WB, Vickers SM, Zhong W, Parsons H, Rothenberger D, Habermann EB. Cancer trials versus the real world in the United States. Annals of Surgery. 2011;254(3):438-443.
24. Sateren WB, Trimble EL, Abrams J, et al. How sociodemographics, presence of oncology specialists, and hospital cancer programs affect accrual to cancer treatment trials. Journal of Clinical Oncology. 2002;20(8):2109-2117.
25. U. S. Food and Drug Administration. Enhancing the diversity of clinical trial populations eligibility criteria, enrollment practices, and trial designs guidance for industry. 2020. https://www.fda.gov/regulatory-information/search-fda-guidance-documents/enhancing-diversity-clinical-trial-populations-eligibility-criteria-enrollment-practices-and-trial.
26. Editors. Striving for diversity in research studies. In. Vol 385: Mass Medical Soc; 2021:1429-1430.
27. Kozlov M. FDA to require diversity plan for clinical trials. Nature. 2023. https://www.nature.com/articles/d41586-023-00469-4.
28. Hopewell S, Chan A, Collins G, et al. CONSORT 2025 explanation and elaboration: updated guideline for reporting randomised trials. BMJ 2025;389:e081124. doi: 10.1136/bmj-2024-081124.
29. Tipton E. How generalizable is your experiment? An index for comparing experimental samples and populations. Journal of Educational and Behavioral Statistics. 2014;39(6):478-501.
30. Belitser SV, Martens EP, Pestman WR, Groenwold RH, De Boer A, Klungel OH. Measuring balance and model selection in propensity score methods. Pharmacoepidemiology and Drug Safety. 2011;20(11):1115-1129.
31. Franklin JM, Rassen JA, Ackermann D, Bartels DB, Schneeweiss S. Metrics for covariate balance in cohort studies of causal effects. Statistics in Medicine. 2014;33(10):1685-1699.
32. Rosenbaum PR, Rubin DB. The central role of the propensity score in observational studies for causal effects. Biometrika. 1983;70(1):41-55.
33. Kaizar E, Lin C, Faries D, Johnston J. Reweighting estimators to extend the external validity of clinical trials: methodological considerations. Journal of Biopharmaceutical Statistics. 2023;33(5):515-543. doi: 10.1080/10543406.2022.2162067
34. Hosmer DW, Lemeshow S. Applied Logistic Regression. John Wiley & Sons. New York. 2000.