

Personal Identification via Hunter-Schreger Bands in Teeth
Personal identification through Hunter Schreger bands of dental enamel. Developing Algorithms for Automated Image Processing and Comparison
Giovani Bressan Fogalli1, Sergio Roberto Peres Line1
1.Piracicaba Dental School, University of Campinas, Piracicaba, Brazil
OPEN ACCESS
PUBLISHED: 31 July 2025
CITATION: Fogalli, GB., Peres Line, SR., 2025. Personal identification through Hunter Schreger bands of dental enamel. Developing Algorithms for Automated Image Processing and Comparison. Medical Research Archives, [online] 13(7). https://doi.org/10.18103/mra.v13i7.6802
COPYRIGHT © 2025 European Society of Medicine. This is an open-access article distributed under the terms of the Creative Commons Attribution License, which permits unrestricted use, distribution, and reproduction in any medium, provided the original author and source are credited.
DOI https://doi.org/10.18103/mra.v13i7.6802
ISSN 2375-1924
ABSTRACT
Tooth enamel is the hardest tissue in the human body, formed by prism layers in regularly alternating directions. These prisms form the Hunter-Schreger Band (HSB) pattern when underside illumination, which is composed of light and dark stripes resembling fingerprints. Hunter-Schreger Band patterns are highly variable and unique for each tooth and can be used for personal identification. Hunter-Schreger Band images of 115 teeth were captured with a Canon EOS 5D mark III camera coupled to an InfiniProbe TS-160 lens (Infinity Photo-Optical Company, Boulder, Co, USA). The algorithms were developed in Python 3.9 using image-specific libraries NumPy, Scikit-Image, OpenCV, SciPy and TensorFlow. The evaluation of performance of HSB filtering and binarization was performed visually and indirectly. The feature extraction and matching algorithms were created upon adaptations from fingerprint techniques and revealed as the result of matching evaluation an equal error rate of 0.061, when both enlightened sides of each tooth were used together in a sample of 115 extracted teeth. The pipeline developed here allows the capture, image treatment, and matching among the images stored in the database. This demonstrated the potential of the new biometric trait.
Keywords:
Enamel microstructure, Hunter-Schreger bands, human identification.
THE EUROPEAN SOCIETY OF MEDICINE
Medical Research Archives, Volume 13 Issue 7
RESEARCH ARTICLE
Introduction
Personal identification is becoming increasingly important in modern life. It can be necessary for simple procedures, such as accessing a computer network, or for more complex situations, such as post-mortem identification and criminal analysis. It is obtained using passwords, physical characteristics, photographs, iris pattern, macroscopic characteristics of the dentition, fingerprints and, more recently, DNA analysis. However, post-mortem identification methods have certain limitations, especially in cases where the bodies under investigation have undergone decomposition, fragmentation or putrefaction, such as in extremely charred corpses discovered several years after death or when only fragments of tissue are found, such as in explosions or other forms of mass disasters. To identify a single individual based on biometric methods, the following characteristics are desirable: high uniqueness for each individual, easy transmission of the characteristic, easy to obtain, invariant over time (without significant changes over a period of time), capable of being acquired with minimally invasive methods, and low cost. Fingerprinting is one of the best-known biometric procedures used for human identification. This characteristic is virtually unique to each individual and is quite accurate for human identification. Genomic DNA analysis has become a powerful method for human identification. This method, however, requires highly specialized professionals, is laborious and relatively expensive, and its analysis takes several days, making it impossible to obtain immediate results. In addition, the success of the analysis of DNA is also highly dependent on the preservation of the collected specimen and the absence of contamination. The dental examination compares ante-mortem records (radiographs, odontograms, and patient documents) with post-mortem characteristics. When these records are not available or are insufficient for identification, anthropological analysis is the last alternative for identification by estimating age, sex, race, among other characteristics. However, the chance of identification at this stage is reduced.
Teeth are often used in human identification. Dental enamel is the tissue with the highest amount of mineral in the body (95%). The high degree of mineralization gives the enamel high resistance and hardness, allowing this tissue to withstand extreme conditions, such as exposure to high temperatures, humidity and excessive pressure. Dental features have proven particularly useful for identifying victims of high-temperature charring in mass disasters when visual recognition and fingerprint identification are no longer possible. In most mammalian species, including humans, enamel is characterized by layers of prisms arranged regularly in alternating directions at an angle of up to 90°. These successive layers of prisms form Hunter-Schreger Bands (HSBs) that appear as light and dark layers when observed under low-power illumination in a stereoscopic magnifying glass. The light and dark bands can be inverted by changing the direction of the illumination source. This optical phenomenon occurs because the prisms function as optical fibers when exposed to a direct light source. It is believed that the HSBs, which exist in most mammalian species, serve as an adaptive functional structure that could increase the strength, durability, and protection of enamel against the formation and propagation of cracks, breaks, and fissures. The structure of HSBs can be observed in intact teeth of mammals up to 60 million years old, and in human teeth heated to 300°C for 1 h, facts that demonstrate the great resistance of these structures to external factors. When observed with lateral illumination, the light and dark bands of human HSBs resemble a fingerprint. In a study using 262 extracted human lower incisors and 30 teeth photographed in situ, we showed that the HSB pattern can be analyzed and differentiated by fingerprint software (Verifinger, Neurotechnology), allowing human identification based on HSB. However, the development and improvement of this methodology has been hampered by the difficulty in obtaining good-quality images, especially in the mouths of individuals (in situ). There are several obstacles that need to be overcome for this methodology to be viable for large-scale use. It has recently been shown that the use of a polarizing filter and vegetable oil impregnation can substantially improve the quality of HSB images obtained from extracted teeth and in the oral cavity of volunteers. We have also developed software for HSB enhancement. However, there are still difficulties in image processing, with the main challenges being:
- Standardization and quality control of the captured image.
- Fast and correct segmentation of the region of interest containing the HSB.
- Noise removal and HSB filtering.
- Effective biometric comparison.
The first two challenges have been addressed in previous publications. In the present article we introduce a novel approach to address the last two challenges. The aim of this article was to develop a pipeline that allows image capture, processing, storage in a database and comparison of a specific image with the database.
Methods
All experiments were performed with approval from the Research Ethics Committee of the FOP under number CAAE 03596918.2.0000.5418. Photographs of 127 anterior teeth extracted from were used to develop and test the algorithms. Of these, 115 teeth presented HSB under lateral illumination and were used. Teeth were 14 canines, 71 lower incisors and 30 upper incisors. Photographs were captured with a Canon EOS 5D mark III camera coupled to an InfiniProbe TS-160 lens (Infinity Photo-Optical Company, Boulder, Co, USA). The algorithms were developed in Python 3.9 using image-specific libraries NumPy, Scikit-Image, OpenCV, SciPy and TensorFlow. The developed algorithms follow a flowchart that is described in Figure 1.
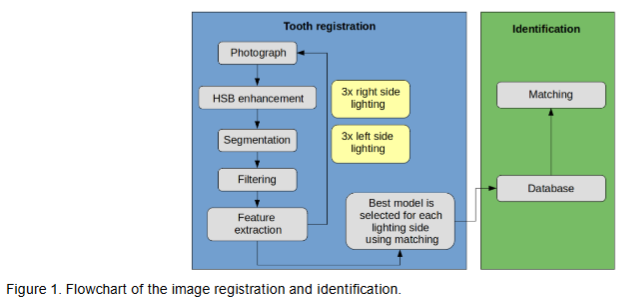
The tooth registration begins with photography, highlighting of the HSB, segmentation of the usable area of the HSB, filtering and binarization of the segmented HSB region, and extraction of the biometric characteristics. This procedure is repeated at least three times for each illuminated side of the tooth, and the best model (toothprint) for each illuminated side (left (L) and right (R)) is chosen by means of biometric comparison between each other, where the model with the highest score is chosen as a representative of the tooth to be inserted into the database. This procedure was performed at two different image acquisition times (first (1) and second (2)) with a difference of two weeks, where the position of the tooth, camera and light source were different at each time to challenge the algorithm and bring the image acquisition procedure closer to a real scenario. The toothprints were stored in separate databases, according to illumination and moment of acquisition: L1, L2, R1 and R2; and then used for the identification test.
FILTER
Filtering removes noise from the image and transforms the gray pattern previously selected in the segmentation into a binary image, that is, containing only two values: zero and one (visibly: black and white). The development of the filter algorithm adapts some techniques used in fingerprinting, such as estimation of orientation and bandpass filtering. Unlike fingerprints, the orientation of HSB presents abrupt local variations. This factor is even more impactful because the noise present in the image with highlighted HSB is much greater than that of images obtained with biometric fingerprint sensors. Thus, we developed a gradual filtering method shown in Figure 2.
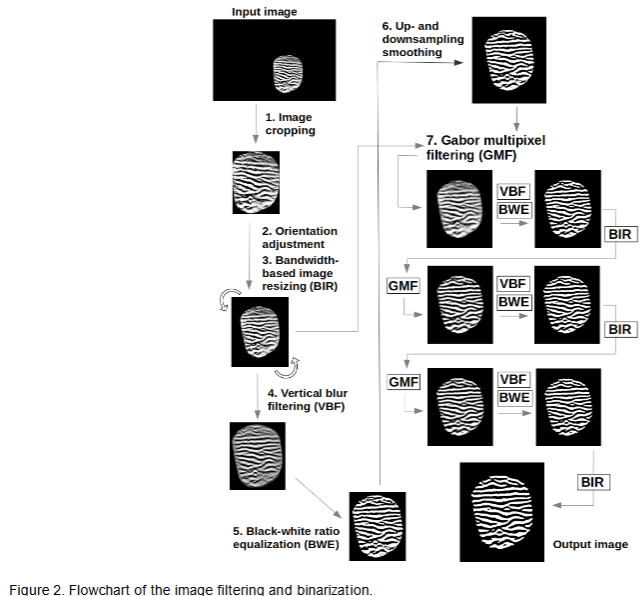
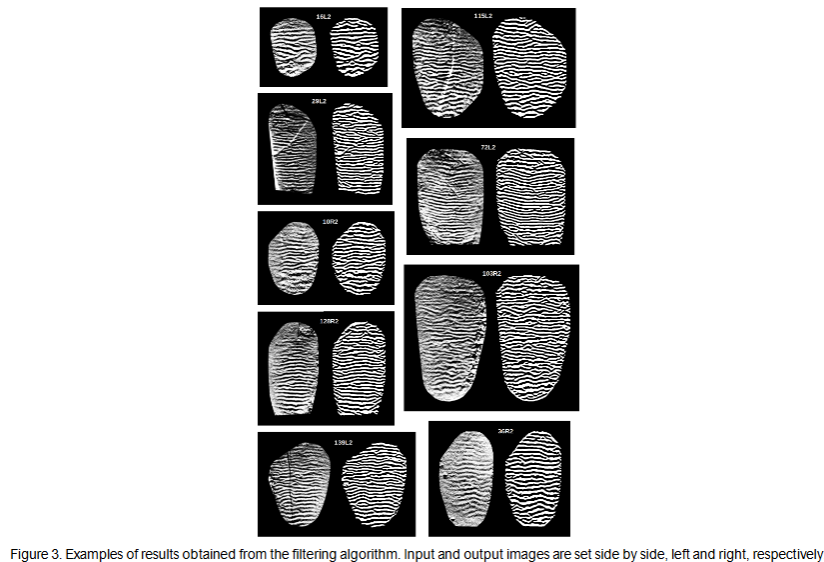
The steps used in image filtering and binarization were: 1. The image with highlighted HSB with the useful region selected has its edges removed. 2. Global orientation adjustment. 3. Resizing according to the estimate of the average frequency of the bands (adapted from Hong et al.). 4. Vertical filtering. 5. Binarization with equalization of the white/black ratio. 6. Smoothing by resizing. 7. Filtering of local pixels using Gabor filter in an iterative mode. This last step is performed gradually with three repetitions, established after visual comparisons of the HSB pattern between the input and output images, to balance both filtering quality and fidelity. Increasing repetitions improves the filtering quality at the expense of the HSB fidelity of the input image. Some examples of results obtained with the filter flowchart are presented in Figure 3.
FEATURE EXTRACTION
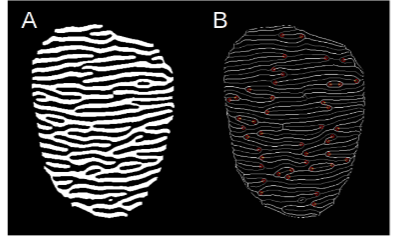
Feature extraction from filtered HSBs is quite similar to the process used in fingerprints. The main features used are terminations and bifurcations. These minutiae are identified after skeletonization of the binary image. In this process, the bands are reduced to the thickness of a single pixel, while maintaining their extension. Thus, it is possible to map regions whose number of neighboring pixels is equal to one for terminations and equal to three or more for bifurcations. As a result, many false minutiae were found. Post-processing to remove false minutiae is applied using several techniques, including adaptations of. Due to the variations in illumination of the initial photograph, there is ambiguity in determining the type of minutiae found: termination or bifurcation? An example is illustrated in Figure 5. To solve this problem, we considered only terminations, but for both light and dark bands. In this way, a larger number of minutiae can be compared.
Results
Biometric comparison uses the characteristics previously extracted to identify a tooth, which can be compared with the characteristics of one or multiple teeth in a database. Currently, with the updates of automatic fingerprint identification systems (AFIS), there is no longer compatibility for use in toothprint identification, as previously reported for the Verifinger software (Neurotechnology). Therefore, we created a specific algorithm for using toothprints, based on minutiae and texture of toothprints. After registering 115 teeth at two different times, we obtained four databases, two for right-side illumination (R) and two for left-side illumination (L). The comparison was only performed between databases with illumination on the same side. The final score for each comparison was obtained using the maximum score value between L and R (max(L,R)).
![Figure 6. ROC curve of the biometric comparisons of the 115 teeth lighted from the left (L), right (R) and considering both (max (L, R)) sides. AUC is the area under the curve, and EER is the equal error rate in [0,1].](/pdf-to-wp-converter/uploads/images/personal-identification-hunter-schreger-bands-teeth-figure-6.png)
The equal error rate (EER) threshold was approximately 0.31. To better visualize the current performance of this biometric methodology, we established a threshold of 0.5 for calculating the False Positive Rate (FPR) and the True Positive Rate (TPR). Positive identification in relation to the sample distribution revealed a FPR of 0.002 (31 of 13,225 comparisons) and a TPR of 0.877 (101 of 115 comparisons). Figure 8 shows the condition of the sample teeth in relation to biometric identification with a threshold of 0.5. Undoubtedly, healthy teeth performed better in terms of positive identification. The hypothesis is that the dental conditions of the vestibular (anterior) surface of the teeth, while group are typically located on the proximal (lateral) surfaces of the teeth, affecting a smaller HSB region, and therefore having a less impact in the identification process.
Discussion
Personal identification through the microstructure of dental enamel has its peculiarities, such as the predominantly horizontal orientation of HSB with high local variation, dependence on specific lighting, ambiguity in the characterization of details, and variability in the thickness of HSB. We have shown that it is possible to perform identification for most teeth. To this end, it was necessary to create specific methods combined with the adaptation of existing ones for image processing. Validation of the complete pipeline on teeth extracted under different conditions: intact, restored, fractured, decayed, etc.; revealed an EER rate of 0.061, a value lower than that obtained from fingerprints by some biometric sensors. Considering that the complete anterior dentition has 12 teeth (incisors and canines), the chance of personal identification increases greatly as images from those teeth can be stored in the database and used for identification.
Within the flowchart presented, we show in the article that the correct selection of the tooth region where there are useful HSBs for biometric use is a subjective task. The boundaries are poorly defined, and the selection of very large regions can add image artifacts, while the selection of small regions can exclude important features in the identification of teeth. The two techniques used for segmentation: anisotropy-based segmentation (ABS) using classical image processing, and segmentation by U-Net convolutional neural network resulted in an average overlap of 76.6% (ABS) and 83.7% (U-Net) with respect to the reference segmentation for HSB. The difficulty of this type of segmentation lies in the absence of contour of the region of interest. This also explains the relatively low results expected from a fully convolutional neural network. Variations of the techniques still open new fields for testing and can be explored even outside the context of HSBs.
In addition to segmentation errors, problems in other phases of the image acquisition process directly influence the result and tend to have a cumulative effect. Therefore, quality control is needed. Starting with the photography, variations in lighting and camera positioning in relation to the tooth can interfere with the contrast of the HSBs and cause distortion. The HSB enhancement phase was straightforward without any visible problems. Segmentation phase influences the number of details that can be identified, but it must also be limited to the HSB area with sufficient quality to be binarized reliably. The filter, unlike filters commonly used in fingerprinting, is applied gradually and regions with excessive noise can impair filtering. The extraction of biometric features is dependent on the filtered HSB, both in quality and in number of details. And finally, the biometric comparison uses the details and texture of the filtered images to generate a similarity score. Therefore, establishing quality control for these steps will be essential for the actual application of the methodology.
In addition to the advantages of using HSB as a biometric method mentioned above, the proposed anterior teeth using less than 100 kb on a hard drive. Using multiple teeth from an individual can provide results comparable to current biometric methods in use. However, we believe that several parts of the flowchart can be improved to increase efficiency for each tooth. In addition, there are inherent characteristics of teeth that have not yet been explored, such as enamel cracks, which may help reduce false positive rate.
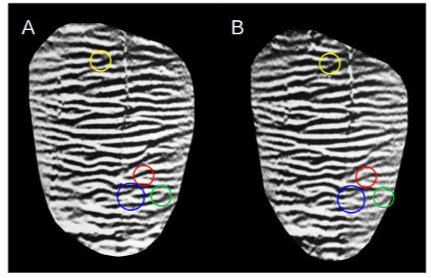
The clarity of Hunter-Schreger Bands (HSBs) may be compromised by the low contrast between their light and dark bands. Furthermore, when light strikes the enamel surface from the side, it reflects intensely, producing bright areas in digitally captured images. Another challenge arises from the sharp drop in illumination as light passes through the common vertical cracks found in enamel. Collectively, these issues restrict the area that can be clearly observed and negatively impact image quality. The software used in the present paper minimizes these problems by selecting areas where bands are clearly observed and correcting the drop in illumination produced after enamel cracks.
Conclusions
Through the joint development of several algorithms for personal identification using the microstructure of tooth enamel (i.e. Hunter-Schreger bands), in teeth extracted under different conditions, it was possible to quantify the efficiency of the proposed method. We showed that this method can identify teeth at different times through a protocol of capturing photographic images under specific conditions. The current performance using only one tooth is comparable to the most widely used biometric methods and still has great potential for improvement. In addition, identification through HSBs has advantages when applied in situations where other forensic identification methods are limited.
Conflict of Interest Statement:
None.
Funding Statement:
None.
Acknowledgements:
G.B.F. was supported by a fellowship from Sao Paulo Research Foundation (FAPESP, grant 2020/07401-4). S.R.P.L. was supported by a fellowship from The Brazilian National Council of Scientific and Technological Development (CNPq, grant 304144/2022-3).
Author Contributions.
SRPL and GBF participated in all the steps of the present article.
References:
- Perry WL, Bass WM, Riggsby WS, Sirotkin K. The auto degradation of deoxyribonucleic acid (DNA) in human rib bone and its relationship to the time interval since death. Journal of Forensic Sciences. 1988;33: 144-153.
- Weicheng S, Tieniu T. Automated biometrics-based personal identification. Proceedings of the National Academy of Sciences USA. 1999;96: 11065-11066.
- Sweet DJ, Sweet CHW. DNA analyses of dental pulp to link incinerated remains of homicide victim to crime scene. Journal of Forensic Sciences. 1995;40: 310-314.
- Valenzuela A, Martin-de las Heras S, Marques T, Exposito N, Bohoyo JM. The application of dental methods of identification to human burn victims in a mass disaster. International Journal of Legal Medicine. 2000;113(4): 236-239. https://doi.org/10.1007/s004149900099.
- Koenigswald W, Pfretzchner H. Changes in the tooth enamel of early Paleocene mammals allowing increased diet diversity. Nature. 1987;106: 150-152.
- Koenigswald W, Rose K. The enamel microstructure of the early Eocene Pantodont Coryphodon and the nature of the zigzag enamel. Journal of Mammalian Evolution. 2005;12: 419-432. https://doi.org/10.1007/s10914-005-6970-1.
- Stefen C. Enamel microstructure of recent and fossil Canidae (Carnivora: Mammalia). Journal of Vertebrate Paleontology. 1999;19: 576-587.
- Stefen C. Enamel structure of arctoid carnivora: Amphicyonidae, Ursidae, Procyonidae and Mustelidae. Journal. Mammalogy. 2001;82: 450-452.
- Line SRP, Bergqvist LP. Enamel structure of Paleocene mammals of the São José de Itaboraí Xenungulata, and Astrapotheria. Journal of Vertebrate Paleontology. 2005;25(4): 924-928.
- Ramenzoni LL, Line SRP. Automated biometrics-based personal identification of the Hunter-Schreger bands of dental enamel. Proceedings of the Royal Society B: Biological Sciences. 2006;273(1590): 1155-1158. https://doi.org/10.1098/rspb.2005.3409
- Arrieta ZL, Line SRP. Optimizing the analysis of dental enamel microstructure in intact teeth. Microscopy Research and Technique. 2017;80(7): 693-696. https://doi.org/10.1002/jemt.22852
- Arrieta ZL, Fogalli GB, and Line SRP. Digital enhancement of dental enamel microstructure images from intact teeth. Microscopy Research and Technique. 2018;81:1036-1041. https://doi.org/10.1002/jemt.23070
- Fogalli GB, Line SRP, Baum D. Segmentation of tooth enamel microstructure images using classical image processing and U-Net approaches. Frontiers Imaging. 2018;2023;2: 1215764. https://doi.org/10.1109/ICIP.2001.95810610.3389/fimag
- Hong L, Wan Y, Jain A. Fingerprint image enhancement: algorithm and performance evaluation, in IEEE Transactions on Pattern Analysis and Machine Intelligence. 1998;20: 777-789. https://doi.org/10.1109/34.709565
- Zhang TY, Suen CY. A fast parallel algorithm for thinning digital patterns. Communications of the ACM. 1984;27: 236-239. https://doi.org/10.1145/357994.358023
- Maltoni D, Maio D, Jain AK, Prabhakar, S. Handbook of fingerprint recognition. Springer London 2009. https://doi.org/10.1007/978-1-84882-254-2
- Gamassi M, Piuri V, Sana D, Scotti F. Robust fingerprint detection for access control. In Proceedings of RoboCare Workshop. May. 2005. (pp. 1-3).
- Cappelli R, Ferrara M, Maltoni D. Minutiae-based fingerprint matching. in: cross disciplinary biometric systems. Intelligent Systems Reference Library, 2012;37. Springer, Berlin, Heidelberg. https://doi.org/10.1109/ICIP.2001.958106
- Jain A, Ross A, Prabhakar S. Fingerprint matching using minutiae and texture features. Proceedings of International Conference on Image Processing, 2001;3: 282-285 https://doi.org/10.1109/ICIP.2001.958106