Perturbation Analysis in MRI Post Cerebellum Radiosurgery

Perturbation in Magnetic Resonance Images from Cerebellum Target Stereotactic Radiosurgery

Kaile Li, PhD, Corbin Helis, MD, Esmail Parsai, PhD, Jeremy Karlin, MD

* Correspondence: [email protected]

OPEN ACCESS

PUBLISHED 31 December 2024

CITATION Li, K., Helis, C., et al., 2024. Perturbation in Magnetic Resonance Images from Cerebellum Target Stereotactic Radiosurgery. Medical Research Archives, [online] 12(12). https://doi.org/10.18103/mra.v12i12.6020

DOI https://doi.org/10.18103/mra.v12i12.6020

ISSN 2375-1924

ABSTRACT

Introduction: Stereotactic Radiosurgery (SRS) is an efficacy procedure in treatment of brain disease. The complicated SRS procedure includes simulation, target definition, treatment planning, target localization and dose delivery. The external accuracy verifications of the whole procedure have been investigated with different quality assurance methodologies. However, the final estimation of SRS procedure should be reflected in the disease lesions inside the patient, and this could be done by employing different imaging modalities at different temporal points, but challenges exist in abstracting the weak signal due to radiation in the images. Therefore, in this study, a method was used to estimate the perturbation information in MRIs at different temporal points after a cerebellum target SRS.

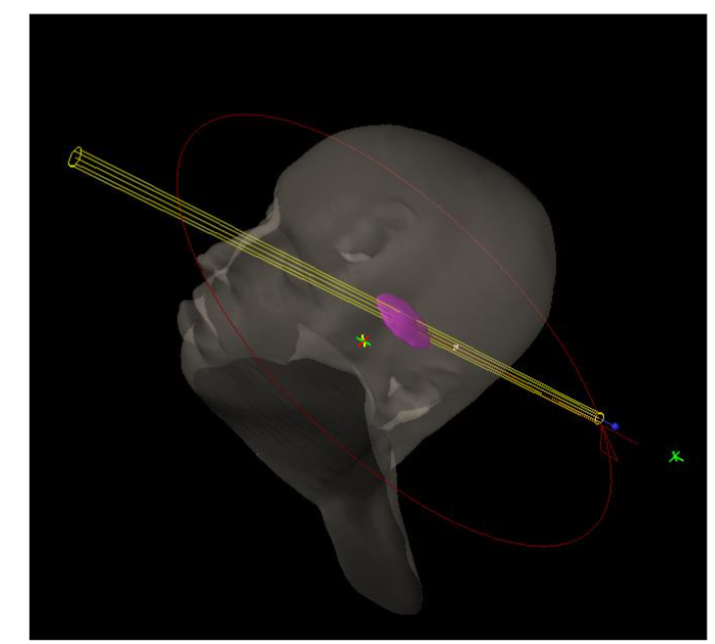
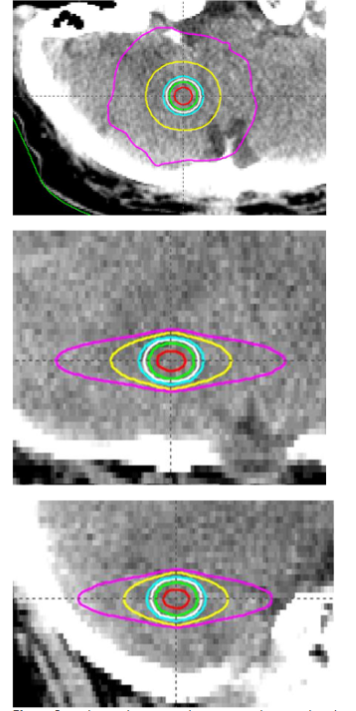
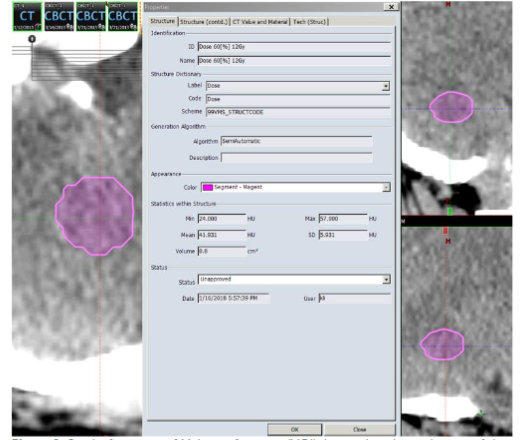
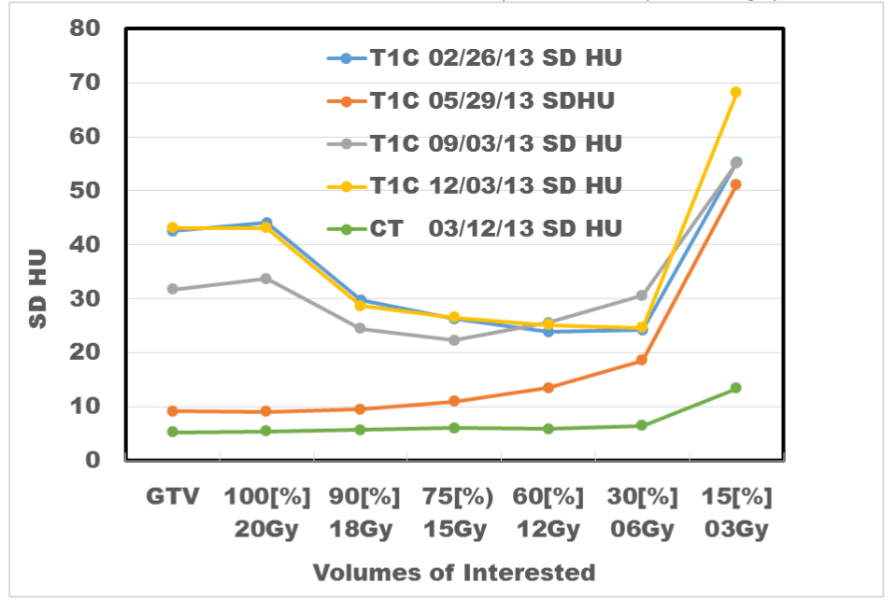
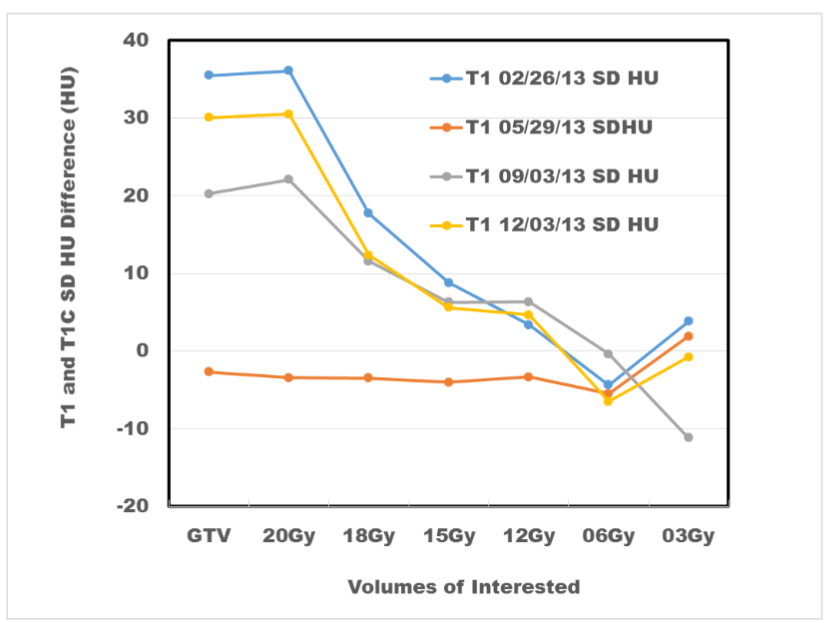
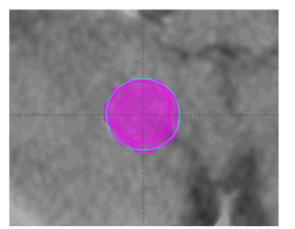
Methods and Materials: A cerebellum target was under an SRS with a single ARC small aperture cone on a Linac machine from Varian Medical system. A series of MRIs in different temporal points have been attained, the temporal range was 0 months, 3 months, 6 months, and 9 months. The volume of interested scans were defined by the isodose volume in the dosimetric plan, which included target volume, and isodose volumes which were at different isodose levels including 100%, 90%, 75%, 60%, 30% and 15% of prescription dose. Through image fusion method, these volumes of interest were defined in the MRIs through the function of copy structures to registered image. Then structure property function to attain the structure statistics including minimum Hounsfield Unit (HU), maximum HU, mean HU, and standard deviation (SD) of HU inside the volume of interest. Vectors were used to represent the separate volumes of interest and corresponding statistics in HU. A relative percentage difference method, which was defined to be the ratio between the differences of SD and mean SD divided by the mean SD to separate the technical variation from imaging procedure.

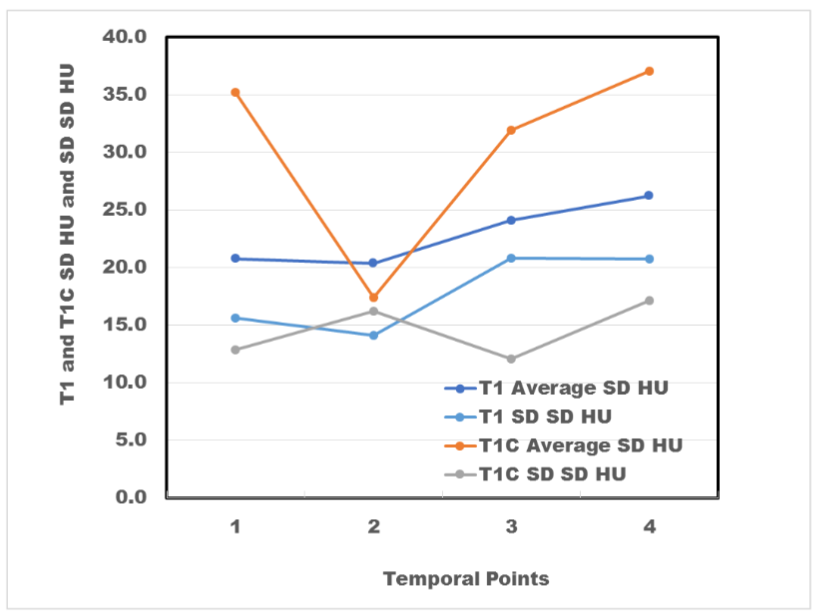
Result: For the selected volumes of interest, the mean SD HUs were 20.8, 20.4, 24.1, and 26.21 for T1 MRIs, and was 35.2, 17.4, 31.9, and 37.1 for T1 MRIs with contrast. And the least difference in SD HU vector elements was at 3 months, and the average absolute SD HUs was about three in magnitude. Moreover, the relative percentage difference showed a time-spatial vector pattern with special characteristics.

Conclusions: Some significant HU variation can be seen from T1 and T1 with contrast MRIs in temporal and volume discrete matrix. Data analysis could be further improved by eliminating the uncertainty due to technical inconsistency, and similar investigation approach could be applied to the MRIs acquired right after radiation irradiated for SRS.

Keywords: Stereotactic Radiosurgery, MRI, Brain Disease, Perturbation

Introduction

Stereotactic Radiosurgery (SRS) is an efficacy procedure in treatment of brain disease. The radiosurgery was initialed by Leksell gamma procedure, and modernized methods have been extended to linear accelerators, Cyberknife and so on. The complicated SRS procedure includes simulation, target definition, treatment planning, target localization and dose delivery. The external accuracy verification of the whole procedure has been investigated with different quality assurance methodologies. However, the final estimation of SRS procedure should be reflected in the disease lesions inside the patient, and this could be done by employing different imaging modalities at different temporal points, but challenges exist in abstracting the weak signal due to radiation in the images. The rationale of this philosophy is to mimic the physics study of a few atomic layers of surface morphology between strong Bragg Peaks. More specifically, the perturbation information could be used to estimate and predict the potential abnormal structure at the phases of pretreatment, during treatment and post treatment Therefore, in this study, a method was used to estimate the perturbation information in MRIs at different temporal points after a cerebellum target SRS, and the targeting to understand the rationale of radiosurgery in target characteristics, dosimetry accuracy, and radiation dose delivery response and improvement of radiosurgery strategy.

Methods and Materials

This radiosurgery plan was generated in an Eclipse Treatment planning system form Varian medical system. The treatment planning system simulated the x-ray beam, which was generated by a linear accelerator. The simulation included the geometric structure of linear accelerator system and with accurately calibration of dosimetry accuracy. After the dosimetry requirement was given, a dose delivery approach was developed as showed in

Single ARC Cone plan for SRS.

. Then patient was treated with high precise setup in the treatment room, and accurate dose was delivered to the intended target. Afterward, different imaging modalities could be employed to trace the treatment outcome.

Firstly, a cerebellum target was under an SRS with a single ARC small aperture cone on a Linac machine from Varian Medical system. The SRS plan is shown in

Isodose volumes shown in axial, sagittal and coronal view.
Isodose volumes shown in axial, sagittal and coronal view. Corresponding volumes were 0.04, 0.28, 0.48, 0.77, 2.67, and 10.70cc.

.

In this study, a series of MRIs in different temporal points have been attained, the temporal range were 0 months, 3 months, 6 months, and 9 months. The volume of interested scans were defined by the isodose volume in the dosimetric plan, which included target volume, and isodose volumes which were at different isodose levels including 100%, 90%, 75%, 60%, 30% and 15% of prescription dose, which is shown in

Pixel information of Volume of interest (VOI).
Pixel information of Volume of interest (VOI). It was directly application of the property function of VOI from contouring module from Eclipse Treatment Planning System from Varian Medical System.

.

Afterwards, through image fusion method, these volumes of interest were defined in the MRIs through the function of copy structures to registered image. Then structure property function to attain the structure statistics including minimum Hounsfield Unit (HU), maximum HU, mean HU, and standard deviation (SD) of HU inside the volume of interest (VOI), and this procedure is shown in

Pixel information of Volume of interest (VOI).
Pixel information of Volume of interest (VOI). It was directly application of the property function of VOI from contouring module from Eclipse Treatment Planning System from Varian Medical System.

.

Finally, a relative percentage difference method, which was defined to be the ratio between the differences of SD and mean SD divided by the mean SD to separate the technical variation from imaging procedure. The formula below shows this estimation procedure.

𝐻𝑆𝐷𝑉1
⋮
𝐻𝑆𝐷𝑉𝑁 
=
 
𝐻𝑉1
𝑃𝑖
−𝐻𝑉1
𝑁 2 𝑉
1
𝑝
𝑖=1
 𝑁𝑉1
𝑝−1 
⋮
 
𝐻𝑉𝑁
𝑃𝑖
−𝐻𝑉𝑁
𝑁 2 𝑉𝑁
𝑝
𝑖=1
 𝑁𝑉𝑁
𝑝−1 
=
 
𝑆𝐷𝐻𝑆𝐷 =
 
 𝐻𝑆𝐷𝑉𝑖
−𝐻𝑆𝐷𝑉
 
2 𝑁𝐻𝑆𝐷
𝑖=1
 𝑁𝐻𝑆𝐷−1 

Note: HSD (HU Standard Deviation in VOI V. SD (Standard Deviation. N (Number of VOIs or pixels in a VOI) P (Pixel in VOI)

Result

For the selected volumes of interest, the mean SD HUs were 20.8, 20.4, 24.1, and 26.21 for T1 MRIs, and was 35.2, 17.4, 31.9, and 37.1 for T1 MRIs with contrast. And the least difference in SD HU vector elements was at 3 months, and the average absolute SD HUs was about three in magnitude. Moreover, the relative percentage difference showed a time-spatial vector pattern with special characteristics.

Average standard deviations of HU of T1 images at different temporal points in different VOIs.
Average standard deviations of HU of T1 images at different temporal points in different VOIs and corresponding SD SD HU.

In

Standard deviations of HU of T1C and plan CT images at different temporal points in different VOIs.
Standard deviations of HU of T1C and plan CT images at different temporal points in different VOIs. It can be seen the significant offsets to the groups at image after 3 months of SRS procedure.

, the MR T1 with contract image showed a dip in the 3-month time point, and this implied that this imaging setting is sensitive to the treatment lesion response. And in

The SD HU variation at between T1 and T1 with contrast MRS was smallest at all the volumes 3 months after SRS procedures.
The SD HU variation at between T1 and T1 with contrast MRS was smallest at all the volumes 3 months after SRS procedures. It could imply that the heterogeneity disappeared.

, the observation perturbation in formula 1 for surface dose volumes at simulation CT and different MRIs were plotted. The comparison showed the obvious variation happen 15% prescription line, which is 3Gy at this treatment. While considering the actual size of the target, this plot showed the optimal sensitivity volume for analysis in this type of study. Then, as another support of this volume of interest selection,

The SD HU variation at between T1 and T1 with contrast MRS was smallest at all the volumes 3 months after SRS procedures.
The SD HU variation at between T1 and T1 with contrast MRS was smallest at all the volumes 3 months after SRS procedures. It could imply that the heterogeneity disappeared.

was another support for this range of volume of interest by plotting the T1 and T1C SDHU difference, which is the SDHU of T1 MRI subtracting that of the T1 MRI with contract.

Table 1. T1 and T1 with contrast perturbation for HU standard deviation

Imagemodality T1 2/26/13 T1C
NO. ROI name Volume (cc) SD HU % /average var HU relative SD HU % /average var HU relative T1/T1c SD difference
1 GTV 0.02 7.0603 34% -66% 42.557 121% 21% 35.4967
2 Dose 100[%] 20Gy 0.02 8.099 39% -61% 44.175 126% 26% 36.076
3 Dose 90[%] 18Gy 0.11 12.029 58% -42% 29.772 85% -15% 17.743
4 Dose 75[%)15Gy 0.2 17.446 84% -16% 26.269 75% -25% 8.823
5 Dose 60[%] 12Gy 0.31 20.626 99% -1% 23.991 68% -32% 3.365
6 Dose 30[%] 06Gy 1.75 28.631 138% 38% 24.282 69% -31% -4.349
7 Dose 15[%]03Gy 7.83 51.469 248% 148% 55.281 157% 57% 3.812
average 20.77 35.19

Conclusion

In this study, the perturbation philosophy was employed to analyze a temporal series of the MRIs and showed the variation of these perturbation information in response regarding to different volumes of interest in the brain lesion at different dosimetry regions. And the sensitivity of these information was also displayed in different data domains of temporal points. In conclusion, a new outcome analysis tactic was proved to be an effective method for tracing the different abnormal lesions under radiosurgery.

Discussion

As an initial study, some significant HU variation can be seen from T1 and T1 with contrast MRIs in temporal and volume discrete matrix. For better understanding, data analysis could be further improved by eliminating the uncertainty due to technical inconsistency, for example,

Volume variations after directly applying the 'copy structure to registered image' function to different temporal point images.
Volume variations after directly applying the ‘copy structure to registered image’ function to different temporal point images.

shows the variations when directly applying the “copy structures to registered image” function, which could be affected by scanning slice thickness, clinician’s judgement on registration, and so on. Moreover, similar investigation approach could be applied to the MRIs acquired right after radiation irradiated for SRS. Final, the philosophy of this analysis method could be expanded to different imaging scenarios for objects in different physical scales and kinetic response of radiation medicine.

References:

  1. Leksell L. The stereotaxic method and radiosurgery of the brain. Acta Chir Scand 1951; 102: 316–19
  2. W. Lutz, et al, “A system of stereotactic radiosurgery with a linear accelerator”, In. J. radiat. Oncol. Biol.Phys. 14, 373, 1988
  3. John J. Kresl, Lech Papiez, R.D. Timmerman, James D. Luketich, “Robotic Radiosurgery. Treating Tumors that Move with Respiration”, Springer, 2007
  4. Kaile Li, et al, “Aperture Effect for Linac-based SRS in Small Target Treatment”, Journal of Radiosurgery and SBRT, vol.4, p21-29, 2016
  5. Kaile Li, et al, “Dosimetric Evaluation for Small Target in Linac based Stereotactic Radiosurgery (SRS): Developing a Risk Management Methodology using Perturbation of Localization Technique”, SANTRO, Hangzhou, China, 2010
  6. Kaile Li, et al, “Perturbation Analysis of Relationship of Conebeam CT and Stereoscopic Optical Localization System in Frameless Stereotactic Radiosurgery”, ASTRO annual meeting, USA, 2010
  7. Kaile Li, et al, “Perturbation of Localization Technique in Dosimetric Evaluation for Small Target in Linac based Stereotactic Radiosurgery (SRS)”, ISRS congress, 2011.
  8. Kaile Li, et al, “Improvement of Conformity for Small Target Linac Based Stereotactic Radiosurgery (SRS) By Embedding Machine Geometric Perturbation”, ISRS Congress, 2011
  9. Kaile Li, et al, “Comparison of Cone and MLC Linac Based Arc Stereotactic Radiosurgery for Small Target with Different Apertures”, ISRS Congress, 2013
  10. Kaile Li, et al, “Strategy of Modality Selection in Linac Based SRS For Multiple Brain Metastatic TARGETS”, ISRS Congress, 2015
  11. Kaile Li, et al,” Lucy Phantom Estimation of Geometric Variation for Linac-based Brain Stereotactic Radiosurgery”, ISRS Congress, 2017
  12. Kaile Li, et al, “Relationship Between Conformity Indices and Treatment Characteristics in Cone Based Linac Stereotactic Radiosurgery”, AAPM annual meeting, 2015.
  13. Kaile Li, et al, “Dosimetric Characteristics of Single Arc Cone and MLC Linac based SRS”, RSS annual meeting, USA, 2017
  14. Kaile Li, “Defects at Surface and Interface of Crystals: Theoretical and X-ray Scattering Analysis”, PhD Dissertation, USA 2002
Interested in publishing your own research?
ESMED members can publish their research for free in our peer-reviewed journal.
Learn About Membership

Call for papers

Have a manuscript to publish in the society's journal?