


Prevalence of Vision Impairment in Mexico: 1990-2019
Prevalence and Disability of vision impairment in Mexico: Evidence not seen or spoken about
Aida Jiménez-Corona, MSc, PhD¹, Enrique O. Graue-Hernández, MD, MSc², María Jesús Ríos-Blancas, MSc, PhD³, Héctor Gómez-Dantés, MD, MSc⁴
- Department of Ocular Epidemiology and Visual Health, Institute of Ophthalmology, Conde de Valenciana, Mexico City, Mexico; General Directorate of Epidemiology, Ministry of Health, Mexico
- Department of Cornea and Refraction, Institute of Ophthalmology, Conde de Valenciana, Mexico City, Mexico.
- Carlos Slim Foundation
- Health Systems Research Center, National Institute of Public Health, Cuernavaca Morelos, Mexico.
OPEN ACCESS
PUBLISHED: 31 July 2024
CITATION: Jiménez-Corona, A., Graue-Hernández, E.O., et al. 2024. Prevalence and Disability of vision impairment in Mexico: Evidence not seen or spoken about. Medical Research Archives, [online] 12(7).
https://doi.org/10.18103/mra.v12i7.5432
COPYRIGHT: © 2024 European Society of Medicine. This is an open-access article distributed under the terms of the Creative Commons Attribution License, which permits unrestricted use, distribution, and reproduction in any medium, provided the original author and source are credited.
DOI https://doi.org/10.18103/mra.v12i7.5432
ISSN 2375-1924
Abstract
According to the World Health Organisation, in 2015 about 253 million people, mainly from low- and middle-income countries, had vision impairment. Aim. We set out to provide an updated overview of the burden of visual impairment in Mexico to guide public health policy towards its prevention and control. Methods. Using data from the Global Burden of Disease study, we describe the age-standardised disability and prevalence rates (per 100,000 population) of total, severity, and cause-specific visual impairment and blindness with 95% uncertainty intervals (UIs) in Mexico from 1990 to 2019. Results. During the study period, age-standardised prevalence of blindness and vision loss showed a national decrease of -7.0% from 10115.3 (95% UI 8540.6-11947.8) to 9410.2 (95% UI 7895.6-11230.4.1) cases per 100,000 population but it was not significant. Blindness prevalence showed a significant national decrease of -40.0% from 742.2 (95% UI 653.7-828.8) to 445.6 (95% UI 391.5-495.0) cases per 100,000 population. Decreasing trends in vision disability rates were not significant but changes were observable for blindness (-39.6%). Although a remarkable decline on disability rates due to glaucoma (-33.1%), cataract (-27.5%), and macular degeneration (-20.4%) was observed, neither was it significant. Conclusions. The trends in prevalence of vision impairment and disability did not change significantly during the study period. Presbyopia and moderate vision loss accounted for most of the disability in all age groups. Inequalities between the poorest and richest states remained unchanged.
Keywords
Burden of disease, blindness, vision impairment, YLDs
Introduction
Vision impairment is a global health concern that keeps growing in a context of aging population in both developing and developed countries. This impairment entails risks and costs derived from health care demands and social support required by vulnerable populations. Vision disability has lasting effects over the cognitive, psychosocial, and functional health, and increases the risk of mortality. Vision impairment and blindness may occur early in life but are more common in elderly population and are associated with chronic disabling conditions, such as non-communicable diseases like diabetes and hypertension.
Global burden of vision impairment
In 2015, the World Health Organisation (WHO) reported that globally about 216.6 million people suffered from moderate or severe vision impairment, and the absolute number of blind people increased from 30.6 million to 36 million (18%) during the years 1990‒2015. Of these people, 90% lived in developing countries. Conditions such as cataract and uncorrected refractive error combined contributed to 77% of vision impairment and 55% of blindness in adults ages 50 years and over. Projections for 2020 estimated that out of 237.1 million people with moderate or severe vision impairment, 127.7 million (54%) would be affected by uncorrected refractive errors, with cataracts accounting for 57.1 million (24%) cases, followed by age-related macular degeneration (8.8 million, 4%), glaucoma (4.5 million, 2%), and diabetic retinopathy (3.2 million 1%). Among the 38.5 million blind people projected for 2020, cataract would be responsible for 13.4 million cases (35%), uncorrected refractive error for 8.0 million (20%), and glaucoma for 3.2 million (8%). About 56% of these cases would be women, and changes would be attributable to population growth (38.4%), population aging (34.6%), and age-specific prevalence.
Recently, prevalence of visual impairment and disability by age, sex, and causes in Mexico was reported, but trends across time were not estimated. The burden of blindness and vision impairment was estimated at 11.01 million (95% UI, 9.25–13.11) prevalent cases and 384.96 thousand (259.57–544.24) years lived with disability (YLDs) during 2019.
Aim and scope
Mexico needs to acknowledge the magnitude of the disability caused by visual impairment to implement, organise, and improve specific programmes across the country focused on early vision loss detection, treatment, and rehabilitation. The objective of this study is to provide an overview of the burden and trends of visual impairment to guide and support Mexican public health policy towards the prevention and control of this disability in the mid-term in accordance with the global targets recommended by the WHO by 2030.
Methods
The Global Burden of Disease (GBD) 2019 study methods to assess visual impairment are described on detail elsewhere. For this analysis we analysed data from the GBD study available for the 1990 to 2019 period. Briefly, visual impairment is defined as visual acuity <6/18 according to the Snellen chart. Categorisation is as follows: presbyopia (near visual acuity of <6/12 distance equivalent), moderate vision loss (≥6/16 and <6/18), severe vision loss (≥3/60 and <6/60), and blindness (visual acuity of <3/60 or <10% visual field around central fixation). Vision impairment causes fall into the following categories: uncorrected refractive error (presbyopia, myopia, hyperopia, or astigmatism), cataract, glaucoma, macular degeneration, diabetic retinopathy, and trachoma. Vision loss due to vitamin A deficiency, retinopathy of prematurity, meningitis, encephalitis, and onchocerciasis fall under their underlying cause.
Years lived with disability (YLD) for a particular health outcome in each population are calculated by multiplying the number of people living with that outcome by a disability weight representing the magnitude of health loss associated with the outcome. Disability weights are used to measure the health status after disease or injury on a scale ranging from 0 (full health) to 1 (death). For vision loss, disability weights go from 0.011 (near vision loss) to 0.187 (blindness). Details on disability weights for the GBD 2019 study −including data collection and disability weight construction− have been described previously.
Data sources used to quantify non-fatal outcomes are detailed elsewhere. Data from reports on near-vision and visual acuity measurements were extracted from nationally representative studies such as the United States National Health and Examination Surveys (NHANES), the World Health Surveys (WHS), the Health Survey for England (HSE), WHO Studies on Global AGEing and Adult Health (SAGE), the Surveys of Health, Ageing, and Retirement in Europe (SHARE); and the WHO Multi-Country Survey Study on Health and Responsiveness (MCSS). Data on overall vision impairment came from surveys measuring ‘presenting’ or ‘best-corrected’ vision in representative population-based studies. A subset of these studies reporting vision loss by cause were used to assess the prevalence of vision loss due to cataract, glaucoma, macular degeneration, diabetic retinopathy, among other causes. For the GBD 2017 and 2019, a comprehensive extraction of the repository of Rapid Assessment of Avoidable Blindness (RAAB) studies reporting vision loss in developing countries was done. Finally, for the GBD 2019, additional literature sources were provided by the Vision Loss Expert Group. Globally, the GBD used 481 data input sources to assess the burden of blindness and vision loss. Five sources were from Mexico and included four research papers from Chiapas, Nuevo León, Queretaro, one National Elementary School Health Survey (2008), specific studies, and country specific surveys. Other sources were the Mexico City Survey on Health, Well-Being, and Aging in Latin America and the Caribbean (1999-2000); Mexico’s Family Life Survey (2002, 2005-2006), World Health Survey 2002-2003, Health and Aging Studies (2001, 2012, 2015), WHO Study on Global AGEing and Adult Health (2009-2010), Demographic Dynamic Surveys (2014, 2018), and Multiple Indicator Cluster Survey (2015). All sources are available on the Global Health Data Exchange (IHME) website at http://ghdx.healthdata.org/.
For this report, we compared the trends of age-standardised prevalence rates of vision loss and disability (YLDs) with their uncertainty interval (UI) from 1990 to 2019 between the world´s regions. We further made those comparisons within Mexico at the national and state levels.
Results
GLOBAL PREVALENCE AND DISABILITY FROM VISION LOSS
Global prevalence of vision loss and disability (YLD) age-standardised rates showed variable but not significant decreasing trends from 1990 to 2019. Vision loss prevalence was significantly higher in the South Asian (20587.5 in 1990 and 18337.0 in 2019 per 100,000 population) and Sub-Saharan (15016.5 in 1990 and 14297.3 in 2019 per 100,000 population) regions as compared with the rest of the world’s regions. Disability rates (YLDs per 100,000 population) also exhibited significant differences in the South Asian (796.2 in 1990 and 602.0 in 2019 per 100,000 population) and Sub-Saharan (547.0 in 1990 and 462.6 in 2019 per 100,000 population) regions as compared with some other of the world’s regions. The region of high–income countries showed the lowest prevalence (2871.1 in 1990 and 2779.3 in 2019 per 100,000 population) and YLD (139.5 in 1990 and 128.6 in 2019 per 100,000 population) rates for vision loss.
| 1990 | 2019 | % Change | ||||||
|---|---|---|---|---|---|---|---|---|
| Prevalence rate | Global | 9871.3 | 8271.7 | 11602.3 | 10034.6 | 8379.1 | 11825.6 | 1.7 |
| South Asia | 20587.5 | 17347.5 | 23892.0 | 18337.0 | 15282.0 | 21535.8 | -10.9 | |
| Sub-Saharan Africa | 15016.5 | 12358.3 | 17821.6 | 14297.3 | 11771.0 | 16953.7 | -5.8 | |
| Southeast Asia, East Asia, and Oceania | 11002.1 | 8989.3 | 13315.7 | 10594.9 | 8710.0 | 12783.6 | -3.7 | |
| North Africa and Middle East | 9514.7 | 8335.7 | 10869.5 | 8211.4 | 7194.7 | 9380.5 | -13.7 | |
| Central Europe, Eastern Europe, and Central Asia | 10195.9 | 8343.2 | 12375.8 | 10208.2 | 8320.9 | 12435.1 | 0.1 | |
| Mexico | 10115.3 | 8540.6 | 11947.8 | 9410.2 | 7895.6 | 11230.4 | -7.0 | |
| Latin America and the Caribbean | 9928.7 | 8515.4 | 11546.6 | 9229.4 | 7868.4 | 10795.1 | -7.0 | |
| High-income countries | 2871.1 | 2600.5 | 3154.1 | 2779.3 | 2510.3 | 3059.7 | -3.2 |
(YLD rate)
| 1990 | 2019 | % Change | |||||
|---|---|---|---|---|---|---|---|
| Global | 359.4 | 247.6 | 500.6 | 328.0 | 222.5 | 465.6 | -8.8 |
| South Asia | 796.2 | 552.4 | 1101.7 | 602.0 | 411.0 | 850.3 | -24.4 |
| Sub-Saharan Africa | 547.0 | 379.4 | 759.7 | 462.6 | 317.1 | 649.4 | -15.4 |
| Southeast Asia, East Asia, and Oceania | 375.9 | 257.7 | 528.7 | 324.5 | 219.1 | 464.2 | -13.7 |
| North Africa and Middle East | 491.2 | 342.6 | 669.9 | 371.6 | 257.7 | 515.2 | -24.4 |
| Central Europe, Eastern Europe, and Central Asia | 269.5 | 180.4 | 390.7 | 251.9 | 165.7 | 375.6 | -6.6 |
| Mexico | 405.9 | 282.6 | 564.4 | 328.9 | 222.4 | 463.9 | -19.0 |
| Latin America and the Caribbean | 414.6 | 288.1 | 573.9 | 346.2 | 237.0 | 483.0 | -16.5 |
| High-income countries | 139.5 | 95.9 | 194.1 | 128.6 | 87.7 | 180.0 | -7.8 |
PREVALENCE AND DISABILITY FROM VISION LOSS IN MEXICO
In Mexico, vision loss prevalence decreased -7.0% at the national level from 10115.3 (95% UI 8540.6-11947.8) to 9410.2 (95% UI 7895.6-11230.4) cases per 100,000 population but it was not significant, whereas prevalence of blindness significantly decreased by -40% from 742.2 (95% UI 653.7-828.8) to 445.6 (95% UI 391.5-495.0) cases per 100,000 population during the same period. Decreasing trends in YLDs were not significant but changes were observable for vision loss (-19.0%) and blindness (-39.6%). In terms of YLDs from causes of vision loss, the largest decreases corresponded to glaucoma (-33.1%), cataract (-27.5%), age-related macular degeneration (-20.4%), and refractive disorders (-14.4%), although changes from 1990 to 2019 were not significant.
| 1990 | 2019 | % Change | ||||||
|---|---|---|---|---|---|---|---|---|
| Presbyopia | 5328.6 | 3849.1 | 7115.0 | 5252.6 | 3768.3 | 7011.0 | -1.4 | |
| Moderate vision loss | 3417.1 | 3041.3 | 3791.4 | 3176.1 | 2824.5 | 3514.6 | -7.1 | |
| Severe vision loss | 627.4 | 544.9 | 732.3 | 535.9 | 465.9 | 622.6 | -14.6 | |
| Blindness | 742.2 | 653.7 | 828.8 | 445.6 | 391.5 | 495.0 | -40.0* | |
| Blindness and vision loss | 10115.3 | 8540.6 | 11947.8 | 9410.2 | 7895.6 | 11230.4 | -7.0 | |
| Vision impairment (YLD rate) | Presbyopia | 55.8 | 25.4 | 110.7 | 55.0 | 25.3 | 109.8 | -1.3 |
| Moderate vision loss | 104.0 | 62.3 | 164.4 | 96.8 | 58.0 | 153.0 | -6.9 | |
| Severe vision loss | 111.9 | 74.7 | 163.9 | 96.0 | 64.3 | 139.9 | -14.2 | |
| Blindness | 134.3 | 89.8 | 190.5 | 81.1 | 54.3 | 115.1 | -39.6 | |
| Blindness and vision loss | 405.9 | 282.6 | 564.4 | 328.9 | 222.4 | 463.9 | -19.0 | |
| Causes of vision impairment (YLD rate) | Near vision | 55.8 | 25.4 | 110.7 | 55.0 | 25.3 | 109.8 | -1.3 |
| Refraction disorders | 113.9 | 76.6 | 161.3 | 97.5 | 65.5 | 138.6 | -14.4 | |
| Glaucoma | 18.3 | 12.1 | 26.0 | 12.2 | 8.2 | 17.2 | -33.1 | |
| Cataract | 105.9 | 73.1 | 147.4 | 76.8 | 53.2 | 107.4 | -27.5 | |
| Age-related macular degeneration | 6.6 | 4.3 | 9.8 | 5.2 | 3.5 | 7.7 | -20.4 | |
| Vitamin A deficiency | 6.4 | 4.0 | 9.7 | 6.0 | 3.8 | 9.1 | -5.0 | |
| Diabetes mellitus | 21.5 | 13.9 | 30.9 | 18.6 | 12.1 | 26.5 | -13.6 |
Source: Global Burden of Disease Collaborative Network. Global Burden of Disease Study 2019 (GBD 2019) results. Seattle, United States: Institute for Health Metrics and Evaluation (IHME), 2020. Available from https://vizhub.healthdata.org/gbd-results/. Rate per 100,000 population. *Statistically significative.
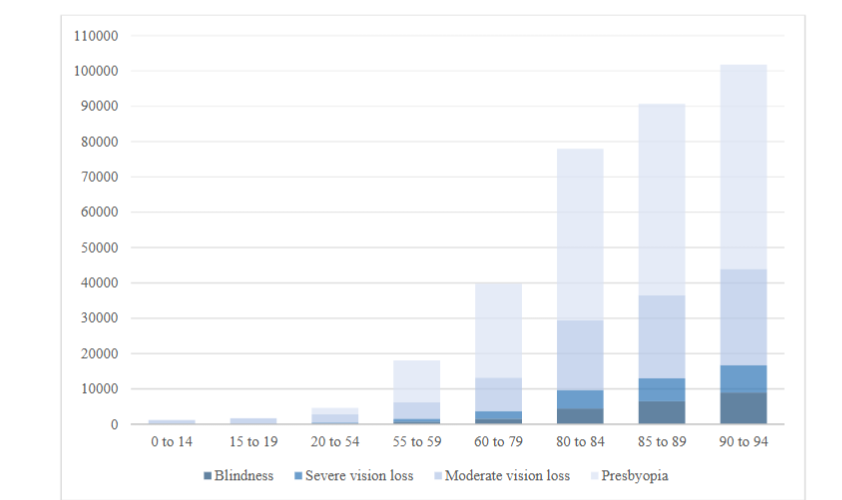
Presbyopia and moderate vision loss accounted for most of the disability across all age groups in the country.
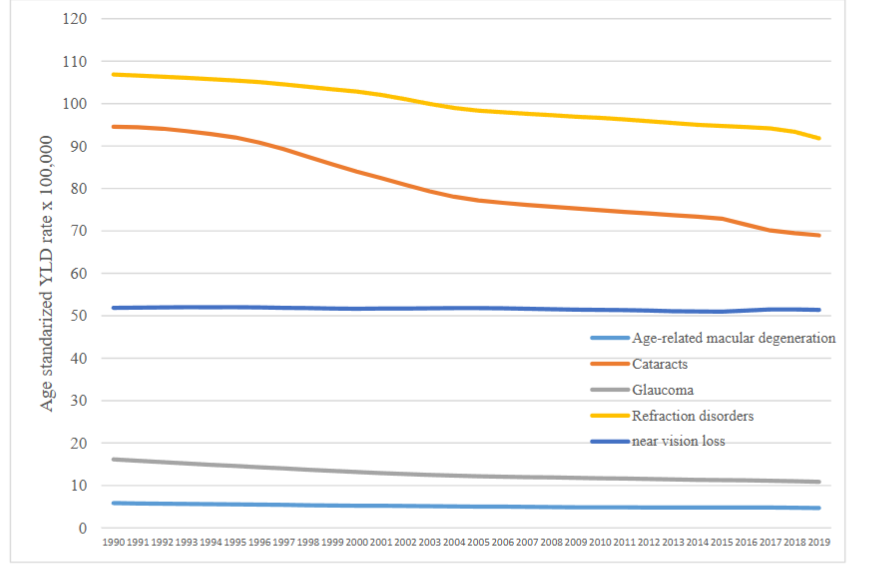
In Mexico, the prevalence of disability caused by vision impairment has kept a steady trend from 1990 through 2019, with no significant changes in age-standardised YLD rates for near vision loss, age-related macular degeneration, and glaucoma. On the other hand, highly treatable disorders such as cataract and refraction disorders showed a declining trend during the period, although changes were not significant.
Prevalence and trends for blindness and vision loss showed no significant differences or changes between the country’s states or within each state. The highest prevalence rates per 100,000 population were found in Hidalgo (from 11235.2 to 10398.2), followed by Michoacan (from 11184.7 to 10427.4) and Tlaxcala (from 10989.8 to 10265.5), and the lowest prevalence rates were found in Nuevo Leon (from 9599.7 to 9108.4), Queretaro (from 9526.2 to 8851.1), Aguascalientes (from 9497.8 to 8857.3), and Baja California (from 9492.8 to 8878.6). The vision disability trend has been steady from 1990 to 2019 with similar changes in age-standardised YLD rates per 100,000 population among states. The states of Michoacan, Yucatan and Sonora presented higher rates and a similar decreasing trend for blindness and vision loss during the study period, but the differences were not significant.
Overall, disability due to visual impairment from uncorrected refractive error decreased. Likewise, uncorrected presbyopia presented a -1% decline during the period, whereas refraction and accommodation disorders decreased (-3.4%) from 106.9 (95% UI 73,3-148.5) YLD to 103.2 (95%UI 69- 144.9) per 100,000 population. On the contrary, refraction disorders showed little or no improvement at all, with minor differences between states. The national age-standardised YLD rate for cataract showed a decreasing trend (-31.1%) from 94.5 in 1990 to 65.1 in 2019, but the difference was not significant. Michoacan presented the highest decline (-39%) in YLD rate from 110.1 (95%UI 67.8-127.9) in 1990 to 66.5 (95% UI 47.3-91.0) per 100,000 population in 2019, but the decline was not significant. Glaucoma also showed a declining trend (-38.9%) but no significant changes were observed between states during the study period. As for age-related macular degeneration, a steady trend was observed during the period.
Prevalence of vitamin A deficiency decreased (-60.3%) from 18,098.5 to 7,181.8 per 100,000 population with the poorest states (Chiapas, Oaxaca, and Guerrero) exhibiting the highest prevalence as compared with the most developed states (Nuevo Leon and Mexico City). Differences between states were significant, as well as the changes during the period.
Discussion
Prevalence estimates show that one in five individuals from Latin America Countries (LAC) had some degree of vision loss in 2015, and the absolute number of people with vision loss increased by 12% from 2015 to 2019. Regional patterns are also clear when comparing the prevalence rate of vision loss in 2016 in high-income North America (United States and Canada), which was 6,298 cases per 100,000 population vs. the prevalence rate in Tropical Latin America (Brazil, Colombia, Venezuela), which was 17,241 cases per 100,000 population.
As for Mexico, this is the first report addressing the burden of vision impairment at the national and subnational levels spanning almost three decades (1990-2019). Our report shows that the trends in prevalence and disability due to this non-lethal impairment has not changed significantly during the study period. Near vision and moderate vision loss accounted for most of the disability in all age groups, and inequalities between the poorer and richest states have remained unchanged. The age-standardised YLD rates trends for cataract, glaucoma, and age-related macular degeneration had minor but non-significant changes. Blindness associated with onchocerciasis in Mexico occurred in the poorest states of Chiapas and Oaxaca and decreased by 87.8% in the 2006-2012 period, with the country having a certification of being free of transmission in 2015. Likewise, trachoma significantly decreased at the national level (-44%) until elimination was certified by WHO in 2017.
The studies conducted so far in Mexico provide a partial overview of the burden of visual impairment in specific age groups, populations, or regions, but fail to provide a comprehensive view of the magnitude and trends of this disability by state, all age groups, and causes. The GBD-2019 study is a unique tool that provides standardised data on disability, prevalence, and causes of visual impairment from 1990 to 2019 for all age groups and for both sexes at the state level using and modelling all available data in the country. Findings reported in this study highlight the need to boost and improve prevention, early detection, and treatment programmes to deal with this impairment, especially considering the population’s fast-aging process.
Regarding vision and eye health efforts, Mexico has a long tradition of Extramural Surgery campaigns to treat cataract, strabismus, and pterygium; yet only about 28% of the 360,000 surgeries required to treat cataract are performed annually. The improved detection and treatment of other causes of blindness requires the deployment of specialised care (surgery) and cost-effective technologies. Cataract, strabismus, and glaucoma surgery were covered by the social protection programme “Seguro Popular” but did not reach all vulnerable populations (elderly and poor people). From 2011 to 2014 a total of 1.2 million eyeglasses were distributed in public primary schools across Mexico, but the campaign did not reach all the schools in the country. In addition, refractive error correction requires robust follow-up screening programmes particularly in the young and elderly population in order not to lose the effect of correction. Such programmes are essentially non-existent.
The certification of the recent elimination of onchocerciasis and trachoma in Mexico −the main infectious causes of blindness in the country− showed that long-term initiatives can produce significant results when effective coverage of target populations is accomplished under well-planned and organised programs. Vision impairment must be addressed as an important health problem, while recognising the insufficient strategies designed to prevent and treat it. It affects both sexes at all ages, in all regions and across all populations. Its control should be conceived as an attainable goal since medical treatments and technologies exist to lessen its impact. Most of the available measures are cost-effective, but outdated health policies and regulations may be limiting access to these therapies. Strategies deployed in 2017 by the National Council for the Prevention and Treatment of Visual Diseases (CNPTEV) included the creation of the National Registry for Visual Diseases, the improvement of the Cornea Transplant Registry, the implementation of Rapid Assessment of Avoidable Blindness (RAAB) surveys, the screening of refraction errors in children and cataract in elderly population, the detection and treatment of diabetic retinopathy, the screening and treatment of premature retinopathy, and the increase of human resources in ophthalmology and optometry to be distributed across the country. However, not all of these strategies have been implemented efficiently or have reached all the population.
Conclusions
The panorama of vision loss in Mexico −as in other countries and regions of the world− portraits a reality that calls for new focused strategies and regulations in public health policy, since most of the burden entailed by this impairment is avoidable, preventable, treatable, or even reversible. By acknowledging this ‘invisible and silent disability’, the country can rank vision loss among public health care top priorities to deal with its occurrence and reduce its burden.
Conflicts of Interest Statement
None of the authors have any proprietary interests or conflicts of interest related to this submission. This manuscript has not been published anywhere previously and it is not simultaneously being considered for publication in any other journal.
Funding
This research did not receive any funding or grant.
Acknowledgments
None.
Supplementary Table 1. Age-standardised prevalence rates for blindness and vision loss by state, Mexico 1990-2019
| State | 1990 Rate | 1990 95%UI Lower | 1990 95%UI Higher | 2019 Rate | 2019 95%UI Lower | 2019 95%UI Higher | % change |
|---|---|---|---|---|---|---|---|
| Aguascalientes | 9497.8 | 7984.3 | 11296.8 | 8857.3 | 7341.1 | 10614.4 | -6.7 |
| Baja California | 9492.8 | 7975.4 | 11307.4 | 8878.6 | 7442.9 | 10578.2 | -6.5 |
| Baja California Sur | 9758.1 | 8227.8 | 11490.5 | 9144.5 | 7669.2 | 10938.8 | -6.3 |
| Campeche | 9871.3 | 8302.7 | 11664.1 | 9157.0 | 7643.5 | 10838.7 | -7.2 |
| Chiapas | 10285.7 | 8579.7 | 12243.9 | 9516.5 | 7852.7 | 11609.3 | -7.5 |
| Chihuahua | 10119.5 | 8556.8 | 11835.3 | 9570.3 | 8050.0 | 11286.2 | -5.4 |
| Coahuila | 10078.0 | 8479.9 | 12053.2 | 9432.0 | 7895.4 | 11400.1 | -6.4 |
| Colima | 9751.4 | 8143.2 | 11629.3 | 9052.5 | 7522.2 | 10899.3 | -7.2 |
| Durango | 10479.5 | 8831.9 | 12417.7 | 9701.4 | 8130.6 | 11596.4 | -7.4 |
| Guanajuato | 10252.3 | 8670.9 | 12141.2 | 9541.8 | 8038.0 | 11342.8 | -6.9 |
| Guerrero | 10477.8 | 8850.4 | 12516.7 | 9688.9 | 8050.5 | 11764.1 | -7.5 |
| Hidalgo | 11235.2 | 9610.1 | 13043.4 | 10398.2 | 8857.0 | 12255.6 | -7.4 |
| Jalisco | 9793.7 | 8201.0 | 11631.8 | 9096.5 | 7550.6 | 10959.2 | -7.1 |
| State of Mexico | 9739.9 | 8159.8 | 11487.2 | 9101.1 | 7626.7 | 10915.3 | -6.6 |
| National | 10115.3 | 8540.6 | 11947.8 | 9410.2 | 7895.6 | 11230.4 | -7.0 |
| Mexico City | 10321.1 | 8842.5 | 12021.1 | 9780.3 | 8309.3 | 11547.2 | -5.2 |
| Michoacan | 11184.7 | 9510.7 | 13038.0 | 10427.4 | 8827.3 | 12314.9 | -6.8 |
| Morelos | 10305.8 | 8742.6 | 12169.7 | 9713.2 | 8163.2 | 11516.1 | -5.7 |
| Nayarit | 10153.4 | 8572.0 | 12017.6 | 9380.7 | 7842.4 | 11327.1 | -7.6 |
| Nuevo Leon | 9599.7 | 8125.3 | 11446.8 | 9108.4 | 7605.2 | 10840.0 | -5.1 |
| Oaxaca | 10028.0 | 8359.2 | 12032.7 | 9290.5 | 7718.7 | 11248.9 | -7.4 |
| Puebla | 10027.8 | 8509.0 | 11900.3 | 9370.8 | 7811.3 | 11227.0 | -6.6 |
| Queretaro | 9526.2 | 7993.2 | 11313.6 | 8851.1 | 7315.8 | 10638.6 | -7.1 |
| Quintana Roo | 10103.5 | 8527.1 | 11873.7 | 9409.1 | 7952.0 | 11246.4 | -6.9 |
| San Luis Potosi | 10347.4 | 8680.4 | 12255.0 | 9524.9 | 7940.4 | 11378.5 | -7.9 |
| Sinaloa | 9954.9 | 8436.4 | 11829.6 | 9241.9 | 7736.0 | 10998.8 | -7.2 |
| Sonora | 10100.0 | 8615.0 | 11782.0 | 9472.3 | 8041.4 | 11183.9 | -6.2 |
| Tabasco | 10188.0 | 8520.7 | 12163.3 | 9385.0 | 7780.3 | 11263.0 | -7.9 |
| Tamaulipas | 9636.5 | 8061.4 | 11377.0 | 9037.3 | 7546.3 | 10759.8 | -6.2 |
| Tlaxcala | 10989.8 | 9464.6 | 12843.1 | 10265.5 | 8763.1 | 11951.6 | -6.6 |
| Veracruz | 10141.4 | 8528.2 | 12054.6 | 9436.9 | 7790.9 | 11275.3 | -6.9 |
| Yucatan | 9769.4 | 8230.3 | 11644.5 | 9039.7 | 7468.0 | 10871.9 | -7.5 |
| Zacatecas | 9792.1 | 8203.6 | 11688.2 | 9128.1 | 7560.7 | 10969.9 | -6.8 |
Source: Global Burden of Disease Collaborative Network. Global Burden of Disease Study 2019 (GBD 2019) results. Seattle, United States: Institute for Health Metrics and Evaluation (IHME), 2020. Available from https://vizhub.healthdata.org/gbd-results/. Rate per 100,000 population.
Supplementary Table 2. Age-standardised YLD rates for blindness and vision loss by state, Mexico 1990-2019
| State | 1990 Rate | 1990 95%UI Lower | 1990 95%UI Higher | 2019 Rate | 2019 95%UI Lower | 2019 95%UI Higher | % change |
|---|---|---|---|---|---|---|---|
| Aguascalientes | 384.2 | 268.0 | 532.2 | 310.5 | 210.0 | 437.7 | -19.2 |
| Baja California | 384.0 | 268.3 | 533.0 | 310.8 | 211.4 | 439.5 | -19.1 |
| Baja California Sur | 387.5 | 268.7 | 534.9 | 317.6 | 216.0 | 446.4 | -18.1 |
| Campeche | 399.8 | 277.8 | 552.4 | 320.3 | 216.4 | 451.2 | -19.9 |
| Chiapas | 388.5 | 266.9 | 537.5 | 324.8 | 220.5 | 460.3 | -16.4 |
| Chihuahua | 403.4 | 279.7 | 561.3 | 334.2 | 227.6 | 474.7 | -17.2 |
| Coahuila | 403.3 | 281.0 | 560.6 | 327.2 | 221.2 | 460.8 | -18.9 |
| Colima | 396.0 | 275.9 | 548.7 | 316.6 | 214.6 | 446.5 | -20.0 |
| Durango | 417.0 | 288.2 | 581.7 | 334.3 | 224.0 | 474.9 | -19.8 |
| Guanajuato | 405.8 | 282.6 | 565.8 | 327.0 | 222.6 | 463.9 | -19.4 |
| Guerrero | 414.5 | 285.7 | 577.2 | 329.6 | 223.4 | 466.7 | -20.5 |
| Hidalgo | 452.5 | 314.6 | 627.7 | 368.1 | 251.0 | 522.6 | -18.6 |
| Jalisco | 394.3 | 273.2 | 547.3 | 315.8 | 214.3 | 443.5 | -19.9 |
| State of Mexico | 394.5 | 271.2 | 546.9 | 318.9 | 217.1 | 447.5 | -19.2 |
| National | 405.9 | 282.6 | 564.4 | 328.9 | 222.4 | 463.9 | -19.0 |
| Mexico City | 400.4 | 275.4 | 557.9 | 332.5 | 223.6 | 473.2 | -16.9 |
| Michoacan | 469.2 | 326.9 | 647.3 | 384.7 | 261.8 | 544.4 | -18.0 |
| Morelos | 405.6 | 279.8 | 564.0 | 331.4 | 224.5 | 470.3 | -18.3 |
| Nayarit | 406.8 | 284.9 | 565.1 | 324.8 | 219.9 | 457.4 | -20.2 |
| Nuevo Leon | 370.3 | 256.5 | 513.3 | 317.8 | 217.1 | 446.0 | -14.2 |
| Oaxaca | 409.4 | 283.2 | 567.5 | 323.8 | 221.6 | 456.7 | -20.9 |
| Puebla | 409.5 | 283.2 | 566.6 | 330.4 | 226.4 | 465.4 | -19.3 |
| Queretaro | 364.1 | 252.7 | 508.7 | 296.8 | 200.6 | 420.4 | -18.5 |
| Quintana Roo | 440.3 | 308.9 | 608.1 | 357.3 | 245.7 | 501.3 | -18.8 |
| San Luis Potosi | 406.5 | 283.1 | 565.8 | 321.8 | 218.7 | 455.2 | -20.8 |
| Sinaloa | 396.8 | 275.8 | 546.8 | 318.2 | 215.8 | 449.2 | -19.8 |
| Sonora | 466.4 | 327.6 | 643.2 | 389.9 | 270.8 | 542.0 | -16.4 |
| Tabasco | 409.6 | 285.2 | 569.3 | 325.5 | 220.0 | 458.2 | -20.5 |
| Tamaulipas | 387.1 | 272.5 | 538.5 | 312.4 | 210.1 | 441.0 | -19.3 |
| Tlaxcala | 434.5 | 299.6 | 602.8 | 356.6 | 242.9 | 505.8 | -17.9 |
| Veracruz | 400.4 | 275.4 | 557.9 | 326.6 | 222.3 | 460.8 | -19.9 |
| Yucatan | 469.2 | 326.9 | 647.3 | 316.3 | 215.3 | 446.0 | -19.9 |
| Zacatecas | 405.6 | 279.8 | 564.0 | 336.6 | 232.3 | 472.4 | -18.5 |
Source: Global Burden of Disease Collaborative Network. Global Burden of Disease Study 2019 (GBD 2019) results. Seattle, United States: Institute for Health Metrics and Evaluation (IHME), 2020. Available from https://vizhub.healthdata.org/gbd-results/. Rate per 100,000 population.
References
- Bourne RR, Flaxman SR, Braithwaite T, et al. Magnitude, temporal trends, and projections of the global prevalence of blindness and distance and near vision impairment: a systematic review and meta-analysis. Lancet Glob Health. 2017;5(9):e888–e897. Doi:10.1016/S2214-109X(17)30293-0
- Leasher JL, Braithwaite T, Furtado JM, et al. Prevalence and causes of vision loss in Latin America and the Caribbean in 2015: magnitude, temporal trends and projections. Br J Ophthalmol. 2019;103(7):885-893. Doi:10.1136/bjophthalmol-2017-311746
- Campbell V, Crews J, Moriarty D, Zack M, DK; Blackman. Surveillance for sensory impairment, activity limitation, and health-related quality of life among older adults-United States, 1993-1997. Morb Mortal Wkly Rep. Published online 1999.
- Lupsakko T, Mäntyjärvi M, Kautiainen H, Sulkava R. Combined hearing and visual impairment and depression in a population aged 75 years and older. Int J Geriatr Psychiatry. 2002;17(9):808-813. Doi:10.1002/gps.689
- Kempen GI, Verbrugge LM, Merrill SS, Ormel J. The impact of multiple impairments on disability in community-dwelling older people. Age Ageing. 1998;27(5):595-604.
- Schneider JM, Gopinath B, McMahon CM, Leeder SR, Mitchell P, Wang JJ. Dual sensory impairment in older age. J Aging Health. 2011;23(8):1309-1324. Doi:10.1177/0898264311408418
- Manrique-Espinoza B, Salinas-Rodríguez A, Moreno-Tamayo KM, et al. Health conditions and functional status of older adults in Mexico. Salud Publica de Mex. 2013;55(Suppl 2):s323-s331.
- Flaxman SR, Bourne RR, Resnikoff S, et al. Global causes of blindness and distance vision impairment 1990–2020: a systematic review and meta-analysis. Lancet Glob Health. 2017;5:e1221–34. Doi:10.1016/S2214-109X(17)30393-5
- Madueña-Angulo SE, Beltran-Ontiveros SA, Leal-Leon E, et al. National sex- and age-specific burden of blindness and vision impairment by cause in Mexico in 2019: a secondary analysis of the Global Burden of Disease Study 2019. The Lancet Regional Health – Americas. 2023;24:100552. Doi:10.1016/j.lana.2023.100552
- World Health Organization (WHO). Report of the 2030 Targets on Effective Coverage of Eye Care.; 2022.
- Vos T, Lim SS, Abbafati C, et al. Global burden of 369 diseases and injuries in 204 countries and territories, 1990–2019: a systematic analysis for the Global Burden of Disease Study 2019. The Lancet. 2020;396(10258):1204-1222. Doi:10.1016/S0140-6736(20)30925-9
- Naghavi M, Abajobir AA, Abbafati C, et al. Global, regional, and national age-sex specific mortality for 264 causes of death, 1980–2016: a systematic analysis for the Global Burden of Disease Study 2016. The Lancet. 2017;390(10100):1151-1210. Doi:10.1016/S0140-6736(17)32152-9
- Allen C, Arora M, Barber RM, Bhutta Zulfiqar A, Brown Alexandria, Carter Austin. Global, regional, and national incidence, prevalence, and years lived with disability for 310 diseases and injuries, 1990-2015: a systematic analysis for the Global Burden of Disease Study 2015. Lancet. 2016;388(10053):1545-1602. Doi:10.1016/S0140-6736(16)31678-6
- Vos T, Abajobir AA, Abate KH, et al. Global, regional, and national incidence, prevalence, and years lived with disability for 328 diseases and injuries for 195 countries, 1990–2016: a systematic analysis for the Global Burden of Disease Study 2016. The Lancet. 2017;390(10100):1211-1259. Doi:10.1016/S0140-6736(17)32154-2
- Limburg H, Silva JC, Foster A. Cataract in Latin America: findings from nine recent surveys. Rev Panam Salud Publica. 2009;25(5):449-455. Doi:10.1590/s1020-49892009000500011
- López-Star EM, Allison-Eckert K, Limburg H, Brea-Rodríguez I, Lansingh VC. Evaluación rápida de la ceguera evitable, incluida la retinopatía diabética, en Querétaro, México. Revista Mexicana de Oftalmología. 2018;92(2S):84-93. Doi:10.24875/RMO.M18000016
- Lopez-Ramos A, Gomez-Bastar PA