


Real-World Outcomes of High-Risk Diabetic Macular Edema
Real-world management and long-term outcomes of high-risk diabetic macular edema
Maya G. Pandowal1*, Khaled Khudadah2†, Maya Mitkova3‡
- Ophthalmology Department, Al-Ahmed KOC Hospital, Kuwait, †Al-Ahmed KOC Hospital, Kuwait, ‡Assistant Professor, Head of Math & Natural Sciences Department, College of Arts & Sciences Gulf University for Science and Technology, Kuwait
OPEN ACCESS
PUBLISHED: 23 March 2024
CITATION: PANDOVA, Maya G; KHUDADAH, Khaled; MITKOVA, Maya. Real-world management and long-term outcomes of high-risk diabetic macular edema. Medical Research Archives, [S.l.], v. 12, n. 12, dec. 2024. Available at: <https://esmed.org/MRA/mra/article/view/6071>.
DOI: https://doi.org/10.18103/mra.v12i12.6071
ISSN 2375-1924
Abstract
Purpose: Visual outcome and long-term stability of Kuwaiti diabetic patients at high risk of poor visual prognosis due to diabetic macular edema (DME), in response to early intravitreal treatment initiation and multidisciplinary management.
Methods: Longitudinal observational study of 152 eyes of 81 patients with type 2 diabetes and DME treated and monitored for 6 to 13 years.
Results: High risk of incomplete or unstable response to treatment and low final vision were associated with age over 65 years at presentation, female gender, poor metabolic control, nephropathy, baseline best-corrected visual acuity (BCVA) less than 20/40 , chronicity of the edema and atrophic changes in outer retinal layers of the macula.
Incomplete and unstable response to treatment had 80% of the eyes. Recurrences were associated with cardiac and renal complications and had severe impact on eyes with lower baseline vision .Eyes with higher baseline vision had small vision fluctuations during recurrences of the edema and recovered after treatment.
The cohort had improvement in vision after the first year of treatment, but only 25% of the eyes with lower baseline BCVA could retain it. 81% of the eyes with baseline BCVA over 20/30 maintained it for at least 6 years despite frequent recurrences.
Mean annual number of injections in the whole cohort was in the range of 1.6 ± 2.2 and was not associated with response of the edema and final BCVA.
Conclusions: Early initiation and long-term strategy of multidisciplinary management is more effective for Kuwaiti patients with high-risk diabetic maculopathy compared to observation and delay until the visual acuity deteriorates.
Introduction
The introduction of intravitreal pharmacotherapy dramatically improved the visual prognosis of the patients with diabetic macular edema (DME). However, the pivotal randomized clinical trials (RCT’s) demonstrated that a sizable proportion of the eyes remained with deteriorated visual acuity despite intensive treatment and vigorous monitoring — 20.6% of the eyes in Protocol T had visual acuity 20/50 to 20/160 and further 2.1% saw less than 20/200 at the end of the second year¹. Moreover, after transition to standard clinical care for the next three years, the visual acuity worsened even in patients with significant vision gain². Real-world studies on DME management from Europe, USA, Japan and Australia revealed visual outcomes that were meaningfully inferior to those achieved in RCT’s and that result was attributed mainly to insufficient number of intravitreal injections³⁴⁵⁶⁷⁸.
These data suggest that many patients with DME remain at high risk for profound and irreversible vision deterioration if treatment was initiated following the current standards of care. Advanced age, low visual acuity, clinical signs of chronicity and severe non-proliferative and active proliferative retinopathy at baseline have been associated with less vision gain, persistent edema and worse visual prognosis in DRCR.net Protocol T¹²¹³. The hypothesis whether earlier intervention could reduce the risk of poor visual outcome was investigated in DRCR.net Protocol V. Prospective assessment on the decision making for eyes with center-involving DME and visual acuity better than 20/32 indicated that observation until vision worsens appears to be a reasonable approach⁹. The level of metabolic control and the systemic complications of diabetes were evaluated in the RCT’s at baseline only, and there are still controversies regarding their impact on the severity of DME and its response to treatment. Moreover, in real practice the patients differ from the participants in RCT’s where good systemic control and high motivation are key requirements for enrolment¹⁰¹¹¹²¹³.
In comparison to real-life studies and particularly RCT’s done in Europe and the USA, the diabetic patients with macular edema from the Middle East have substantial differences in the response to treatment and functional outcome. Moreover, a recent review of the global prevalence of diabetic retinopathy has reported one of the highest odds prevalence of DM vision-threatening diabetic retinopathy and diabetic macular edema in the Middle East and North Africa region, particularly among Arabs from the Gulf²³²⁴.
The aim of this longitudinal observational study was:
-
To outline the key features of Kuwaiti diabetic patients at high risk of poor visual prognosis due to DME;
-
Estimate the visual outcome after early treatment initiation whenever possible, combined with flexible strategy and multidisciplinary management; and
-
To evaluate the long-term stability of the edema in response to this approach.
Methods
PATIENTS SELECTION
The medical records of 220 patients diagnosed with DME who were treated at Ahmadi Kuwait Oil Company Hospital between 2007 to 2020 were reviewed. The facility is providing comprehensive general medical care, including ophthalmic and family medicine services, without charges. Only eyes with DME confirmed on spectral-domain or swept-source optical coherence tomography (OCT) imaging at initial diagnosis and at least 6 years of follow up with OCT were included in further analysis. Eyes with a history of ocular conditions such as significant corneal opacities, age-related macular degeneration, retinal vein and artery occlusion, end-stage glaucoma, vitreomacular traction (VMT), myopic maculopathy, non-arteritic anterior ischemic optic neuropathy or retinopathies unrelated to diabetes were excluded. Eyes with medically controlled glaucoma, posterior vitreous detachment, early to moderate cataract and vitreomacular adhesion or epiretinal membranes without VMT were not excluded. Ethical approval to conduct research was granted by the Institutional Review Board of Ahmadi KOC Hospital and the study was completed in accordance with the tenets of the Declaration of Helsinki.
FOLLOW-UP
Lapses in follow up and treatment are rather common in the Middle East, in some cases related to admissions and management of cardiovascular, renal, oncological and other serious medical conditions, and in other cases due to travelling and staying abroad. The patients were considered to have a short lapse in care despite substantial effort by the department staff to facilitate timely completion of examinations and treatment if they missed appointments for 3 to 6 months; a long lapse was lasting 7 months to 2 years; a dropout was recorded if the patient failed to present after 3 years or the death of the patient was reported by the relatives.
METABOLIC CONTROL
Poor metabolic control was defined following the recommendations of the American Diabetes Association (ADA): poor glycemic control (HbA1c ≥ 7% (53 mmol/mol)), poorly controlled blood pressure (BP ≥ 140/90 mmHg), and poor controlled LDL-cholesterol (LDL ≥ 100 mg/dl)¹⁴. Cardiovascular risk factors and/or diseases included elevated arterial blood pressure, dyslipidemia, coronary artery disease, myocardial infarction and stroke prior or in the course of the observation period. Diabetic nephropathy was defined in patients with persistent albuminuria (>300 mg/d or >200 μg/min) that is confirmed on at least 2 occasions 3–6 months apart, progressive decline in the glomerular filtration rate (GFR) and arterial hypertension (ADA’s “Standards of Medical Care in Diabetes – 2021”)¹⁵. Random plasma glucose was measured prior to each intravitreal injection and HbA1c was measured at the retina clinic at diagnosis of DME and repeated during recurrences of the edema throughout the observation period. Patients with poor control and deteriorating non-ocular diabetic complications were referred for further management to the treating physician.
OPHTHALMIC EXAMINATIONS
Ophthalmic findings included BCVA, cataract types and grades and severity of diabetic retinopathy. Data were collected from follow-up visits until the most recent available annual visit, up to a total of 6 to 13 years. Snellen readings for BCVA were converted to a logarithm of the minimal angle of resolution (logMAR) or decimal scale for statistical analyses. Cataract types and grades were classified on a lens opacity scale of 0–3 for nuclear, cortical, and posterior subcapsular cataracts. Pseudophakic eyes at baseline and eyes that underwent cataract surgery in the course of the study period were recorded accordingly. Glaucoma prior to inclusion or in the course of the study period was also recorded. Severity of diabetic retinopathy was classified as mild non-proliferative diabetic retinopathy (NPDR), moderate NPDR, severe NPDR, non-high-risk proliferative diabetic retinopathy (PDR), and high-risk PDR and presence of ischemic areas was noted at each visit. OCT was performed using Cirrus HD-OCT (Carl Zeiss Meditec) with activated tracker registration and the accuracy of grid centration and retinal layer segmentation was evaluated prior to comparisons and data collection. Description of the OCT findings included type and location of the edema, presence of hyperreflective foci and hard exudates, and integrity of the inner and outer retinal layers.
OCULAR TREATMENTS
The number and type of intravitreal injections and laser treatments were cumulated separately at yearly follow-up visits. Laser treatments included focal and panretinal procedures performed with Argon blue-green laser (70% blue (488 nm) and 30% green (514 nm)), Frequency-doubled Nd-YAG Laser (532 nm) or Diode laser (805–810 nm). Types of intraocular injections included 0.5 mg ranibizumab, 2 mg aflibercept, 0.7 mg intravitreal dexamethasone and 190 micrograms fluocinolone acetonide intravitreal implants.
Treatment was initiated if there was:
-
A decrease in the BCVA since the previous visit associated with any amount of intraretinal and/or subretinal fluid;
-
Central foveolar subfield thickness exceeding 300 micrometers on OCT;
-
Perimacular intraretinal or subretinal fluid collections progressing towards the macula.
The loading dose consisted of 3 to 5 intravitreal injections followed by observation and repeated injections on an as-needed basis. Dexamethasone and fluocinolone acetonide intravitreal implants were used in eyes with:
-
Severe edema with signs of chronicity;
-
Incomplete or unstable response to anti-VEGF treatment;
-
Prior to cataract surgery;
-
Frail and disabled elderly patients with multiple comorbidities as maintenance treatment;
-
Pregnancy.
STATISTICAL ANALYSIS
For descriptive analysis, categorical data are presented as frequency and percentage (%); continuous data are shown as means with standard deviations (SD). Pearson’s chi² test and Mann–Whitney test were applied to test for differences between independent groups. Spearman’s Rho was used for correlation analysis. For variance analysis, the Friedman test was applied to test for differences of continuous parameters across follow-up time points. The age at diagnosis of DME, gender, systemic factors, key elements of the ophthalmic status, annual number of injections, response and stability were included in multiple logistic regression models through stepwise selection to find the best model consisting of optimal combination variables. Statistical analysis was performed in IBM SPSS Statistics software version 27.0 (IBM Corp., Armonk, NY, USA); two-sided p<0.05 was considered as statistically significant.
Results
DEMOGRAPHICS AND BASELINE CHARACTERISTICS
A total of 152 eyes of 81 patients with type 2 diabetes and DME were qualified to be included in the analysis (male 56% and female 44%), and mean age at presentation (± SD) was 60.09 ± 7.8 years. The rest of the patients included in the review did not complete a follow up of at least 6 years or died.
Table 1. Age, gender and systemic comorbidities at baseline
| Patients with final BCVA 20/40 and better | Patients with final BCVA 20/50 and less | Difference (p) | |
|---|---|---|---|
| Mean age (SD – standard deviation) | 60.63 ± 7.71 | 65.39 ± 7.23 | p = 0.003 |
| Male, % | 59.6 | 47.3 | 0.3447 |
| Poor metabolic control, % | 85.93 | 94.73 | 0.4463 |
| Cardiovascular complications, % | 90.32 | 89.47 | 0.914 |
| Nephropathy, % | 29.03 | 52.63 | p = 0.0005 |
| Foot ulcer, % | 6.45 | 10.52 | 0.404 |
| Cardiovascular complications + poor metabolic control, % | 79.68 | 94.73 | p = 0.1270 |
| Hemodialysis, % | 6.45 | 10.52 | p = 0.5558 |
For further comparisons, the eyes were divided into two groups by their final BCVA after monitoring for at least six years — 20/40 to 20/20 (124 eyes of 62 subjects, Group A) and 20/50 and less (28 eyes of 19 subjects, Group B).
The distribution by sex was similar in both groups (p = 0.3447); however, female gender was significantly associated with lower final BCVA (p = 0.004).
Age of the patients at baseline had significant negative association with the final BCVA (p < 0.001). The mean age at presentation was 60.63 ± 7.71 among the patients in group A compared to 65.39 ± 7.23 in group B, and the difference was significant (p = 0.003). The odds ratio of achieving higher final BCVA was 1.595 (95% CI: 0.6410 to 3.9722) for patients below the age of 65 years at baseline.
FOLLOW-UP
All patients had lapses in their care starting from the first year, however the proportion of longer lapses and death throughout the study period was significantly higher in the group with lower final BCVA (p < 0.0001 and p = 0.0131, respectively). The number of patients under care decreased after the fourth year in both groups in a similar pattern.
METABOLIC CONTROL
Poor metabolic control had a significant negative association with the final BCVA (p = 0.028). The mean level of HbA1c at baseline was 9.17% ± 1.83 without significant differences between the groups. It had substantial variations through the study period and at the time of the final assessment was 8.68% ± 1.98 in a similar pattern for the whole cohort.
A large proportion of patients in both groups had combined poor metabolic control, high cardiovascular risk and frank cardiovascular comorbidities in the range of 79.68% to 94.73% without differences. Diabetic nephropathy was affecting significantly higher proportion of patients in group B — 52% vs. 29% (p = 0.0005) and had significant negative association with final BCVA (p = 0.002). However, the proportion of patients on hemodialysis was similar — 4% vs. 10% (p = 0.5558). The multiple regression model combining age, gender, metabolic control, cardiac complication, nephropathy and being on hemodialysis had R² = 0.302 and predictive negative association with final BCVA (p = 0.02).
OPHTHALMIC OUTCOMES
Mean baseline BCVA of the total cohort was 0.1760 ± 0.5622 logMAR (Snellen equivalent 20/30). Baseline BCVA had significant positive association with final BCVA (p < 0.001). The eyes in group A had significantly higher mean baseline BCVA compared to those in group B — 0.1139 ± 0.0413 logMAR (Snellen equivalent 20/26) vs. 0.3521 ± 0.5797 logMAR (Snellen equivalent 20/45) (p = 0.001) (Table 2).
Table 2. Ophthalmic findings at baseline
| Eyes with final BCVA 20/40 and better | Eyes with final BCVA 20/50 and less | Difference (p) | |
|---|---|---|---|
| Mean BCVA (Standard deviation) | 0.7651 ± 0.878 | 0.4442 ± 0.2601 | 0.001 |
| PDR, % | 53.96 | 65.38 | 0.2730 |
| NPDR, % | 44.48 | 34.65 | 0.3457 |
| Macular edema, % | 61.11 | 75 | 0.1710 |
| Perimacular edema, % | 39.68 | 25 | 0.1494 |
| Atrophic changes in the macula, % | 3.17 | 19.23 | 0.0014 |
| Epiretinal membrane, % | 16.66 | 26.92 | 0.2086 |
| Cataract, % | 33.33 | 42.30 | 0.3703 |
| Glaucoma, % | 19.35 | 32.14 | 0.1210 |
| Pseudophakia, % | 16.12 | 17.85 | 0.8971 |
Cataracts, pseudophakia and glaucoma affected both groups of eyes without significant difference.
At baseline, the majority of the eyes had severe NPDR (44% – 34%), high-risk PDR (53% – 65%) and ischemic changes were noted in 92%, affecting both groups without significant difference and no association with the final BCVA. The edema was located in the macula in 61% in group A and 75% in group B, or in the perimacular area (39% – 25%). Symptoms of chronicity were negatively associated with final BCVA (p = 0.053).
Changes in the central outer retinal layers with barely detectable, interrupted or non-detectable ellipsoid zone or disorganized inner retinal layers were noted in a larger proportion of the eyes in group B — 19% vs. 3% (p = 0.0014) and were associated with chronic persistent edema. Asymptomatic epiretinal membranes or mild vitreomacular traction were seen in 16% to 26% of the eyes.
MANAGEMENT OF DME
Throughout the whole study period, the mean annual cumulative number of intravitreal injections was in the range of 1.46 ± 1.41 to 2.38 ± 1.745, and had measurable association with the final BCVA in a multiple regression model only for the first year (p = 0.024). The annual number of injections was less in the eyes in group A, however the difference reached significance only in Year 6. (Fig. 1)
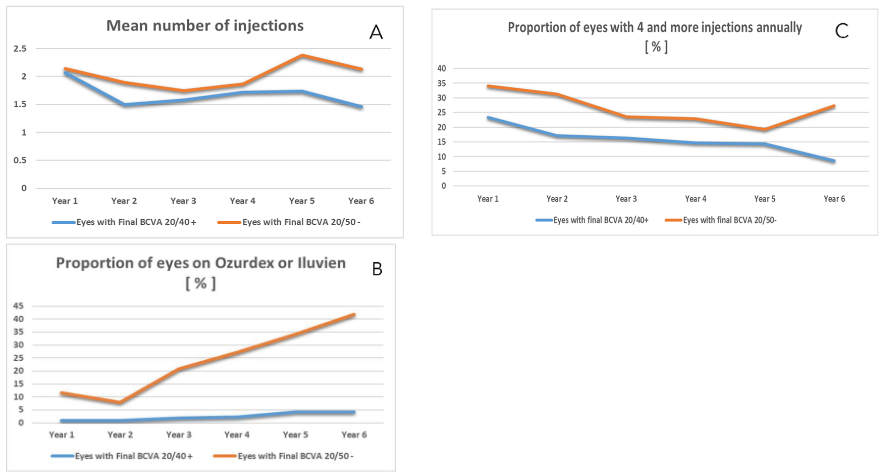
Fig. 1.
A. Mean annual cumulative number of intravitreal injections in groups A and B — no significant difference between the groups (p from 1.00 to 0.087).
B. Proportion of eyes receiving steroid implants — significant difference between the groups (p from <0.001 to 0.0307).
C. Proportion of eyes with 4 and more injections annually — no significant difference between the groups (p from 0.1397 to 0.7208).
The proportion of eyes receiving steroid implants was significantly higher among the eyes in group B totally and through each of the study years, reaching 37.5% vs. 4.25% in Year 6.
All patients treated with steroid implants had mild elevation of the intraocular pressure (IOP) to 26–28 mm Hg that responded favorably to antiglaucoma eye drops; none of the patients required a laser procedure or surgery for uncontrollable IOP.
Approximately 25% of the eyes in group A had no injections during the first year, followed by a decrease to 7% in the second and 11% in the third, and gradual increase to 31.9% in Year 6.
The proportion of eyes in group B without intravitreal injections started increasing after Year 3 and by Year 6 the difference between the two groups was insignificant.
The proportion of eyes with 3 or less injections per year was similar in both groups. There was no significant difference between both groups in the proportion of eyes where 4 or more injections were done per year.
Focal perimacular laser treatment and panretinal photocoagulation was done in 90% of the eyes in group A and in all eyes in group B.
VISUAL OUTCOME OF DME TREATMENT
By the end of the first year, BCVA of the total cohort had a mean improvement by one line (p = 0.0009), followed by gradual decrease by 1.9% – 2.5% annually that did not reach statistical significance and ended up with logMAR 0.17 (Snellen equivalent 20/30.6).
The eyes in group A had insignificant improvement in their vision after the first year from logMAR 0.11 (Snellen equivalent 20/26) to logMAR 0.09 (Snellen equivalent 20/25) that remained stable in the next three years, decreased by 1% annually and in Year 6 was around logMAR 0.13 (Snellen equivalent 20/27).
At the end of the first year, the eyes in group B had an improvement from 0.35 logMAR (Snellen equivalent 20/45) to logMAR 0.27 (Snellen equivalent 20/38), followed by gradual decline to logMAR 0.44 (Snellen equivalent 20/56), however these changes did not reach statistical significance.
The difference in the mean annual BCVA in both groups throughout the whole observation period was statistically significant (p < 0.001 to p = 0.066).
The proportion of eyes with BCVA 20/40 and better in each study year was in the range of 72% to 88% in group A. Among the eyes in group B, this proportion increased significantly from 34% at baseline to 59% after the first year (p = 0.0676), followed by gradual decrease in the next three years and sharp decline to 25% by the end of observation. (Fig. 2)
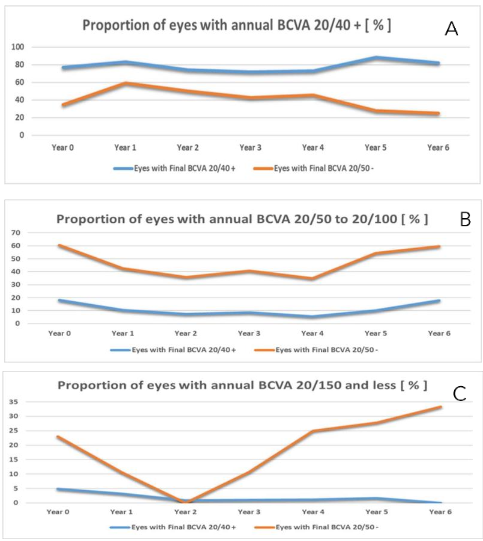
Fig. 2
A. Proportion of eyes with BCVA 20/40 and better in each study year by groups. While it was in the range of 72% to 88% in group A, in group B, this proportion increased significantly from 34% at baseline to 59% after the first year (p = 0.0676), followed by gradual decrease in the next three years and sharp decline to 25% by the end of observation.
B. Proportion of eyes with annual BCVA between 20/50 and 20/100 — throughout the whole study period was much larger in group B — 28% to 44% vs. 7% to 17%.
C. Proportion of eyes with BCVA 20/150 and less — in group A decreased from 4.8% to 0, however the differences did not reach significance. During the first year, the percentage of these eyes in group B dropped from 23% to 10% and through the next years increased to 33%. The proportion of eyes with annual BCVA between 20/50 and 20/100 fluctuated substantially throughout the whole study period and was much larger in group B — 28% to 44% vs. 7% to 17% in group A.
The proportion of eyes with BCVA 20/150 and less gradually decreased from 4.8% to 0 in group A; however, the differences did not reach significance. During the first year, the percentage of these eyes in group B dropped from 23% to 10% and through the next years increased to 33%.
MORPHOLOGICAL OUTCOME OF DME TREATMENT
Persistent macular edema was evident at the last visit in 25% of the eyes in group A and in 35% in group B without significant differences.
Persistent edema in the perimacular area at the final visit was recorded in 29% of the eyes in group A vs. 14% in group B (p = 0.070).
No macular or perimacular edema at their final visit was seen in 24% in group A and 39% in group B.
The proportion of eyes with atrophic changes in the outer retinal layers with barely detectable, interrupted or non-detectable ellipsoid zone or disorganized inner retinal layers remained unchanged in group A — 3.22% at baseline vs. 4.03% at final visit (p = 0.733). The percentage of these defects in group B increased from 19% at baseline to 39% at the final visit (p = 0.00786).
RESPONSE AND STABILITY
A substantial number of eyes had incomplete response to intravitreal treatment and presented with residual intra- and subretinal fluid throughout the study period; however, group B was more affected — 85% compared to 60% in group A (p = 0.0117).
The proportion of eyes with recurrent and unstable macular edema was large, affecting 73% in group A and 96% in group B (p = 0.0085). Most recurrences were related to deteriorating metabolic control, decompensating coronary artery disease and progressing renal failure. Approximately 60% of the patients in both groups needed referral for specialized management of these complications.
Discussion
The prevalence of diabetes in Kuwait is among the top 10 in the world and in 2019 it reached 19.1%, a 2.5-fold increase from the 7.6% crude diabetes prevalence reported in 1996, thus affecting 64.8% of the adults aged 60 years or more¹⁶. Diabetic retinopathy and maculopathy became the leading cause of registered legal blindness among adults over the age of 60 years in the last decade despite the availability of qualified care, medications, clear guidelines from the randomized clinical trials and high standards of life¹⁷. These unfavorable results have been attributed to various causes such as: late detection of DME, inadequate treatment or lack of compliance on behalf of the patients.
Increased risk of low vision, incomplete or unstable response to treatment for DME among the patients in this cohort was associated with age over 65 years at onset of treatment, female gender, poor metabolic control, especially in combination with diabetic nephropathy, baseline BCVA less than 20/40, signs of chronicity and atrophic changes in the macula at baseline. Intensive management of the metabolic control and the complications was required throughout the whole study period as most of the patients were in an advanced stage of their diabetes.
Early initiation of intravitreal treatment was associated with a significantly higher proportion of eyes with better BCVA through the study years. The whole cohort had notable improvement in vision after the first year of treatment, however few of the eyes with lower baseline BCVA were able to retain it. The eyes with baseline BCVA over 20/30 gradually increased in our practice and as a result, BCVA of 20/40 or better was maintained in 81% of the eyes for at least 6 years despite the high risk of recurrences.
A large proportion of the eyes had incomplete and unstable response to the treatment and persistent
Macular or perimacular edema, often associated with deterioration of the cardiac and renal complications. Such periods had significant negative impact on the eyes with lower baseline vision, however the eyes with higher baseline vision had minor functional fluctuations during such periods and recovered well afterwards.
The mean annual number of injections in the whole cohort was relatively low and was not associated with significant differences in the response and final BCVA. Early switch to intravitreal steroid implants resulted in improved control in the eyes with chronic DME and lower baseline BCVA; however, the functional outcome was negatively affected by the disorganization and atrophy in the macula.
An exploratory analysis of DRCR.net Protocol T, in which participants were randomized to receive bevacizumab, ranibizumab, or aflibercept, found that the magnitude of vision improvement after anti-VEGF treatment decreased by 1 letter for each 1% increase in HbA1c levels at baseline. More recently, lower HbA1c levels at baseline (7% or less) were significantly associated with greater reduction in central macular subfield thickness at one month after injection of bevacizumab or ranibizumab; however, the change in BCVA after treatment did not have any correlation with the glycemic control¹⁰. Chen et al. reported that after one year of treatment on ranibizumab, only in the responder group the baseline level of HbA1c was significantly associated with the changes in BCVA and the final BCVA¹².
The common methodological issue with these trials and cohorts under observation is the estimate of glycemic control — HbA1c at baseline only. There is a significant variability in the glucose plasma levels in diabetic patients. Its impact on microvascular complications in type 2 diabetes was investigated in a post-hoc analysis of 12,042 participants in both Action to Control Cardiovascular Risk in Diabetes and the Veteran Affairs Diabetes Trial that were observed for 84 to 87 months. Variability measures included coefficient of variation and average real variability for fasting glucose. Both indices were associated with development of future microvascular outcomes even after adjusting for other risk factors, including measures of average glycemic control (i.e., cumulative average of HbA1c). Meta-analyses of these trials confirmed these findings and indicated fasting plasma glucose variations may be more harmful in those with less intensive glucose control¹³.
At baseline, our patients presented with advanced complications of their diabetes; their metabolic control was unsatisfactory and unstable throughout the whole observation period to a level considerably higher than that reported in real-life studies — 9.17% vs. 7.33%–7.5% in Europe⁷⁸ or 8.76% in a USA cohort¹¹. Moreover, in the course of these 6 to 13 years, our patients developed heart complications that required multiple interventions, had strokes, renal failure, gangrene and needed amputations, and many died. The edema often regressed after induction to dialysis, however the final BCVA improved only in eyes with high baseline BCVA, consistent with the findings of Takamura Y et al.²¹.
Age at baseline is a well-known predictive factor affecting the visual outcome of DME management¹²¹³. The mean age of this Kuwaiti cohort at baseline was 60.83 years, considerably younger than the patients from the reports of Van Aken E. et al. — 66 years, Stefanickova J. et al. — 64.1 years, or the series of Luu KY et al. with higher baseline BCVA from the US — 62.1 years. Onset of clinical diabetes among Kuwaiti patients is early and by the age of 20–29 years, 5.4% of the local citizens are on treatment; from 30 to 44 years — 14.2%; from 45 to 59 years — 38.7%. It is preceded by metabolic syndrome in 14.8% of men and 11.5% of women.
This long duration of diabetes combined with poor metabolic control and multiple complications is precipitating the development of retinopathy and macular edema at a younger age — 48% of our patients were 59 years or less at baseline. Late diagnosis and initiation of treatment at 65 years of age or more was associated with less visual gain and lower final BCVA.
The findings in our study are strengthened by the extent of the follow-up, the consistent diagnostic and therapeutic approach, and constant interdisciplinary collaboration. Some limitations of this analysis merit consideration. This was a single-center retrospective search over a time period dating back to 2007 during which the diagnosis, classification and criteria for DME management evolved considerably. The clinical circumstances for treatment decisions, frequency of treatments, injection strategy and switching between medications reflected the accumulated knowledge from the pivotal RCTs and experience with patients from the Middle East. Intravitreal treatment was accepted in stages by the local diabetic patients and in the earlier years the eyes with more severe disease were likely to be over-represented. The drugs for intravitreal use were registered in the Middle East at different time points and we cannot conclude that a different initial drug or earlier transition to steroids would have improved the outcomes of eyes with delayed treatment.
The data were extracted from the electronic medical records of the patients and relied on the physicians’ documentation of the clinical findings. Visual acuity and BCVA were measured using Snellen rather than EDTRS charts and thus fine nuances and differences might have been missed.
Nevertheless, consistent with studies where early intervention has improved the visual outcome in eyes with DME¹²¹¹¹⁸¹⁹²², our findings support the concept that timely detection of the macular edema in eyes with higher vision at a younger age, prompt and sufficient intravitreal treatment, and intensive management of the metabolic control and systemic complications is more effective for Kuwaiti patients with high-risk DME compared to observation and delay until the BCVA deteriorates.
More clinical research is needed on diabetic patients from the Middle East to estimate the effect of such an approach in reducing the enormous burden of avoidable blindness due to diabetes.
Conflict of Interest:
None.
Funding Statement:
None.
Acknowledgements:
None.
Commercial Relationship Disclosures:
-
M. Pandova – Novartis (R), Allergan/Abbvie (R), Alimera (R), Bayer Ophthalmology (R)
-
Kh. Khudadah – None
-
M. Mitkova – None
References
1. Bressler NM, Beaulieu WT, Glassman AR, Blinder KJ, Bressler SB, Jampol LM, Melia M, Wells JA 3rd; Diabetic Retinopathy Clinical Research Network. Persistent Macular Thickening Following Intravitreous Aflibercept, Bevacizumab, or Ranibizumab for Central-Involved Diabetic Macular Edema With Vision Impairment: A Secondary Analysis of a Randomized Clinical Trial. JAMA Ophthalmol. 2018 Mar 1;136(3):257-269. Erratum in: JAMA Ophthalmol. 2018 May 1;136(5):601.
2. Glassman AR, Wells JA 3rd, Josic K, Maguire MG, Antoszyk AN, Baker C, Beaulieu WT, Elman MJ, Jampol LM, Sun JK. Five-Year Outcomes after Initial Aflibercept, Bevacizumab, or Ranibizumab Treatment for Diabetic Macular Edema (Protocol T Extension Study). Ophthalmology. 2020 Sep;127 (9):1201-1210
3. Ciulla TA, Bracha P, Pollack J, Williams DF. Real-world Outcomes of Anti-Vascular Endothelial Growth Factor Therapy in Diabetic Macular Edema in the United States. Ophthalmol Retina. 2018 Dec;2(12):1179-1187
4. Shimura M, Kitano S, Muramatsu D, Fukushima H, Takamura Y, Matsumoto M, Kokado M, Kogo J, Sasaki M, Morizane Y, Kotake O, Koto T, Sonoda S, Hirano T, Ishikawa H, Mitamura Y, Okamoto F, Kinoshita T, Kimura K, Sugimoto M, Yamashiro K, Suzuki Y, Hikichi T, Washio N, Sato T, Ohkoshi K, Tsujinaka H, Kusuhara S, Kondo M, Takagi H, Murata T, Sakamoto T; Japan Clinical Retina Study (J-CREST) group. Real-world management of treatment-naïve diabetic macular oedema in Japan: two-year visual outcomes with and without anti-VEGF therapy in the STREAT-DME study. Br J Ophthalmol. 2020 Sep;104(9):1209-1215.
5. Van Aken E, Favreau M, Ramboer E, Denhaerynck K, MacDonald K, Abraham I, Brié H. Real-World Outcomes in Patients with Diabetic Macular Edema Treated Long Term with Ranibizumab (VISION Study). Clin Ophthalmol. 2020 Dec 2;14:4173-4185.
6. Holekamp NM, Campbell J, Almony A, Ingraham H, Marks S, Chandwani H, Cole AL, Kiss S. Vision Outcomes Following Anti-Vascular Endothelial Growth Factor Treatment of Diabetic Macular Edema in Clinical Practice. Am J Ophthalmol. 2018 Jul;191:83-91. Erratum in: Am J Ophthalmol. 2018 Oct;194:192.
7. Stefanickova J, Cunha-Vaz J, Ulbig M, Pearce I, Fernández-Vega Sanz A, Theodossiadis P, Kodjikian L, Izmailov A, Muston D, Vassilev Z, Lamotte B, Tückmantel C, Friedl S, Altemark A, Schwarz HJ, Katz T; POLARIS study investigators. A noninterventional study to monitor patients with diabetic macular oedema starting treatment with ranibizumab (POLARIS). Acta Ophthalmol. 2018 Dec;96(8):e942-e949.
8. Ziemssen F, Wachtlin J, Kuehlewein L, Gamulescu MA, Bertelmann T, Feucht N, Voegeler J, Koch M, Liakopoulos S, Schmitz-Valckenberg S, Spital G; OCEAN study group. Intravitreal Ranibizumab Therapy for Diabetic Macular Edema in Routine Practice: Two-Year Real-Life Data from a Non-interventional, Multicenter Study in Germany. Diabetes Ther. 2018 Dec;9(6):2271-2289.
9. Baker CW, Glassman AR, Beaulieu WT, Antoszyk AN, Browning DJ, Chalam KV, Grover S, Jampol LM, Jhaveri CD, Melia M, Stockdale CR, Martin DF, Sun JK; DRCR Retina Network. Effect of Initial Management With Aflibercept vs Laser Photocoagulation vs Observation on Vision Loss Among Patients With Diabetic Macular Edema Involving the Center of the Macula and Good Visual Acuity: A Randomized Clinical Trial. JAMA. 2019 May 21;321(19):1880-1894. doi: 10.1001/ jama.2019.5790. PMID: 31037289; PMCID: PMC6537845.
10. Bressler, S. B., Odia, I., Maguire, M. G., Dhoot, D. S., Glassman, A. R., Jampol, L. M., Marcus, D. M., Solomon, S. D., Sun, J. K., & Diabetic Retinopathy Clinical Research Network (2019). Factors Associated With Visual Acuity and Central Subfield Thickness Changes When Treating Diabetic Macular Edema With Anti-Vascular Endothelial Growth Factor Therapy: An Exploratory Analysis of the Protocol T Randomized Clinical Trial. JAMA ophthalmology, 137(4), 382–389. https://doi.org/10.1001/jamaophthalmol.2018.6786
11. Wong WM, Chee C, Bhargava M, Chai C, Lin H, Zhao P, Ariadarma Mangunkusumo E, Naing T, Yuen YS, Wong TY, Su X, Lingam G. Systemic Factors Associated with Treatment Response in Diabetic Macular Edema. J Ophthalmol. 2020 Mar 19;2020:1875860. doi: 10.1155/2020/1875860. PMID: 32280516; PMCID: PMC7125481.
12. Chen, YP., Wu, AL., Chuang, CC. et al. Factors influencing clinical outcomes in patients with diabetic macular edema treated with intravitreal ranibizumab: comparison between responder and non-responder cases. Sci Rep 9, 10952 (2019).
13. Zhou JJ, Koska J, Bahn G, Reaven P. Fasting Glucose Variation Predicts Microvascular Risk in ACCORD and VADT. J Clin Endocrinol Metab. 2021 Mar 25;106(4):1150-1162. doi: 10.1210/ clinem/dgaa941. PMID: 33367811; PMCID: PMC7993576.
14. American Diabetes Association; 2. Classification and Diagnosis of Diabetes: Standards of Medical Care in Diabetes—2021. Diabetes Care 1 January 2021; 44 (Supplement_1): S15–S33. https://doi.org/10.2337/dc21-S002
15. American Diabetes Association; 11. Microvascular Complications and Foot Care: Standards of Medical Care in Diabetes—2021. Diabetes Care 1 January 2021; 44 (Supplement_1): S151–S167. https://doi.org/10.2337/dc21-S011
16. Alkandari A, Alarouj M, Elkum N, Sharma P, Devarajan S, Abu-Farha M, Al-Mulla F, Tuomilehto J, Bennakhi A. Adult Diabetes and Prediabetes Prevalence in Kuwait: Data from the Cross-Sectional Kuwait Diabetes Epidemiology Program. J Clin Med. 2020 Oct 25;9(11):3420. doi: 10.3390/jcm9113420.
17. Pandova MG, Al-Merjan JI, Sadeq NA. Registered blindness in Kuwait – 15 years of dynamic changes. Ophthalmic Epidemiol. 2019 Apr;26(2):75-83
18. Luu KY, Akhter MM, Durbin-Johnson BP, Moshiri A, Tran S, Morse LS, Park SS, Yiu G. Real-world management and long-term outcomes of diabetic macular oedema with good visual acuity. Eye (Lond). 2020 Jun;34(6):1108-1115.
19. Sacconi R, Battaglia Parodi M, Casati S, Lattanzio R, Marchini G, Bandello F. Dexamethasone Implants in Diabetic Macular Edema Patients with High Visual Acuity. Ophthalmic Res. 2017;58(3):125-130
20. Bressler SB, Odia I, Maguire MG, Dhoot DS, Glassman AR, Jampol LM, Marcus DM, Solomon SD, Sun JK; Diabetic Retinopathy Clinical Research Network. Factors Associated With Visual Acuity and Central Subfield Thickness Changes When Treating Diabetic Macular Edema With Anti-Vascular Endothelial Growth Factor Therapy: An Exploratory Analysis of the Protocol T Randomized Clinical Trial. JAMA Ophthalmol. 2019 Apr 1;137(4):382-389
21. Takamura Y, Matsumura T, Ohkoshi K, Takei T, Ishikawa K, Shimura M, Ueda T, Sugimoto M, Hirano T, Takayama K, Gozawa M, Yamada Y, Morioka M, Iwano M, Inatani M. Functional and anatomical changes in diabetic macular edema after hemodialysis initiation: One-year follow-up multicenter study. Sci Rep. 2020 May 8;10(1):7788
22. Iglicki M, Lavaque A, Ozimek M, Negri HP, Okada M, Chhablani J, Busch C, Loewenstein A, Zur D. Biomarkers and predictors for functional and anatomic outcomes for small gauge pars plana vitrectomy and peeling of the internal limiting membrane in naïve diabetic macular edema: The VITAL Study. PLoS One. 2018 Jul 11;13(7): e0200365.
23. Teo ZL, Tham YC, Yu M, Chee ML, Rim TH, Cheung N, Bikbov MM, Wang YX, Tang Y, Lu Y, Wong IY, Ting DSW, Tan GSW, Jonas JB, Sabanayagam C, Wong TY, Cheng CY. Global Prevalence of Diabetic Retinopathy and Projection of Burden through 2045: Systematic Review and Meta-analysis. Ophthalmology. 2021 Nov;128 (11):1580-1591.
24. AlQahtani AS, Hazzazi MA, Waheeb SA, Semidey VA, Semidey VA, Elgendy HK, Alkhars WI, Abouammoh MA, Al-Dhibi H. Saudi Arabia Guidelines for diabetic macular edema: A consensus of the Saudi Retina Group. Saudi Med J. 20 21 Feb;42(2):131-145.