

Risk Stratification in Clinically Isolated Syndrome for MS
Risk Stratification of Clinically Isolated Syndrome for Multiple Sclerosis Development
Bahareh Rahmani¹*, Teagon Yu¹, Niharika Sangareddypeta¹, Bhavani Pentela¹, Bharath Kumar Reddy Maadhu¹, Pavithra Kudumula¹, Leslie Hinyard¹, Payam Norouzzadeh², Eli Snir³, Shamseldeen Mahmoud¹, Martin W. Schoen¹
- Saint Louis University, School of Medicine, Saint Louis, MO
- Saint Louis University, Professional Studies, Saint Louis, MO
- Washington University in Saint Louis, Business School, Saint Louis, MO
OPEN ACCESS
PUBLISHED: 31 October 2025
CITATION Rahmani, B., Yu, T., et al., 2025. Risk Stratification of Clinically Isolated Syndrome for Multiple Sclerosis Development. Medical Research Archives, [online] 13(10). https://doi.org/10.18103/mra.v13i10.7011
COPYRIGHT: © 2025 European Society of Medicine. This is an open-access article distributed under the terms of the Creative Commons Attribution License, which permits unrestricted use, distribution, and reproduction in any medium, provided the original author and source are credited.
DOI https://doi.org/10.18103/mra.v13i10.7011
ISSN 2375-1924
Abstract
Multiple sclerosis is a chronic, immune-mediated neurological disorder affecting more than 2.8 million people worldwide. In approximately 85% of cases, the disease first presents as clinically isolated syndrome, an acute neurological episode with a variable risk of progressing to multiple sclerosis. Early identification of high-risk patients is critical for timely intervention. This study analyzes a cohort of 273 Mexican mestizo patients diagnosed with clinically isolated syndrome at the National Institute of Neurology and Neurosurgery in Mexico City between 2006 and 2010. We applied and compared multiple machine learning models including logistic regression, k-nearest neighbors, naïve Bayes, support vector machine, and random forest using demographic, clinical, and magnetic resonance imaging features to predict progression to multiple sclerosis. Among these models, the support vector machine with a radial basis function kernel achieved the highest accuracy (80.9%), while logistic regression provided interpretable insights into key predictors. Across models, magnetic resonance imaging findings particularly periventricular and spinal cord lesions emerged as the most influential predictors, with age also contributing to risk stratification. These results underscore the potential of machine learning to support early diagnosis, guide personalized treatment strategies, and improve outcomes for patients at high risk of developing multiple sclerosis.
Keywords
- Multiple Sclerosis
- Clinically Isolated Syndrome
- Machine Learning
- Risk Stratification
- Magnetic Resonance Imaging
1. Introduction
Multiple sclerosis (MS) is a chronic, immune-mediated disease of the central nervous system characterized by demyelination, axonal injury, and neurodegeneration, leading to progressive neurological disability. Its etiology involves a complex interplay of genetic, immunological, and environmental factors. According to the Atlas of MS 2020 report, over 2.8 million people are affected globally, with wide variations in prevalence and clinical presentation. Early diagnosis and intervention are associated with improved long-term outcomes.
A common initial presentation of MS is Clinically Isolated Syndrome (CIS), defined as a first episode of neurological symptoms lasting ≥24 hours, caused by inflammation or demyelination. CIS carries a variable risk estimated between 30% and 82%—of progressing to clinically definite MS. Conversion predictors of this conversion is essential for stratifying patients for early disease-modifying therapy (DMT) and clinical monitoring.
Several clinical and paraclinical features have been associated with increased conversion risk. MRI lesion burden and distribution—especially the presence of spinal cord lesions—are well-documented predictors. Advanced MRI features, such as lesion shape parameters, cortical lesion detection, and dynamic lesion activity, improve predictive accuracy beyond traditional McDonald criteria. Inflammatory biomarkers such as oligoclonal bands (OCBs) in cerebrospinal fluid (CSF), intrathecal IgM synthesis, neurofilament light (NfL) levels, glial fibrillary acidic protein (GFAP), and specific microRNAs have also been linked to early disease activity and prognosis. Disruption of the blood–brain barrier (BBB) measurable by MRI permeability mapping is another emerging marker.
Beyond traditional clinical and imaging predictors, machine learning (ML) and artificial intelligence (AI) methods have shown strong potential for improving prognostic modeling in CIS. Several recent studies have applied interpretable ML frameworks, highlighting key predictors such as MRI lesion features, OCBs, and evoked potentials. Classical models like support vector machines (SVM), random forests, and Naïve Bayes have demonstrated robust performance in small-to-moderate datasets, while boosting methods (XGBoost, CatBoost, LightGBM) have provided gains in predictive accuracy.
Deep learning approaches, particularly convolutional neural networks (CNNs), can extract high-dimensional features from MRI data and integrate them with clinical variables to enhance risk stratification. Explainable AI methods, including layer-wise relevance propagation, have been employed to improve model transparency and clinical trustworthiness. Integrating multimodal data—combining imaging, clinical, laboratory, and molecular information—has further improved predictive power in recent studies.
Importantly, these predictive models not only aid individual patient prognosis but can also inform targeted intervention strategies. For example, early identification of high-risk CIS patients could support initiation of high-efficacy DMTs, potentially reducing conversion rates and delaying disability progression. The integration of AI-driven tools with validated clinical biomarkers offers a promising path toward personalized treatment strategies in MS care.
Although deep learning often surpasses machine learning in several aspects, it demands substantial computational capacity and a colossal amount of data. Consequently, machine learning techniques remain highly effective and practical for crop yield prediction.
2. Data Description
This project utilizes a publicly available dataset of patients newly diagnosed with Clinically Isolated Syndrome (CIS), identified at the National Institute of Neurology and Neurosurgery (NINN) in Mexico City. The dataset comprises 273 records and 19 attributes, including demographic information, clinical symptoms, and diagnostic test results at the time of CIS determination. These patients were then prospectively followed to determine MS progression outcomes.
The data was imported using the panda’s library. Initial exploration involved examining the first few rows to understand the structure, reviewing column names, and inspecting data types. An unnecessary column labeled Unnamed: 0 a redundant index—was identified and removed. To assess data completeness, the number of missing values in each column was evaluated. Four columns Schooling, Initial Symptom, Initialers, and Finales contained missing values, with Initial EDSS and Final EDSS exhibiting significant gaps that warranted further attention.
The dataset was better understood by means of exploratory data analysis (EDA). Most patients were 20–40 years of age, according to a histogram of age (figure 1-left), which fits usual MS onset trends. Consistent with the greater frequency of MS among women, a count plot of gender showed a larger proportion of women in both MS and CIS groups. Notable variations between the two groups in MRI-related parameters suggested their relevance as predictors.
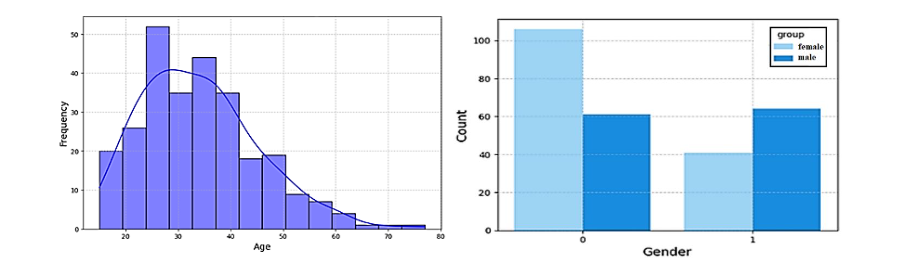
The histogram chart in figure 1-right shows the distribution of gender across the two groups: CIS (group 0) and MS (group 1). Female patients (gender 0) are more prevalent in both groups, reflecting the higher incidence of Multiple Sclerosis in women, a trend commonly observed in MS epidemiology. Male patients (gender 1) are comparatively fewer in both categories. This gender distribution highlights the importance of considering sex-based differences in MS progression studies.
The bar plots illustrate the distribution of MRI-related variables of Periventricular, Corticolimbic, Infratentorial, and Spinal Cord MRI across the two groups: CIS (group 0) and MS (group 1). In the Periventricular MRI variable, patients with positive findings (1) are significantly more common in the MS group, highlighting its potential as a predictor of MS progression. Similarly, positive findings in Corticolimbic and Spinal Cord MRI show a notable increase in the MS group compared to the CIS group. In contrast, Infratentorial MRI shows a more balanced distribution, with a slight increase in the MS group for positive findings. These distributions suggest that certain MRI findings, particularly in periventricular and spinal cord regions, may serve as key indicators for predicting the likelihood of progression from CIS to MS.
3. Methodology
3.1 MODEL SELECTION
We employed logistic regression as the initial model to predict the progression from Clinically Isolated Syndrome (CIS) to Multiple Sclerosis. This model assumes a linear relationship between the target variable (conversion to MS) and predictor variables such as age, gender, and MRI findings. After training the model on the training dataset, its performance was evaluated on the test dataset. The confusion matrix revealed 22 true positives and 20 true negatives, resulting in an overall accuracy of 76.36%.
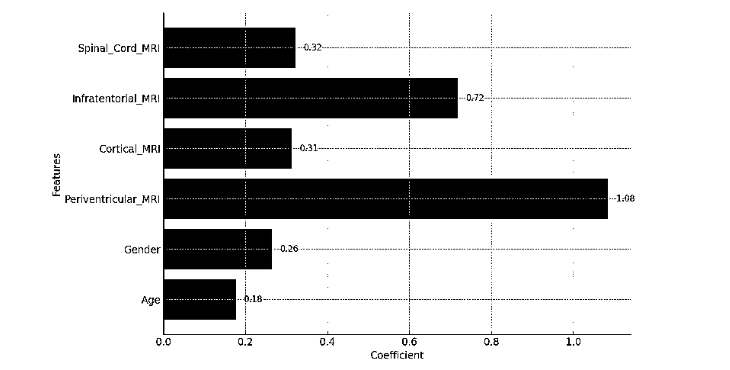
The model’s coefficients provided insights into the relative importance of each feature. Periventricular MRI emerged as the most influential predictor, followed by Spinal Cord MRI and Infratentorial MRI. In contrast, age and gender showed comparatively smaller effects. These findings underscore the critical role of MRI-based indicators in forecasting MS progression and demonstrate that logistic regression offers a simple yet effective baseline for predictive modeling in this context.
3.2 K-NEAREST NEIGHBOR
We implemented the K-Nearest Neighbors (KNN) classifier to evaluate its effectiveness in distinguishing between MS (Confirmed MS) and CIS patients. The model was trained using k = 5 neighbors and incorporated patient features such as age, gender, and MRI findings. KNN’s instance-based learning approach enables it to classify new observations based on the majority label of their nearest neighbors in the feature space.
3.3 NAÏVE BAYES
The Naïve Bayes classifier was applied due to its efficiency in handling probabilistic classification tasks, particularly with high-dimensional data. To aid interpretability and visualization, Principal Component Analysis (PCA) was performed to reduce the feature space to two dimensions. This dimensionality reduction allowed us to better observe the model’s decision boundaries and classification behavior.
3.4 SUPPORT VECTOR MACHINE
To further investigate classification performance, we implemented SVM models using four different kernel functions: linear, polynomial (poly), radial basis function (RBF), and sigmoid. Each kernel was chosen to assess the model’s capacity to capture varying degrees of data complexity. PCA was used to project the feature space into two dimensions for clear visualization of decision boundaries. The data was split into training and testing sets, and each SVM model was evaluated based on accuracy and decision surface characteristics. This comparative analysis allowed us to determine which kernel performed best in separating MS and CIS groups.
3.5 RANDOM FOREST
We applied the Random Forest classifier—an ensemble learning method that constructs multiple decision trees and aggregates their results to improve predictive performance and reduce overfitting. The model was trained using 100 estimators on a stratified split of the dataset into training and testing subsets.
Performance was assessed using accuracy, precision, recall, and F1-score metrics. An analysis of feature importance was conducted to identify the most influential predictors of MS progression. PCA was again used for dimensionality reduction, allowing visualization of the model’s decision boundaries. While Random Forest is well-suited for modeling non-linear relationships, we carefully examined its results to detect potential overfitting or reduced sensitivity in regions with sparse data.
4. Results
The results of this project focus on how various machine learning models like Logistic Regression, KNN, Naïve Bayes, SVM with different kernels, and Random Forest performed in classifying patients into MS (Confirmed MS) and CIS groups. We checked each model by looking at accuracy, precision, recall, F1-score, and we also visualized the decision boundaries to see how well they could predict outcomes.
4.1 LOGISTIC REGRESSION
Logistic Regression achieved an accuracy of 76.36%, providing a strong baseline for the classification task. The model’s coefficients highlighted Periventricular MRI as the most significant predictor of MS progression, followed by Spinal Cord MRI and Infratentorial MRI. The straightforward linear relationship assumed by Logistic Regression was effective in capturing the dataset’s patterns, making it a simple yet robust starting point for the analysis. The accuracy of the model is 0.7636.
| Predicted Positive | Predicted Negative | |
|---|---|---|
| Actual Positive | 22 | 8 |
| Actual Negative | 20 | 20 |
4.2 K-NEAREST NEIGHBOR
The KNN classifier achieved an accuracy of 70.91%, and its decision boundary indicates a dependence on nearby neighbors for making classifications. The model did a decent job overall, but there were a few misclassifications close to the boundary that held it back a bit.
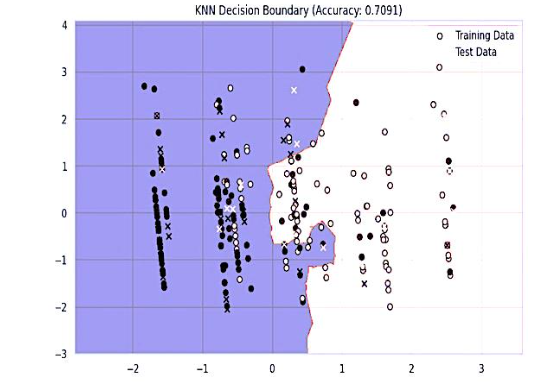
The decision boundary formed by the KNN classifier shows how the model divides the data into two distinct classes. We’ve got our training and test data points all plotted out, and we’re using different colors to show the predicted classifications. The boundary illustrates how the closest neighbors impact the definition of regions for each class. Even though the KNN model shows a distinct separation, there are a few misclassifications, especially around the boundary, which accounts for the moderate accuracy of 70.91%.
4.3 NAÏVE BAYES
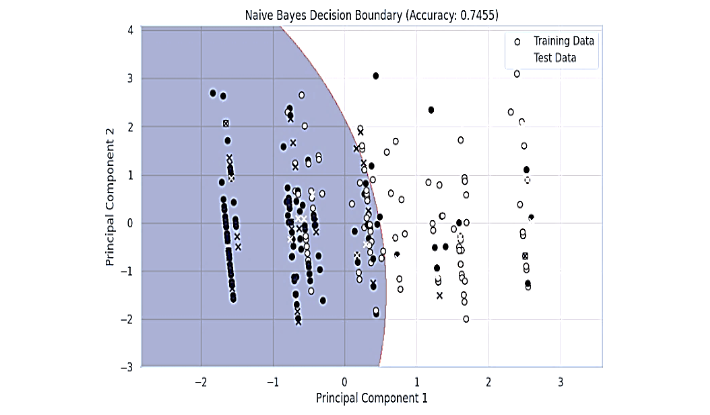
The decision boundary for the Naïve Bayes model reveals a smoother separation between the classes, reflecting the probabilistic nature of this algorithm. Training and test data points are plotted to visualize the model classification. The Naïve Bayes model appears to generalize the data better than KNN, as evident from fewer misclassified points near the boundary and its higher accuracy of 74.55%. This suggests that Naïve Bayes may be better suited for this dataset due to its ability to handle feature independence assumptions effectively.
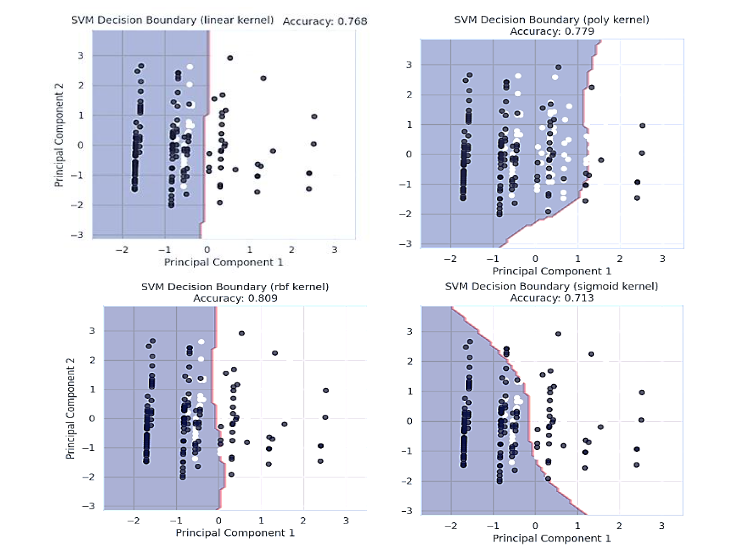
4.4 SVM ANALYSIS
Support Vector Machine models were implemented to classify patients into MS (Confirmed MS) and CIS groups using four different kernels: linear, polynomial (poly), radial basis function (rbf), and sigmoid. SVM is a powerful algorithm known for its ability to handle non-linear decision boundaries effectively by transforming data into higher-dimensional spaces using kernels. The model was trained and evaluated for each kernel, with accuracy scores ranging from 71.3% to 80.9%. Principal Component Analysis (PCA) was applied to reduce the dataset to two dimensions, enabling visualization of the decision boundaries for each kernel.
The decision boundary for the SVM model with a linear kernel illustrates a straight-line separation between the two classes (MS and CIS) based on the first two principal components. The model achieved an accuracy of 76.8%, demonstrating its ability to classify the data reasonably well. However, the boundary’s simplicity limits its effectiveness in capturing complex patterns, as evident from some misclassified points near the decision line. This result suggests that while the linear kernel is computationally efficient and works well for linearly separable data, it may not fully exploit the non-linear relationships present in the dataset.
The decision boundary for the SVM model using a polynomial kernel demonstrates a curved separation between the two classes (MS and CIS), successfully illustrating more intricate relationships within the data. This model achieves an accuracy of 77.9%, demonstrating a slight improvement over the linear kernel by managing overlapping regions more efficiently.
The curvature of the boundary emphasizes how the polynomial kernel can adjust to non-linear patterns within the dataset, enhancing its flexibility in differentiating between the two groups. The decision boundary for the SVM model with the radial basis function (RBF) kernel highlights its ability to handle non-linear relationships effectively. With an accuracy of 80.9%, this model outperforms both the linear and polynomial kernels, as it captures the complex patterns within the dataset. The smooth and adaptive boundary created by the RBF kernel shows its strength in distinguishing between the two classes (MS and CIS), even in regions where the data points are closely clustered. This performance makes the RBF kernel the most suitable choice for this dataset, particularly for modeling intricate and non-linear patterns in the features.
The decision boundary for the SVM model with the sigmoid kernel demonstrates a less distinct separation between the two classes (MS and CIS) compared to other kernels. The model achieved an accuracy of 71.3%, making it the least effective among the tested kernels. The sigmoid kernel struggles to generalize the data patterns, as evidenced by the uneven and less adaptive boundary. This suggests that the sigmoid kernel may not be suitable for this dataset, likely due to its limitations in handling non-linear relationships as effectively as the RBF or polynomial kernels.
4.5 RANDOM FOREST
The Random Forest algorithm was applied to classify patients into MS (Confirmed MS) and CIS groups. Random Forest is an ensemble learning method that builds multiple decision trees and aggregates their predictions for improved accuracy and robustness. The model was trained using 100 estimators and evaluated on the test set, achieving an accuracy of 69.09%. A classification report provided detailed performance metrics, including precision, recall, and F1-score, which were balanced across both classes.
The plot of importance derived from the Random Forest model highlights the relative contribution of each feature to the classification task. Age emerged as the most significant predictor, emphasizing its critical role in determining the likelihood of MS progression. Periventricular_MRI was the second most important feature, indicating the relevance of specific MRI findings in distinguishing between MS and CIS groups. Cortical_MRI and Infratentorial_MRI also showed moderate importance, further underscoring the significance of MRI-related features. Gender and Spinal_Cord_MRI had lower contributions, suggesting that while they provide some predictive value, their influence is relatively minor compared to the other variables. These insights align with the understanding that demographic and MRI-related factors are key indicators in predicting MS progression.
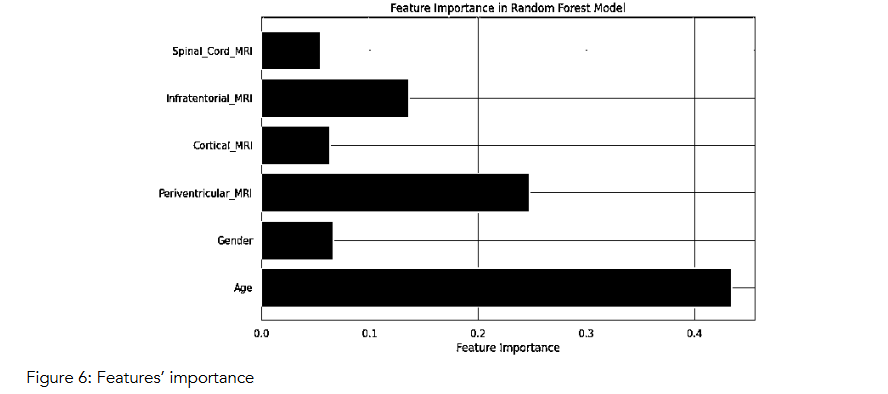
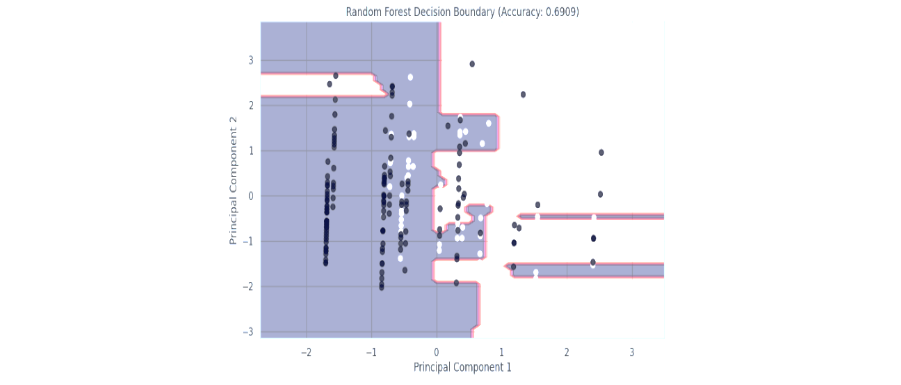
Figure 7: Random Forest Classifier
The decision boundary plot for the Random Forest model illustrates its classification performance using the first two principal components. The model creates a segmented and non-linear decision boundary, reflecting its ability to handle complex patterns in the data by aggregating decisions from multiple decision trees. Despite this, the model’s accuracy of 69.09% indicates limitations in generalizing to the test data, with several misclassifications evident near the boundary and in sparse regions. The intricate structure of the boundary suggests potential overfitting, as the model attempts to fit tightly around the training data points. This outcome highlights that while Random Forest excels in interpretability and handling feature interactions, it may require further tuning or complementary approaches for improved performance in this dataset.
5. Discussion
This study demonstrates the potential of machine learning models to identify early predictors of progression from Clinically Isolated Syndrome (CIS) to Clinically Definite Multiple Sclerosis. By analyzing demographic, clinical, and MRI-based features, we compared the performance of multiple classifiers and identified MRI findings, particularly periventricular and spinal cord lesions, as the most consistent predictors across models. The Support Vector Machine with a radial basis function (RBF) kernel achieved the best predictive accuracy (80.9%), aligning with prior reports that nonlinear models better capture complex patterns in early MS data. Our findings are consistent with recent explainable ML studies that also emphasize MRI lesions and inflammatory biomarkers as dominant risk factors for conversion.
Compared with prior deep learning approaches that require large imaging datasets and high computational resources, our models demonstrate that classical ML techniques remain effective and clinically interpretable. Logistic regression, while less accurate, highlighted feature importance in a way that facilitates clinician understanding and could foster trust in algorithmic support tools. This interpretability is a critical consideration for eventual implementation in clinical workflows.
From a clinical perspective, early identification of CIS patients at higher risk of conversion to MS could support proactive treatment decisions, such as the initiation of disease-modifying therapies (DMTs) or closer follow-up schedules. Such interventions have the potential to reduce long-term disability, improve quality of life, and decrease the overall healthcare burden. By offering a data-driven framework, our models could serve as decision-support tools that complement existing clinical guidelines and imaging criteria.
However, this study has several limitations. The dataset was derived from a single center and a relatively homogenous population (Mexican mestizo patients), which may limit generalizability. Important biological markers such as neurofilament light chain (NfL), oligoclonal bands (OCBs), and multi-omics data were not included, and their integration could substantially improve predictive accuracy. Additionally, some models such as Random Forest showed signs of overfitting, underscoring the need for careful tuning and validation.
Future work should prioritize external validation across larger and more diverse cohorts, integration of multimodal data (including molecular and genetic biomarkers), and exploration of deep learning architectures capable of handling raw imaging data. Importantly, explainable AI frameworks will be essential for ensuring that predictive models are transparent, clinically actionable, and aligned with physician decision-making processes.
6. Conclusion
In conclusion, this study highlights the value of machine learning models in predicting the progression from CIS to MS using routine clinical and imaging data. Among the models evaluated, SVM with an RBF kernel provided the highest predictive accuracy, while logistic regression offered clinically interpretable insights into feature importance. MRI-based features, especially Periventricular and Spinal Cord lesions, were consistently identified as strong predictors of disease progression. These findings reinforce the relevance of neuroimaging in early MS risk assessment and demonstrate the feasibility of using machine learning to support clinical decision-making.
The incorporation of such predictive tools into practice holds promise for advancing personalized medicine in neurology, allowing for earlier intervention and improved patient outcomes. Future work should focus on validating these models across larger, multi-center datasets and exploring the integration of longitudinal data and more advanced deep learning techniques. By doing so, we can further enhance the accuracy, generalizability, and clinical applicability of predictive algorithms in MS care.
| Model | Accuracy |
|---|---|
| Logistic Regression | 76.36% |
| K-Nearest Neighbor | 70.91% |
| Naïve Bayes | 74.55% |
| SVM (Linear) | 76.8% |
| SVM (Polynomial) | 77.9% |
| SVM (RBF) | 80.9% |
| SVM (Sigmoid) | 71.3% |
| Random Forest | 69.09% |
Conflict of Interest Statement: None.
Funding Statement: None.
Acknowledgements: None.
References
- Chavarria V, Espinosa-Ramírez G, Sotelo J, et al. Conversion predictors of clinically isolated syndrome to multiple sclerosis in Mexican patients: a prospective study. Arch Med Res. 2023;54(5):102843. doi: 10.1016/j.arcmed.2023.102843
- Daniel EC, Tirunagari S, Batth K, Windridge D, Balla Y. Interpretable machine learning for predicting multiple sclerosis conversion from clinically isolated syndrome. medRxiv. 2024. Preprint. doi:10.1101/2024.07.18.24310578
- Mato-Abad V, Labiano-Fontcuberta A, Rodríguez-Yáñez S, et al. Classification of radiologically isolated syndrome and clinically isolated syndrome with machine-learning techniques. arXiv. 2024. doi:10.48550/arXiv.2401.13301
- Luu MSK, Tuchinov BN, Prokaeva AI, et al. Machine learning model predicts CIS to MS conversion risk: study. Mult Scler Relat Disord. 2024. doi: 10.1016/j.msard.2024.105614
- Balnytė R, Matijošaitis V, Čelpačenko I, et al. Factors related to the progression of clinically isolated syndrome to multiple sclerosis: a retrospective study in Lithuania. Medicina. 2022;58(9):1178. doi:10.3390/medicina58091178
- Wottschel V, et al. Predictors of conversion to multiple sclerosis in patients with clinically isolated syndrome. Mult Scler Relat Disord. 2024. doi:10.1016/j.msard.2024.105614
- Zhang X, et al. Lesion shape features in MRI and random forest model predict CIS-to-MS conversion. J Neurol. 2018;265(3): doi:10.1007/s00415-018-8884-2
- Yoo Y, et al. CNN-extracted lesion features with clinical data for CIS to MS prediction. NeuroImage. 2020; doi:10.1016/j.neuroimage.2020.116508
- Probert F, et al. Multi-omics algorithm on CSF biomarkers for CIS-to-MS prediction. Neurobiol Rep. 2021; doi:10.1016/j.neurrep.2021.100045
- AccScience Team. Discovering predictive features of MS from CIS with ML. Artif Intell Health. 2024;1(4):107–122. doi:10.36922/aih.4255
- Norouziazad A, et al. Optimized DeepLabV3+ for clinical data analysis via particle swarm optimization. Phys Scr. 2024; doi:10.1088/1402-4896/abf3b8
- Saba T, et al. Enhancing trustworthiness with explainable AI framework for sclerosis detection. Phys Scr. 2024; doi:10.1088/1402-4896/abf3b8
- Torkildsen O, et al. Detection of varicella-zoster virus DNA during medullary and brainstem relapses in MS. Mult Scler J. 2016;22(4):XXX–XXX. doi:10.1177/1352458514568097
- Najafi S, et al. High prevalence of varicella zoster virus in relapsing-remitting MS: case–control study. J Clin Virol. 2016;doi:10.1016/j.jcv.2016.05.008
- Sombekke MH, et al. Spinal cord lesions in CIS: prognostic tool for MS. Neurology. 2013;80(8): doi:10.1212/WNL.0b013e31828c8a0e
- Liu Y, et al. CIS: a 3-year follow-up study in China. Clin Neurol Neurosurg. 2011;113(6): doi:10.1016/j.clineuro.2011.03.019
- D’Alessandro R, et al. Risk of MS following CIS: 4-year prospective study. J Neurol. 2013;260(6): doi:10.1007/s00415-013-7051-5
- Kohriyama T. Prognostic markers for CIS to MS and initiation of DMT. Rinsho Shinkeigaku (Jpn). 2011;51(4): doi:10.5692/clinicalneurol.cn-000000
- Scott TF, et al. Acute partial transverse myelitis with normal MRI: transition rate to MS. Mult Scler J. 2005;11(5): doi:10.1191/1352458505ms1163oa
- Compton A, Coles A. Multiple sclerosis. Lancet. 2008; 372(9648):1502–1517. doi:10.1016/S0140-6736(08)61620-7
- Lassmann H. Multiple sclerosis pathology. Cold Spring Harb Perspect Med. 2018;8(3):a028936. doi:10.1101/cshperspect.a028936 PMC
- MS International Federation. Atlas of MS. 3rd ed. 2020. doi:10.1007/978-3-030-38012-4 PMC
- Tozlu C, et al. Sequence of regional structural disconnectivity in MS. Brain Commun. 2023;5(1):fcad107. doi:10.1093/braincomms/fcad107
- Solomon AJ, et al. Differential diagnosis of suspected MS: consensus update. Lancet Neurol. 2023;22(1):35–45. doi:10.1016/S1474-4422(22)00393-3
- Rasouli S, et al. Predicting the conversion from clinically isolated syndrome to multiple sclerosis: an explainable machine learning approach. Mult Scler Relat Disord. 2024;86:105614. doi:10.1016/j.msard.2024.105614