

Simulating CTPA Images for Pulmonary Embolism Diagnosis
Computerized Tomography Pulmonary Angiography Image Simulation using Cycle Generative Adversarial Network from Chest CT imaging in Pulmonary Embolism Patients
Chia-Hung Yang1, Yi-Wei Chua1, Wen-Liang Lin1, Ching-Chun Huang2, Chin Kuo3,4, Yun-Chien Cheng1
- Department of Mechanical Engineering, College of Engineering, National Yang Ming Chiao Tung University, Hsin-Chu, Taiwan
- Department of Computer Science, College of Computer Science, National Yang Ming Chiao Tung University, Hsin-Chu, Taiwan
- College of Artificial Intelligence, National Yang Ming Chiao Tung University, Hsin-Chu, Taiwan
- Department of Oncology, National Cheng Kung University Hospital, College of Medicine, National Cheng Kung University, Tainan, Taiwan
ǂ The authors contributed equally to this work.
* Corresponding author
OPEN ACCESS
PUBLISHED 30 November 2024
CITATION Yang, C., Chua, Y., et al., 2024. Computerized Tomography Pulmonary Angiography Image Simulation using Cycle Generative Adversarial Network from Chest CT imaging in Pulmonary Embolism Patients. Medical Research Archives, [online] 12(11). https://doi.org/10.18103/mra.v12i11.5930
COPYRIGHT: © 2025 European Society of Medicine. This is an open-access article distributed under the terms of the Creative Commons Attribution License, which permits unrestricted use, distribution, and reproduction in any medium, provided the original author and source are credited.
DOI: https://doi.org/10.18103/mra.v12i11.5930
ISSN 2375-1924
ABSTRACT
This study primarily focused on developing a system to generate simulated computed tomography pulmonary angiography (CTPA) images for pulmonary embolism diagnosis and aiding medical practitioners gain a more intuitive understanding of the occurrence of pulmonary embolism (PE) in diagnosis. Compared to existing methods, this system provides a non-invasive and cost-effective way to identify patients with possible pulmonary embolism. The research methodology employed the use of CycleGAN architecture to simulate CTPA images and additional implement classifier modulus to enhance ability to restore pulmonary vessel features, using computed tomography (CT) images from 22 patients and their corresponding CTPA images as training data. The experimental and simulation results provide a new approach to clinical diagnosis, which can assist physicians in the complex screening process, allowing physicians to assess whether a patient needs to undergo detailed testing for CTPA, improving the speed of detection of PE and significantly reducing the number of undetected patients.
Keywords: Deep learning, Medical Images, Pulmonary embolism, Image generation, Generative Adversarial Network, Computer tomography, Pulmonary angiography
Introduction
Pulmonary embolism (PE) stands as a primary cause of vascular death. Its clinical symptoms are not very sensitive or specific and lack distinctive features, complicating the diagnosis process. Given the diverse triggers for PE, swift detection and treatment are crucial in substantially reducing mortality risks for hospitalized individuals.
Within the clinical diagnostic process, Computerized Tomography Pulmonary Angiography (CTPA) serves as the primary tool for detecting PE. This sophisticated Computerized Tomography (CT) scan produces intricate imagery of the pulmonary vasculature. To optimize clarity during the CTPA process, a contrast agent is introduced into the venous system, which then disperses into the pulmonary arteries. This agent accentuates the luminescence of the pulmonary vessels in CTPA images, allowing clinicians to accurately identify obstructions or blood clots that appear as attenuated areas. Although CTPA offers definitive insight into PE, it’s notably more expensive than a standard CT scan and the administered contrast poses potential risks to patients. Typically, the diagnostic procedure begins with a conventional CT scan or other clinical prediction such as X-ray, ECG (Electrocardiogram) and D-dimer measurement as shown in
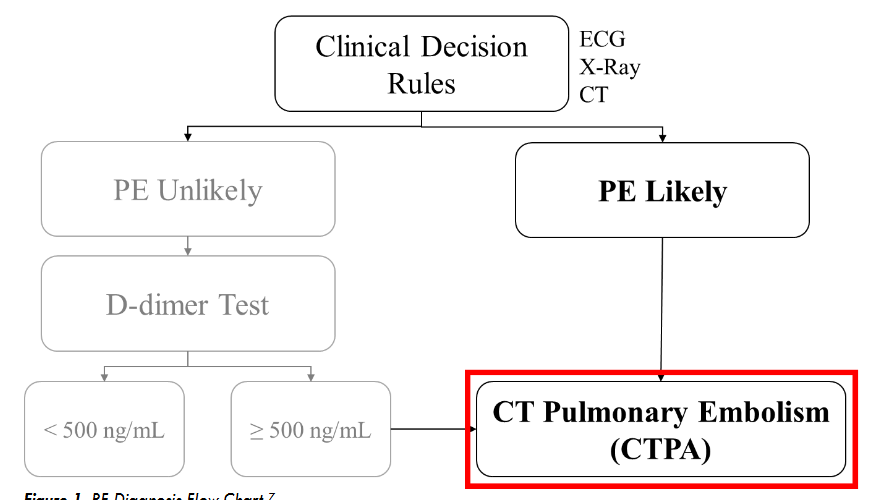
. Then, medical practitioners evaluate the CT images or evaluate clinical prediction reports for indications of PE. If PE is suspected, CTPA is typically performed to establish a definitive diagnosis.
Unfortunately, the sequential diagnostic process required before a CTPA can be conducted may extend beyond a week. Consequently, some patients who may have PE might experience complications or adverse outcomes due to delayed treatment.
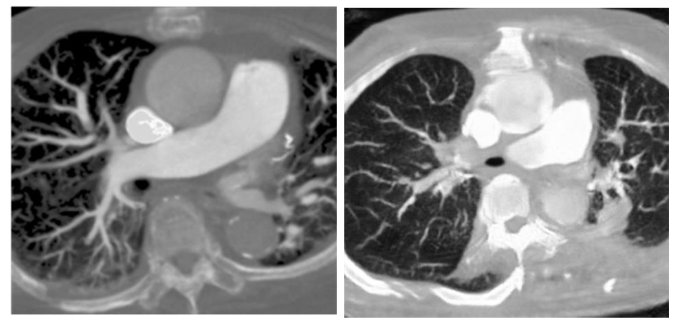
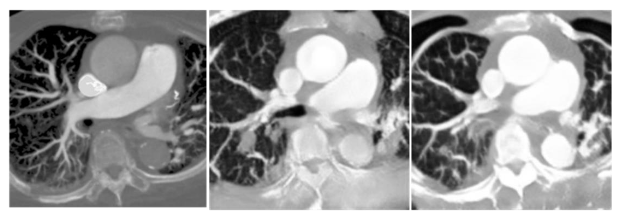
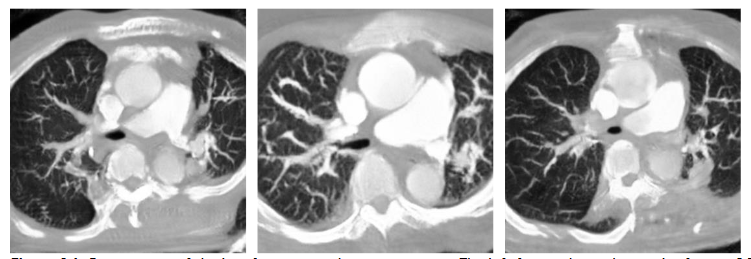
In previous research of our laboratory, it demonstrates that the deep learning model with hierarchical architecture can successfully distinguish CT scans with PE lesions and achieve high accuracy without using CTPA images, and indicates there are critical features on CT images for detecting PE. Previous proposed framework works in multiple stages on 3D lung CT scan images to detect and determine the malignancy of the nodules and also get the better result. That means CT scans have enormous potential for CT to CTPA translation. Much of the recent research employing deep learning methods for image-to-image translation has yielded significant improvements, aligning with the current trends in the field. For example, in medical imaging, the translation of images from Magnetic Resonance (MR) to Computed Tomography (CT) stands as a notable application of deep learning for medical image synthesis and continues to be one of the most frequently published topics in this domain. Since the main difference between CTPA image and CT image is the characteristic of the contrast agent, and both have similar cross-section shown in
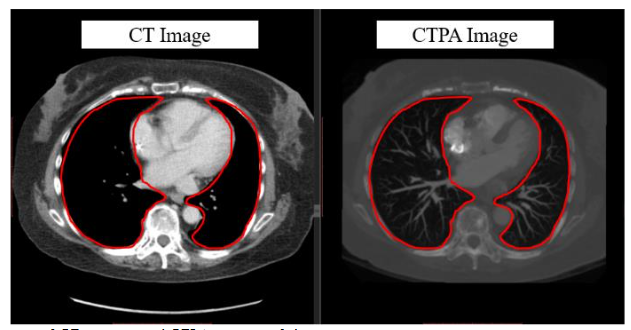
, we can regard CT to CTPA translation as an image style conversion task.
In medical image processing using deep learning research, Karim’s team proposed MedGAN, a Generative Adversarial Network (GAN) network applied to the medical imaging environment. Their implementation of GAN was explored across three distinct imaging scenarios: transforming positron tomography (PET) images into CT images, mitigating image blurring in magnetic resonance (MR) captures, and reducing noise in PET images. The primary objective of their method emphasizes enhancing contrast characteristics, positioning the generated images to primarily augment post-processing procedures rather than serving direct diagnostic purposes. Tein et al introduced an approach that integrates both CycleGAN and Deblur-GAN models with the aim of enhancing the quality of chest CBCT images. Their findings indicated that the Cycle-Deblur GAN framework not only augmented image quality and CT-value precision but also retained intricate structural details inherent in chest CBCT imagery. MR-CT registration is a common practice in head-and-neck radiotherapy, the process and results are not satisfactory due to the contrast differences between CT and MR images as well as the unavoidable patient non-rigid motion between scans, such as neck flexion, direct registration is challenging, especially with deformable variations. McKenzie et al. introduced a CycleGAN method to create synthetic CTs, simplifying MR-CT registration in the head and neck by turning an inter-modality issue into an intra-modality one. Considering the image translation methods for both aligned and unpaired datasets, Yan’s team introduced MMTrans, a Swin Transformer-based Generative Adversarial Network (GAN) designed for Multi-Modal Medical Image Translation. The results demonstrated that when applied to Magnetic Resonance (MR) images, MMTrans outperforms existing MRI image-to-image translation methods, showcasing significant potential for clinical application.
From the aforementioned literature, we can utilize the GANs for medical image-to-image translation tasks, change the style of the input images and highlight their specific features to achieve a certain degree of restoration in medical images. Motivated by these advancements, our study tries to leverage deep learning framework in synthesizing simulated CTPA images from CT scans to visualize the occurrence of PE. We established a simulation system based on CycleGAN architecture to generate simulated CTPA images from CT images for PE diagnosis, when compared to previous studies, additionally implements a classifier, which enhances the model ability to restore PE features. Moreover, we show the effectiveness of the classifier in discussion section.
With this simulation system, the clinician can obtain a CTPA simulation immediately after the CT image is taken, and can schedule a CTPA test directly if a pulmonary embolism is suspected from the simulated CTPA, reducing the treatment delay in the early diagnosis process. If the simulated CTPA image does not show PE-related features, the patient can continue to follow the original diagnosis procedure, reducing the patient’s risk of exposure to radiation in a single tomographic scan and reducing the harm to the patient from contrast injection.
The method we propose not only reduces the oversight of diagnosis of suspected PE cases or prevents the deterioration of patients already diagnosed with PE, but also the simulated CTPA images can be combined with many established PE computerized detection software (CAD) for PE diagnosis, further enhancing the accuracy of clinical diagnosis as shown in
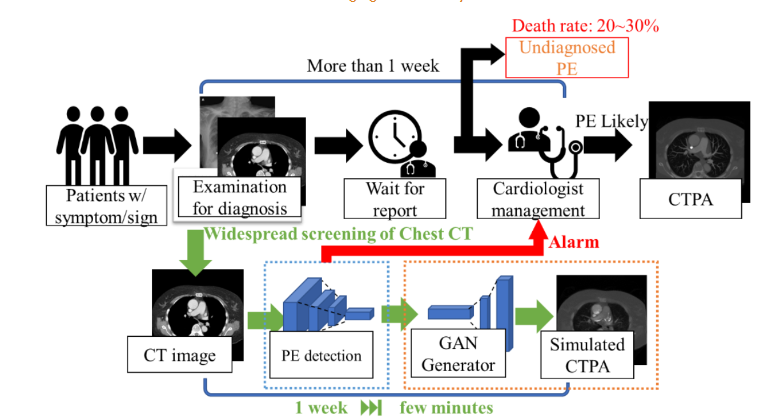
.
Materials and Methods
In the initial phase of our study, we focused on selecting an appropriate backbone architecture for the adversarial network model. We employed the Pix2pix architecture for the generation of CTPA images from CT scans, while also exploring the CycleGAN architecture for similar CTPA image synthesis. In the subsequent phase, we discussed the reason of choose due to concerns about the alignment of our image dataset not meeting the specifications required by Pix2pix and related architectures, we choose CycleGAN, which has capability to operate without the need for matching input and output images. We further delve into and discuss the nuances of this architecture in detail.
IMAGE SOURCES
In the initial pre-experimental phase, we evaluated 50 patients from National Cheng Kung University Hospital who did not have pulmonary embolism, establishing the foundation of our selection framework. Subsequently, in the second phase, we analyzed a dataset from the same hospital, consisting of 22 patients diagnosed with pulmonary embolism. Both datasets were obtained from National Cheng Kung University Hospital and were reviewed by the Human and Behavioural Research Ethics Board of National Cheng Kung University School of Medicine (IRB No: B-ER-108-380). CT images and CTPA images were taken in these patients during diagnosis. Since there were some coordinate shifts and differences in slice detail between the CT and CTPA images, we used Velocity AI software to align the CT images with the coordinates of the CTPA images on the patient images without pulmonary embolism. However, we found that using image processing software to align the target images was equivalent to passing through another layer of simulation, and this simulation could not faithfully represent the original cross-sectional images.
DATA PREPROCESSING
In the first phase of the pre-experiment, we processed the images by dividing the DICOM image files into CT and CTPA as the input and output of the generation counterpart network and converted the images into JPEG files for easy observation. We compressed the original image resolution from 512×512 to 256×256 to increase the learning capability of the model. In the second phase of the dataset, we utilized DICOM file format images directly as input. We selectively chose image intervals featuring pulmonary embolism as both training input and target, aiming to focus the model’s attention on simulating regions associated with pulmonary embolism in the CT images.
FIRST PHASE CTPA_PIX2PIX MODEL
Our initial model is a variant of the Pix2pix architecture, leveraging U-Net as the generator network and employing two distinct discriminator networks for assessment: a Pixel Discriminator for pixel-level scrutiny and a 3-layers Discriminator for distinguishing output image characteristics, as illustrated in
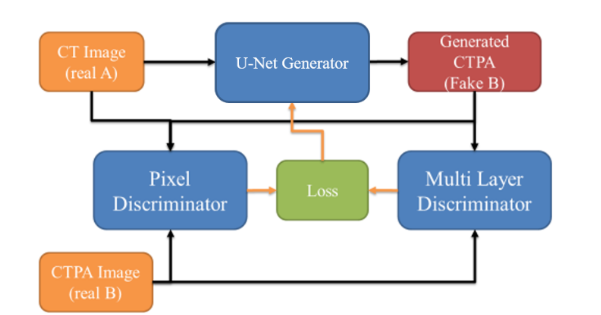
. Patient CT images and corresponding CTPA images are paired and fed into the network jointly. CT images are fed into the U-Net generator network to produce simulated CTPA images, while the discriminator network discerns disparities between simulated CTPA images and input CT images, feeding back results to the generator network for subsequent training cycles.
CTPA_CycleGAN MODEL
Since the main difference between CTPA image and CT image is the characteristic of the contrast agent, and its characteristic can be regarded as a style conversion, we try to use the CycleGAN architecture to solve this problem. We use two mirroring generator networks, as shown in
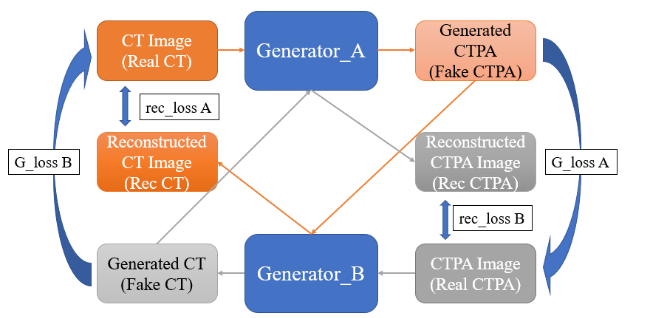
. Generator network A is the network that converts CT images to CTPA images, and generator network B is the network that converts CTPA images back to CT images. First, the CT images are imported into the generator network A to form the simulated CTPA images, which are first evaluated by a discriminator network for their style conversion, and then imported into the generator network B to convert the simulated CT images back to the original input images for comparison. On the other hand, the CTPA images are input into the generator network B to generate the simulated CT images, and after judgment, they are sent to the generator network A to convert the simulated CTPA images and then compared with the original input CT images.
In view of the complexity of the image features that Cycle GAN may need to learn, this study uses the U-Net and ResNet architectures to test the CycleGAN generator network architecture respectively.
Second Phase
PULMONARY EMBOLISM CLASSIFICATION CYCLEGAN
Since we found in the first phase of experiments that aligning images is equivalent to generating a substandard simulation result as the target for generative adversarial network learning, we chose CycleGAN, which does not require image matching, as the backbone of our network.
In this phase of the experiment, we first tested the simulation of CTPA images using the original files in DICOM format as the input images. However, the DICOM format file covers a wide range of image values, which makes the model learning results not focus on the PE features of the pulmonary vasculature.
Therefore, we added a supervised neural network to the original CycleGAN to interpret the reconstructed CT images to see if they are images of pulmonary embolism, and to use this network to interpret these images as images of pulmonary embolism. In this way, our generative adversarial network can generate simulated CTPA images that are closer to those with pulmonary embolism features. The designed architecture are shown in
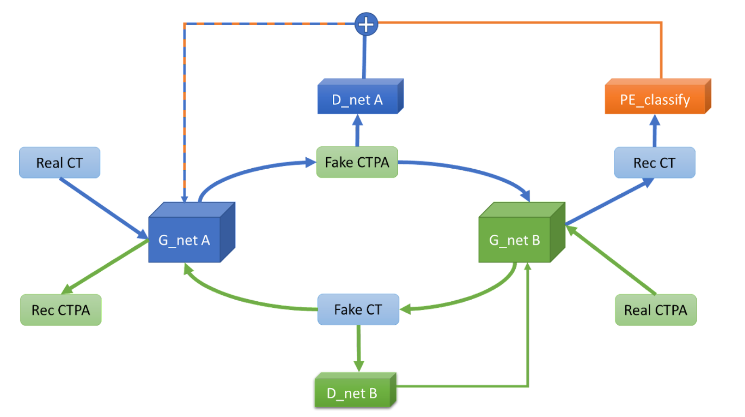
.
Although the generated images are closer to the real CTPA images after adding the Pulmonary Embolism Recognition Network to the generative adversarial model for supervision, the CTPA image format is partially different from the CT image format, which is prone to structural deformation without pre-processing and alignment. We speculate that the main reason for this deformation is that our loss function uses Binary Cross Entropy loss (BCE loss) as the loss function of the generator and L1 loss as the loss function of the discriminator, and both loss functions are computed on a pixel-by-pixel basis. To solve this deformation problem, we try to use the structural similarity index (SSIM) as the discriminator loss function to increase the degree of network restoration to the structure and reduce the image caused by pixel deviation. We also try to use Mean absolute error (MSE) as the loss function of the generator to reduce the pixel deviation as well.
EVALUATION METHOD
Since the purpose of this experiment is to generate different types of medical images for conversion, there are no related studies, so this experiment will design a method to evaluate the results of our model generation. We hope that the model output images are as close to the original CTPA images as possible, so we want to observe the following objectives: image generation quality, structural similarity, and image similarity. Since the generated images are expected to have less noise, we use the peak signal-to-noise ratio (PSNR) as a metric to evaluate the quality of the generated images. For PE, the structure of blood vessels is an important criterion, and we use the structural similarity index (SSIM) as the evaluation criterion to select the result that can best restore the structure. For image similarity, we will use the general image generation evaluation methods such as depth perception image similarity (LPIPS) and Fréchet Inception Distance (FID), and then calculate the mean absolute error (MAE) pixel by pixel to make a comprehensive evaluation.
- Peak Signal-to-Noise Ratio (PSNR) PSNR is a quantitative index used to evaluate the distortion of an image. the result of PSNR represents the ratio of the maximum possible signal power to the destructive noise power and is defined as follows:
MSE = 1/(m*n) * Σ (i=0 to m-1) Σ (j=0 to n-1) [I(i,j) - K(i,j)]^2
PSNR = 10 * (MAXI^2 / MSE)
If the size of both the generated image and the original image is m×n, and I is the original image and K is the generated image, the mean square error (MSE) of the two images can be obtained. In general, it is difficult to distinguish the difference between PSNR>30 and PSNR between 20 and 30, so that some difference can be felt. If the PSNR is between 10 and 20, it is obvious that there is noise, but the similarity of the two images can still be seen. If the PSNR is below 10, it is difficult for the human eye to determine the similarity of the images.
- Structural Similarity Index (SSIM) SSIM is similar to PSNR in that it is also an indicator of the quality of image production. However, unlike PSNR, SSIM places more emphasis on structural information. In a natural image, there should be a strong correlation between adjacent pixels, and such a correlation can express the structural information in the image scene. Therefore, SSIM is defined as follows:
SSIM(x, y) = [l(x, y)]^α * [c(x, y)]^β * [s(x, y)]^γ
l(x, y) = (2*μx*μy + C1) / (μx^2 + μy^2 + C1)
c(x, y) = (2*σx*σy + C2) / (σx^2 + σy^2 + C2)
s(x, y) = (σxy + C3) / (σx*σy + C3)
In SSIM, three parameters are evaluated: luminance l(x,y), contrast c(x,y) and structure s(x,y), with C_1, C_2 and C_3 as constants. If two identical images are computed by SSIM, it will get 1. Therefore, the closer the SSIM index is to 1, the higher the similarity of the two images.
- Deep Image Perception Similarity (LPIPS) For the human eye, it is easy to quickly evaluate the perceptual similarity between two images, but this evaluation process is not well quantified. The human eye does not evaluate the similarity of two images on a pixel-by-pixel basis. After the significant application of neural networks in recent years, Richard Zhang et al. found in 2018 that it is useful to extract feature maps of shapes through VGG networks as a basis for image judgment, and therefore proposed a new evaluation method, LPIPS, to systematically compare the deep features in different images. LPIPS is calculated by inputting two images to a VGG network, obtaining the vector map of the specific convolutional layer of the two images in the VGG network and calculating the remaining chordal distances, and then averaging these distances to obtain the LPIPS score.
- Fréchet Inception Distance (FID) FID is a common evaluation method for GAN image generation, which calculates the distance between the real image and the feature vector of the generated image as an indicator of the quality of the image generation. The FID score uses the classification model of Inception v3 and takes the last pooling layer as the feature map for evaluation, and by calculating the mean and standard deviation between these image feature maps, the target image and the generated image are generated as a set of After calculating the mean and standard deviation between these image feature maps, a Gaussian distribution is generated for the target image and the generated image, and the distance between these two distributions is calculated by the Wasserstein-2 method. Therefore, the FID score should be 0.0 in the best case, which means that the distributions of the two sets of images are exactly the same.
Results
FIRST PHASE – GENERATING CONTRASTIVE MODEL ARCHITECTURES FOR COMPARISON
We first exported and compared the results generated by the unmodified model after 1500 epochs of training. We tested the CT images of the patients and their matching CTPA images with independent untrained images, and only the trained generation network was used as the network for image generation.
The results of the CTPA_Pix2pix model are shown in
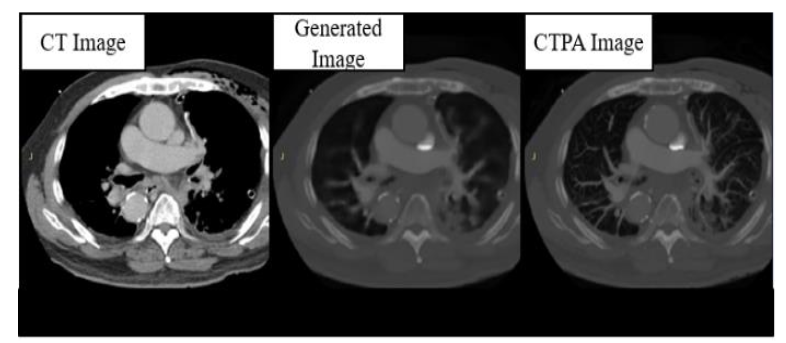
. We can find that the images generated by the generator perform well in the reproduction of bones and organs, with little error from the real images, but are relatively blurred in the judgment of the PE block, except for the thicker arteries and veins, and the vessels of the lungs are very poorly imaged.
In the CTPA_CycleGAN model, as shown in
, we used U-Net and ResNet as the backbone of the network for training, and we can see that the performance on U-Net is not as good as expected, although the restoration performance on bones and organ tissues is excellent as in the CTPA_Pix2pix model, but the microvascular part of the lungs The generation of the lung microvasculature was different. In the CTPA_CycleGAN model (U-Net), the amount of vessel restoration was improved, but the main pulmonary artery was not generated, making the vascular trend different from reality and making it difficult to identify the symptoms of PE.
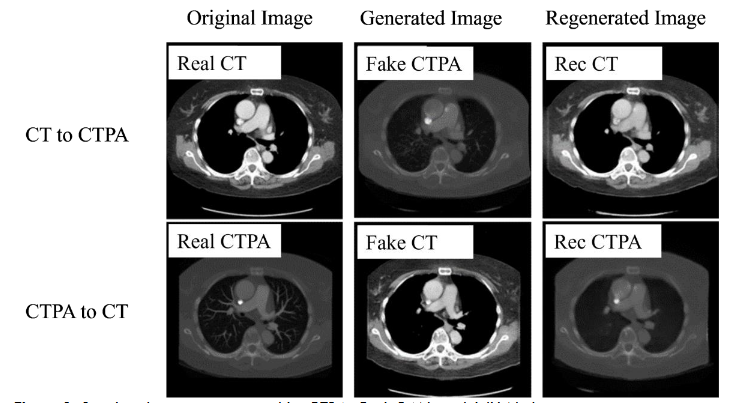
In the generation results of CTPA_CycleGAN model (ResNet), as shown in
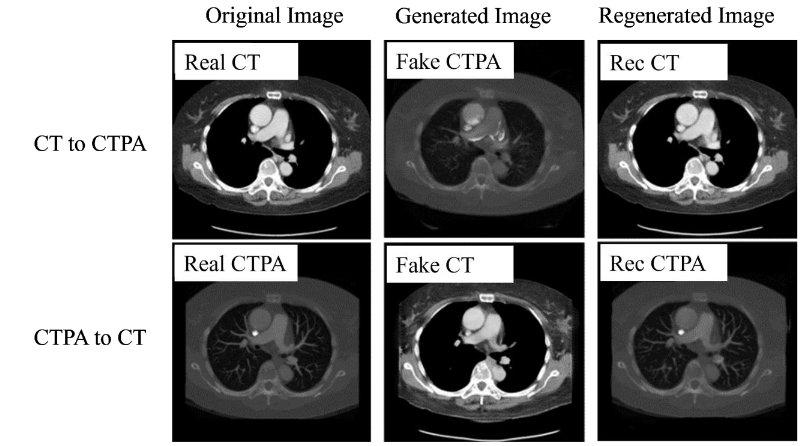
, we can find that the simulated CTPA image Fake_B generated by generator A has a high degree of similarity to the real CTPA image Real_B, and the vascular imaging is also the best among all models. A point that is worth discussing is the Rec_B image, which is a simulated CTPA image generated by the CTPA image through generator network B and then generated by generator network A. Its similarity to Real_B is even higher than that of Fake_B, and there is almost no difference with the original image.
SECOND PHASE – RESULTS OF CYCLEGAN MODEL SUPERVISED WITH PULMONARY EMBOLISM CLASSIFIER
In the comparison of generative adversarial model architectures, we can find that CycleGAN performs the best in the task of converting CT images to CTPA images, and in clinical applications, CT images without imaging software simulation will not have corresponding CTPA images to be used as the generated target. Therefore, the DC GAN and Pix2pix architectures, which must use control sets, cannot be used as the generative adversarial network architecture for this experiment. For these two reasons, we decided to use CycleGAN as the backbone network architecture for CT generation simulation of CTPA. In this section, we will investigate the differences in the output results of different adaptations and modifications of CycleGAN and the reasons for them. Since most of the models we evaluate are pixel-based, we first fine-tune the coordinates and dimensions of the output images to align them with the original images when evaluating the generated images.
In the generated results in
, we can see that the generated model reproduces the vascular vein as much as possible, but there are still many differences that are visible to the naked eye, and we will discuss how the model is adjusted later. As detailed in
| Stimulated CTPA Metrics | Desired Metric Outcomes |
|---|---|
| PSNR | 11.24 Higher is better; >30dB is desirable for high image quality. |
| SSIM | 0.324 Closer to 1 indicates higher structural similarity to the target image |
| MAE | 102.13 Lower is better; indicates less deviation from the target image |
| LPIPS | 0.439 Lower is better; indicates higher perceptual similarity to the target image. |
| FID | 223.68 Lower is better; indicates closer distance to target image features. |
.
Discussion
We compared CycleGAN networks with different generators and found that the performance of the generated results on ResNet was significantly better than that on U-Net, and the reconstruction loss and generator loss were both better than those on U-Net. In terms of reconstruction loss, the deeper ResNet50 performs better than ResNet9. The loss function represents the ability to restore the graphs, and the source of comparison is the original graph and the graphs restored by two layers of generators. It can be assumed that this generative feature is more diverse and therefore more complex networks can be considered as generator networks in the future. However, the more complex network may be relatively difficult to train in an adversarial way, so we plan to pre-train it by classifier first, and then place it into the generative adversarial network for optimization.
First, we input the original DICOM images for the first training, and found that the CT values of each pixel in the DICOM file were too widely distributed, which caused the model output to fail to focus on the PE features. Since our goal is to detect PE, we try to pass the input images through a HU filter first, and keep the relevant CT values of lungs and blood vessels into the model to enhance the model’s ability to restore PE features. In addition, since CycleGAN is an unsupervised adversarial generative neural network, we believe that if we can add a pre-trained classification network for PE features in its discriminator, it can enhance its ability to restore PE features. In
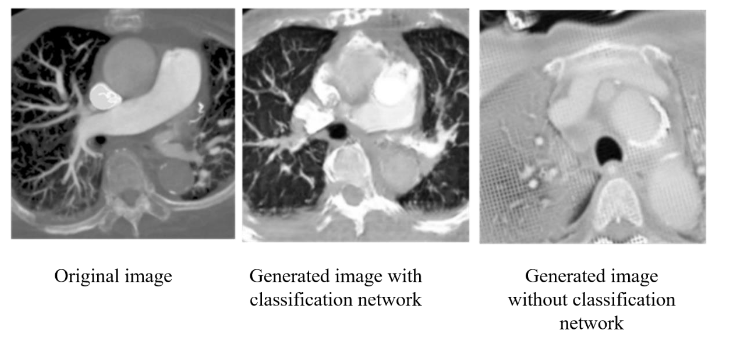
, we can see that with the addition of the classification network, CycleGAN can focus more on the vascular features and lung regions for reproduction, and the overall image similarity is greatly improved. In each of the image evaluation indexes (
| Classification model | Without classification model |
|---|---|
| PSNR | 11.227 |
| SSIM | 0.325 |
| MAE | 96.9 |
| LPIPS | 0.494 |
), we can see that the generated network with the addition of the classification model not only has less noise and higher structural similarity, but also has improved the overall image style similarity.
In the second stage, we compare the weights of the loss returned to the generator by the classification network and CycleGAN. We find that if the returning weight of the classification network is too high, the generated image will easily resemble the feature map of the classification network due to the lack of the adjudicator to monitor the quality of the generated image. Therefore, we multiply the categorical network return value by a weight to reduce its image quality, but still retain the ability to monitor the PE features. From
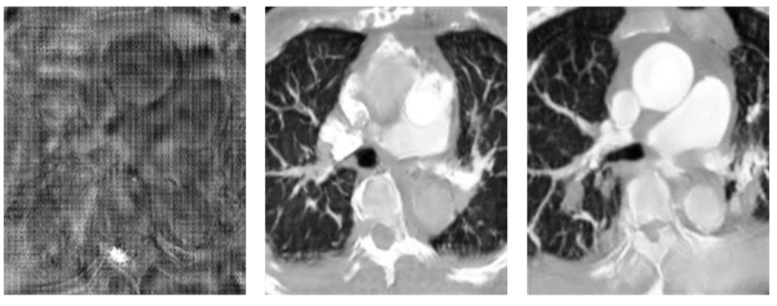
, we can find that a weight between 0.1 and 0.3 results in the best image restoration ability, and from the values in
| Ratio | PSNR | SSIM | MAE | LPIPS |
|---|---|---|---|---|
| 1 | 11.19 | 0.116 | 122.72 | 0.540 |
| 0.3 | 11.227 | 0.325 | 96.9 | 0.494 |
| 0.1 | 11.23 | 0.304 | 96.38 | 0.428 |
, we can see that as the weight decreases, the structural similarity is lost due to the decrease in the requirement for PE features, and the rest of the values do not differ significantly.
In adversarial generative networks, the discriminator is also an important basis. If the discriminator is too powerful, the generator may not learn easily. Therefore, we try to balance the learning ability of generators and discriminators, but due to the hardware limitation, our experimental platform cannot handle such a huge computation if the generators are deeper, so we fix the generator as ResNet34 and adjust the number of layers of discriminators to achieve a balance in training. In this experiment, we tested the discriminators of three-, four-, and six-layer NNs, and we found that the discriminator with six layers was too fast to learn the convergence of the generative network, so we only compared the results of the three- and four-layer discriminators. As shown in
and
| Target CTPA | 3-layers | 4-layers |
|---|---|---|
| PSNR | 11.23 | 11.25 |
| SSIM | 0.304 | 0.276 |
| MAE | 96.38 | 97.31 |
| LPIPS | 0.428 | 0.459 |
, we believe that the combination of the three-layer discriminator and ResNet34 is the most suitable for the CT to CTPA conversion task.
After adjusting the main model structure, we found out that the generated model tended to enlarge the simulated image due to the size difference between the CT image and the CTPA image in the original format. This action caused distortion of the image structure. Therefore, we adjusted the loss function calculation of the generator and the discriminator respectively. In the discriminator, we replaced the L1 loss by SSIM to increase the discriminator’s requirement for the image structure, while in the generator, we tried to use MSE to complement the pixel-to-pixel similarity. From
and
| BCE+L1 | BCE+SSIM | MSE+SSIM |
|---|---|---|
| PSNR | 11.24 | 11.25 |
| SSIM | 0.309 | 0.171 |
| MAE | 96.84 | 106.76 |
| LPIPS | 0.479 | 0.510 |
, we can find that the use of SSIM as the discriminator alone will cause the degradation of the generated image quality.
Conclusion
In our study, we demonstrated that CT images can be generated by using a generative network to produce CTPA images, with most bones, organs, and body structures being accurately reproduced. Generation ability is not as expected. In CTPA_CycleGAN, the model with ResNet as the skeleton can enhance the generation of microvessels, but the microvessels are not derived from the thicker major vessels but directly from the cavities when generating microvessels. After adding the PE classifier, our proposed PE classification CycleGAN can generate simulated CTPA images from CT images more accurately. The current image generation results can still be improved in two directions. First, the number and diversity of training data can be increased by adding datasets from different hospitals and different regions, so that the model can learn more different pulmonary embolism features and lung regional structural features to increase the ability of the model to restore images. In addition, the output image results still need to be tested clinically in the hospital, and the resulting images will be interpreted by the physicians to observe whether the symptoms of pulmonary embolism can be successfully detected, and then the model structure will be further adjusted to generate simulated images with more reference value for clinical judgment.
Statements and Declarations
AUTHOR CONTRIBUTIONS STATEMENT
The authors’ contributions are as follows: CK, YCC, CCH conceptualized, conceived and designed the experiments. CK collected the data and CHY performed the analysis. YCC provided the facilities and grants necessary and finalized the manuscript. CK, YCC and CCH supervised the entire research project. CK, YCC and CCH analyzed and interpreted the data. YWC and WLL provided assistance in revising the paper and discussing the research. CHY, CK, and YCC contributed data or analysis tools and wrote the paper.
COMPETING INTERESTS STATEMENT
The authors declared that the research have NO affiliations with or involvement in any organization or entity with any financial interest (such as honoraria; educational grants; participation in speakers’ bureaus; membership, employment, consultancies, stock ownership, or other equity interest; and expert testimony or patent-licensing arrangements), or non-financial interest (such as personal or professional relationships, affiliations, knowledge or beliefs) in the subject matter or materials discussed in this manuscript.
DATA AVAILABILITY STATEMENT
Due to the sensitive nature of the data involving human participants and ethical restrictions, CT and CTPA datasets are not publicly available to preserve individuals’ privacy under the National Cheng Kung University Hospital and were reviewed by the Human and Behavioural Research Ethics Board of National Cheng Kung University School of Medicine (IRB No: B-ER-108-380). However, data are available from the corresponding author upon reasonable request and with appropriate ethical approval.
ETHICAL APPROVAL
This study has received ethical approval from Human and Behavioural Research Ethics Board of National Cheng Kung University School of Medicine (IRB No: B-ER-108-380, Date: 2019/Dec/10). All participants signed an informed consent form prior to the commencement of the study, in accordance with IRB guidelines and ethical standards. To protect participant privacy, all data were de-identified prior to analysis. This research adheres to all applicable national and international ethical guidelines.
CONSENT TO PARTICIPATE
Written informed consent was obtained for anonymized patient information to be published in this article.
CONSENT TO PUBLISH
This study adheres to the ethical standards of Human and Behavioural Research Ethics Board of National Cheng Kung University School of Medicine and follows the guidelines provided by the journal. Written informed consent was obtained from all participants for the publication of anonymized information. No organs or tissues were procured from prisoners, and all procedures involving human participants were performed in accordance with the ethical standards laid down in the 1964 Helsinki declaration and its later amendments.
References
- Righini M, Robert‐Ebadi H, Le Gal G. Diagnosis of acute pulmonary embolism. Journal of Thrombosis and Haemostasis. 2017;15(7):1251-1261.
- Goggs R, Benigni L, Fuentes VL, Chan DL. Pulmonary thromboembolism. Journal of Veterinary Emergency and Critical Care. 2009;19(1):30-52.
- Stein PD, Sostman HD, Hull RD, et al. Diagnosis of pulmonary embolism in the coronary care unit. The American journal of cardiology. 2009;103(6):881-886.
- Apfaltrer P, et al. CT Imaging of Pulmonary Embolism: Current Status. Current Cardiovascular Imaging Reports. 2011:4.6: 476-484.
- Page P, et al. Effectiveness of managing suspected pulmonary embolism using an algorithm combining clinical probability, D-dimer testing, and computed tomography. Jama 2952 (2006). 2006:172-179.
- Migneault D, et al. An unusual presentation of a massive pulmonary embolism with misleading investigation results treated with tenecteplase. Case reports in emergency medicine. 2015;
- Huisman MV. Effectiveness of managing suspected pulmonary embolism using an algorithm combining clinical probability, D-dimer testing, and computed tomography. JAMA: Journal of the American Medical Association. 2006;295(2)
- Sang J, Alam, M. S., & Xiang, H. Automated detection and classification for early stage lung cancer on CT images using deep learning. In Pattern recognition and tracking XXX2019. p. (Vol. 10995, pp. 200-207). SPIE.
- Armanious K, et al. MedGAN: Medical image translation using GANs. Computerized Medical Imaging and Graphics 79. 2020:101684.
- Goodfellow I, et al. Generative adversarial nets. Advances in neural information processing systems 27. 2014;
- Tien H-J, et al. Cone-beam CT image quality improvement using Cycle-Deblur consistent adversarial networks (Cycle-Deblur GAN) for chest CT imaging in breast cancer patients. Scientific Reports 111. 2021:1-12.
- McKenzie EM SA, Ruan D, O’Connor D, Cao M, Sheng K. Multimodality image registration in the head‐and‐neck using a deep learning‐derived synthetic CT as a bridge. Med Phys 2019. 2019:47:1094–1104.
- Yan S, Wang, C., Chen, W., & Lyu, J. Swin transformer-based GAN for multi-modal medical image translation. Frontiers in Oncology2022. p. 12, 942511.
- Radford A, Metz L, Chintala S. Unsupervised representation learning with deep convolutional generative adversarial networks. arXiv preprint arXiv:151106434. 2015;
- Zhu J-Y, Park T, Isola P, Efros AA. Unpaired image-to-image translation using cycle-consistent adversarial networks. 2017:2223-2232.
- Ronneberger O, Fischer P, Brox T. U-net: Convolutional networks for biomedical image segmentation. Springer; 2015:234-241.
- Hore A, Ziou D. Image quality metrics: PSNR vs. SSIM. IEEE; 2010:2366-2369.
- Zhang R, Isola P, Efros AA, Shechtman E, Wang O. The unreasonable effectiveness of deep features as a perceptual metric. 2018:586-595.
- Heusel M, Ramsauer H, Unterthiner T, Nessler B, Hochreiter S. Gans trained by a two time-scale update rule converge to a local nash equilibrium. Advances in neural information processing systems. 2017;30