


Time Series Analysis of VGLUT1-pH in Rat Neurons
Time Series Analysis of VGLUT1-pH Fluorescence in Rat Hippocampal Neurons
Bahareh Rahmani ¹, Shawd Nusier ¹, Mukta Rani ¹, Fnu Mehtab Farozan Khatoon ¹, Brandon Tabman ¹, Payam Norouzzadeh ², Ghazaleh Ashrafi ³, Eli Snir ⁴
¹ Saint Louis University, School of Medicine, Saint Louis, MO
² Saint Louis University, Professional Studies, Saint Louis, MO
³ Washington University in Saint Louis, School of Medicine, Saint Louis, MO
⁴ Washington University in Saint Louis, Olin Business School, Saint Louis, MO
OPEN ACCESS
PUBLISHED: 31 July 2025
CITATION Rahmani, B., et al., 2025. Time Series Analysis of VGLUT1-pH Fluorescence in Rat Hippocampal Neurons. Medical Research Archives, [online] 13(7). https://doi.org/10.18103/mra.v13i7.6764
COPYRIGHT © 2025 European Society of Medicine. This is an open-access article distributed under the terms of the Creative Commons Attribution License, which permits unrestricted use, distribution, and reproduction in any medium, provided the original author and source are credited.
DOI: https://doi.org/10.18103/mra.v13i7.6764
ISSN 2375-1924
ABSTRACT
This project uses the vesicular glutamate transporter 1-pHluorin fluorescent reporter to examine synaptic vesicle release in rat hippocampus neurons. The primary objective is to evaluate time series data of mean fluorescence intensity measurements taken before and after stimulation in a neuroscience experiment across different regions of interest, identifying underlying patterns in the data by building autoregressive integrated moving average models. The methods aim to reveal patterns within the data by using decomposition analysis to understand hidden trends, seasonal fluctuations, and relationships between fluorescence intensity metrics. Results demonstrate notable seasonal patterns and temporal dependencies, indicating that Seasonal Autoregressive Integrated Moving Average models are necessary to analyze electrically stimulated neuronal activity.
Keywords
VGLUT1-pH, fluorescence, rat hippocampal neurons, time series analysis, ARIMA, SARIMA, synaptic vesicle release
1. Introduction
The study of synaptic vesicle release is fundamental to understanding neuronal communication and synaptic plasticity. The use of fluorescent reporters such as VGLUT1-pH has enabled researchers to monitor synaptic vesicle dynamics with high spatial and temporal resolution. The primary objective of this study is to analyze time series data of fluorescence intensity in response to electrical stimulation in rat hippocampal neurons, employing ARIMA and SARIMA models to reveal underlying patterns and dependencies in synaptic activity.
The brain of all vertebrates and most invertebrate species serves as their central nervous system. Despite substantial anatomical and functional differences, research has shown that rats are useful models for understanding human brain function due to the large number of similarities. While humans have a highly developed prefrontal cortex that is responsible for executive function and decision-making, particular to primates, many other anatomical components and molecular pathways are sufficiently comparable for comparative studies. These have shown basic cellular and molecular processes, such as synaptic transmission and plasticity, to be conserved across species, emphasizing the use of rat models in research revolving around human brain work and neuroscientific guidelines. These studies show evidence allowing the use of rat models for human brain studies, which revealed the conservation of basic cellular and molecular processes, such as synaptic transmission and plasticity.
Artificial intelligence (AI) has recently been incorporated into neuroscience, expanding our knowledge of brain function and disorders. AI has demonstrated enormous promise in the analysis of brain information processing, particularly in diagnostic and prognostic neuroimaging for neurodegenerative diseases like Alzheimer’s disease. It is expected that the application of ML and DL methods will strengthen the accuracy and effectiveness of neuroimaging methods within dementia diagnosis and prognosis.
VGLUT1-pH (vesicular glutamate transporter 1-pHluorin) is a well-established tool for studying synaptic vesicle release and recycling. This reporter is a genetically encoded pH-sensitive fluorescent protein that enables the visualization of vesicular exocytosis and endocytosis at presynaptic terminals. Studies have shown that fluorescence intensity measurements provide insights into synaptic efficacy, plasticity, and neurotransmitter release dynamics.
Time series analysis has been increasingly applied in neuroscience to study neuronal firing patterns, synaptic activity, and functional connectivity. Methods such as autoregressive integrated moving average (ARIMA) models have been utilized to understand the temporal dependencies in neuronal data. Decomposition analysis further aids in identifying hidden trends, cyclical patterns, and noise components in fluorescence data. Recent studies have demonstrated the presence of seasonal fluctuations in neuronal activity, driven by intrinsic oscillatory processes and external stimuli. Seasonal ARIMA (SARIMA) models extend traditional ARIMA by incorporating seasonality, making them suitable for analyzing periodic trends in synaptic fluorescence data.
The identification of temporal dependencies in synaptic activity has significant implications for understanding neuronal adaptation, synaptic plasticity, and neurophysiological disorders. By employing advanced statistical modeling techniques, this study contributes to the growing body of literature on synaptic dynamics and computational neuroscience. Future studies may integrate machine learning approaches for enhanced predictive modeling and classification of synaptic activity patterns.
This project aims to decompose the synaptic dynamics data collected from Dr. Ashrafi’s lab at Washington University to highlight patterns within it, taking advantage of AI methodology, especially autoregression, and building a predictive model. By utilizing this fluorescent intensity data, we are capable of visualizing and analyzing synaptic vesicle dynamics. This helps find and understand temporal dependencies within the data. Our goal is to develop an Autoregressive Integrated Moving Average (ARIMA) model that is capable of accurately predicting synaptic behavior.
The VGLUT1-pH construct is widely adopted for its ability to reveal presynaptic activity through pH-dependent fluorescence changes that accompany vesicle exocytosis and endocytosis. Rat hippocampal neurons are commonly used in experimental neuroscience due to their physiological similarity to human neuronal networks, especially in terms of synaptic architecture, glutamatergic signaling, and plasticity mechanisms. These models enable reproducible in vitro studies of synaptic transmission, facilitating the development of both experimental and computational neuroscience approaches.
In recent years, artificial intelligence (AI) and machine learning (ML) techniques have increasingly supported neurobiological research, offering tools for data mining, prediction, and classification of complex brain signals. These tools allow for detailed analysis of synaptic behaviors, often difficult to characterize using traditional statistical approaches alone.
Time-series analysis has emerged as a key method in computational neuroscience, offering insights into neuronal firing patterns, rhythmicity, and network dynamics. Classical statistical models such as autoregressive integrated moving average (ARIMA) and its seasonal extension, SARIMA are particularly useful in modeling temporal dependencies in neural data, especially when capturing cyclic or periodic phenomena like synaptic bursts or stimulation effects. Several studies have applied SARIMA models to biological and physiological data, including gene expression, circadian rhythms, and neural oscillations, with promising results. These models can decompose complex signals into trend, seasonal, and residual components, offering interpretable insights into the mechanisms underlying observed dynamics.
2. Data Description
2.1 DATA COLLECTION
Fluorescence intensity data was obtained from primary rat hippocampal neurons cultured under standard laboratory conditions. Neurons were transfected with a VGLUT1-pHluorin (VGLUT1-pH) reporter, a genetically encoded, pH-sensitive, fluorescent protein that reports synaptic vesicle exocytosis. This construction enables the real-time visualization of synaptic vesicle release events at individual presynaptic boutons.
Following transfection, neurons were imaged using a high-resolution, time-lapse fluorescence microscope equipped with a suitable excitation/emission filter set for GFP derivatives. Synaptic stimulation was induced using either electrical field stimulation or chemical depolarization (e.g., KCl or high-potassium solution) to evoke vesicle release. Fluorescence images were acquired at consistent time intervals to capture dynamic changes in synaptic activity. Regions of interest (ROIs) were manually or semi-automatically defined using image analysis software such as FIJI (ImageJ), MATLAB, or Python-based tools. Fluorescence intensity values for each ROI were extracted frame-by-frame, generating time-series data representing synaptic vesicle release dynamics. The dataset was then segmented into pre-stimulation and post-stimulation phases for comparative analysis of baseline and evoked activity.
2.2 DATA CLEANING
Initial data cleaning ensured integrity and usability for time-series modeling. As the dataset did not contain null values, imputation was unnecessary. However, irrelevant metadata and empty entries specifically the first two rows and columns labeled ‘Unnamed: 0’, ‘Unnamed: 47’, and ‘Unnamed: 50’ were removed. Columns containing fluorescence data were cast into numeric formats to enable statistical computation.
Columns were systematically renamed to represent ROIs and their corresponding condition (before or after stimulation), ensuring consistent labeling across the dataset.
2.3 DATA PREPROCESSING
Data preprocessing involved two structured phases:
- Data Cleaning
- Removed the first two rows and extraneous columns (Unnamed: 0, Unnamed: 47, Unnamed: 48, Unnamed: 49)
- Verified absence of null values
- Ensured all relevant columns were converted to numeric data types
- Data Organization
- Constructed a cleaned DataFrame (df_new) with each ROI as a column
- Categorized columns based on experimental phase: before or after stimulation
- Labeled each column according to its corresponding ROI number and condition to facilitate downstream modeling and analysis
This structured preprocessing allowed for effective application of decomposition and SARIMA models in subsequent analysis stages.
3. Methodology
3.1 TIME SERIES DECOMPOSITION ANALYSIS
To understand the nature of the time series fluorescent intensity we performed a time series decomposition analysis that contained observed, trends, seasonal, and residual components using seasonal decompose from statsmodels.tsa.seasonal library. The decomposition helps uncover seasonal trends in the data, which are critical for selecting hyperparameters for the SARIMA models.
3.2 SEASONAL AUTO-REGRESSIVE INTEGRATED MOVING AVERAGE (SARIMA) MODEL
Model Parameters: Based on the decomposition analysis output, the SARIMA model hyperparameters were defined. The order of the ARIMA part of the model (p, d, q) was set to (1, 1, 1), and the seasonal order (P, D, Q, S) was set based on the seasonal period. Our analysis presented a seasonal period of 12.
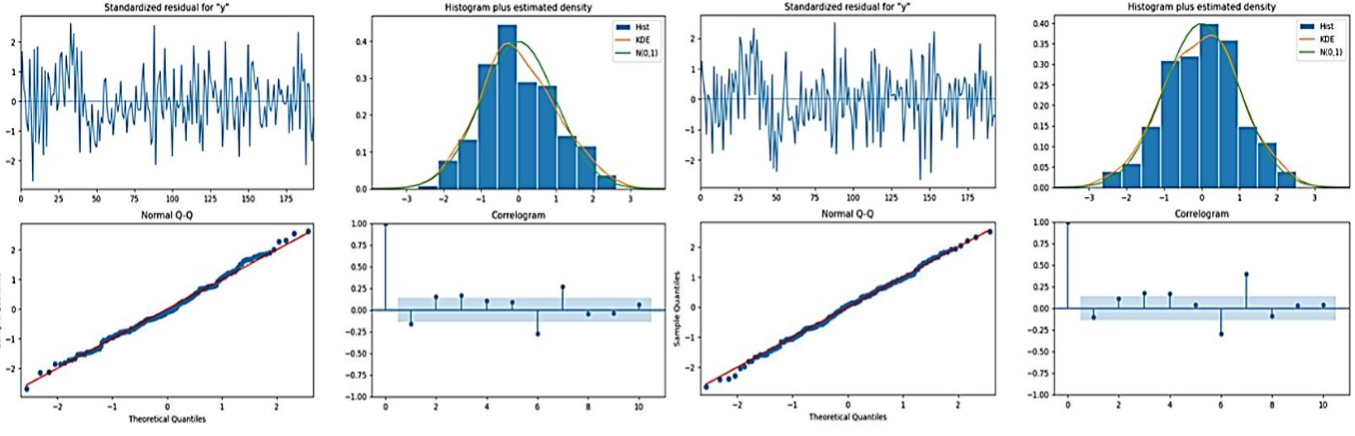
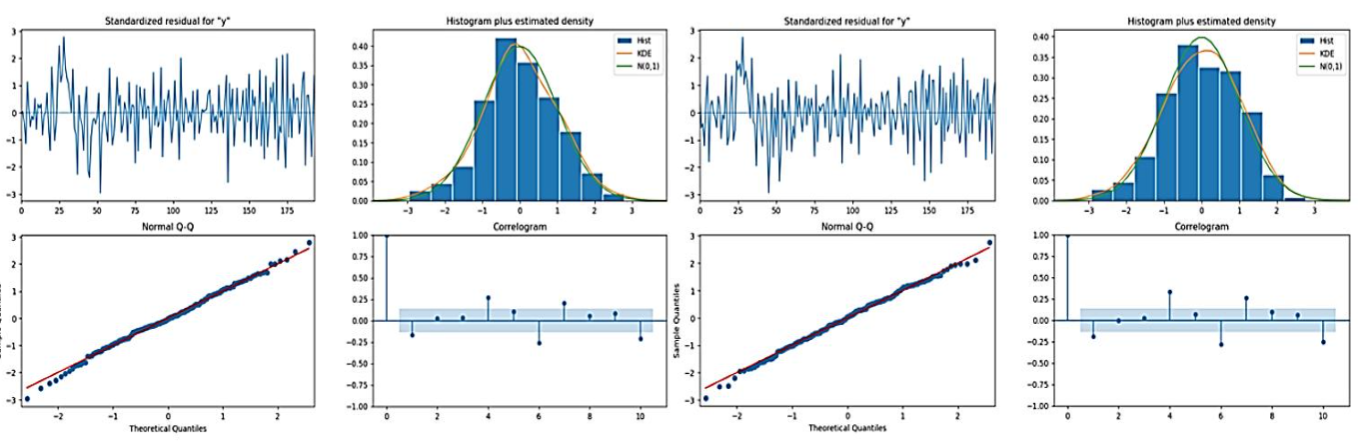
The SARIMA models were then fitted to the time series data for each ROI before and after stimulation using the SARIMAX function from the stats models library. For each ROI a model was fitted to identify the unique temporal dynamics in each region. Diagnostic checks were performed to model fits. These checks included:
- Standardized Residuals: standardized residuals are plotted to check for any patterns or deviations from randomness.
- Histogram and Q-Q Plot: By plotting the histogram and Q-Q plot we are assessing the normality of residuals and if they follow normal distribution.
- Correlogram: Are to ensure no significant autocorrelation.
The results of the SARIMA models and diagnostic tests were visualized using various plots:
- Time Series Decomposition Plots: Displaying the trend, seasonal, and residual components of the time series.
- SARIMA Diagnostic Plots: Including standardized residuals, histograms with estimated density, Q-Q plots, and correlograms.
These visualizations were an essential part of interpreting the results and confirming the model fit.
4. Results
4.1 TIME SERIES DECOMPOSITION
Looking at the result of the decomposition graphs, there are some notable differences in the pattern of fluorescence intensity before and after stimulation across different ROIs. Prior to the stimulation, the fluorescence intensity clearly peaked and then gradually fell, as seen in the original and trend components of the decomposition graphs. This truly represents the baseline level of fluorescence intensity, which peaks and then tapers off.
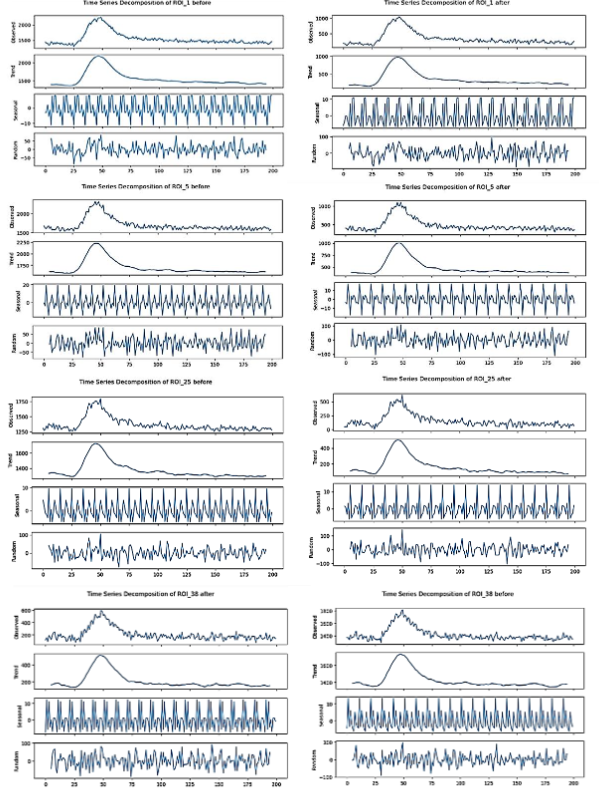
The seasonal components of this decomposition graph look consistent, pointing to the regularity and repetition of the pattern in the data. The random components, on the other hand, showed some moderate variability, suggesting some noise in the measurements.
After stimulation, the decomposition graphs reveal a similar peak shape in fluorescence intensity around the same data point (50), but the magnitude of this intensity peak is overall reduced when compared to the pre-stimulation phase. The trend components reflected this decrease in overall intensity as well, indicating that stimulation reduces the fluorescence signal. The seasonal components continue to show consistent patterns like the pre-stimulation phase, indicating that the underlying periodical pattern of the fluorescence intensity is not significantly altered by the stimulation. However, the random components showed a visible increase in variability after stimulation, indicating higher levels of noise and suggesting that the stimulation adds fluctuations into the data pattern.
Overall, the decomposition analysis graphs showcase that while the key seasonal patterns of fluorescence intensity remain unchanged, the stimulation causes an overall reduction in intensity and increases the randomness, concluding that synaptic activity dynamics change after stimulation. The residuals, which represent random noise, were relatively small, suggesting that the SARIMA model was the best fit for the characteristics of the data.
4.2 SARIMA MODEL
SARIMA models were fitted to the fluorescence intensity ROI both before and after stimulation. Diagnostic plots were then shown to gauge the model fits:
- Standardized Residuals: For each ROI plot before and after stimulation, there was no pattern in the standardized residual plots. That means it is random around zero. It suggests that the model has captured the main characteristics of the data very well.
- Histogram and Q-Q Plot: Histograms of the residuals overlaid by kernel density estimates and normal distribution curves suggested that the residuals were nearly normally distributed. Q-Q plots supported the above observation as the residuals were plotted closely on the normal distribution line, with deviations only at the tails.
- Correlogram: The correlograms for the residuals of each ROI, before and after stimulation, concluded that in most cases, the residuals were not correlated. Most of the coefficients of the autocorrelation lay within the 95% confidence intervals the blue shaded area, therefore one can conclude that the SARIMA models effectively represented the temporal dependencies in the data. The effects of stimulation on neuronal dynamics for future studies are highlighted by the results of seasonal patterns in the analysis of synaptic vesicle release.
The analysis of the time series decomposition, SARIMA model diagnostics, and correlation metrics from figures 2 and 3 provided several key findings:
- The Seasonal patterns were clearly visualized using decomposition graphs, which correspond to the synaptic behavior cycles. In such cases, using SARIMA models is ideal.
- The temporal dependencies of the data were represented accurately with the use of SARIMA models, and it shows good fit, which is confirmed by utilizing diagnostic tests/graphs.
The effects of stimulation on neuronal dynamics for future studies are highlighted by the results of seasonal patterns in the analysis of synaptic vesicle release.
5. Discussion and Further Research
| ROI | Condition | Observed Pattern | Trend Pattern | Seasonal Pattern | Residual Notes |
|---|---|---|---|---|---|
| ROI_1 | Before | Sharp rise, then plateau | Clear peak around midpoints | Strong periodic oscillations | Moderate noise |
| ROI_1 | After | Slightly lower than before | Similar peak, slightly lower | Similar periodicity, slightly clearer | Slightly less noise |
| ROI_5 | Before | High intensity, strong peak | Wide peak | Strong seasonal component | Noticeable fluctuations |
| ROI_5 | After | Lower overall intensity | Trend decays faster | Seasonal components are still present | Similar residuals to before |
| ROI_25 | Before | Sharp peak then plateau | Clear decaying trend | High-frequency oscillation | Low-to-moderate noise |
| ROI_25 | After | Slight drop in observed values | Similar decay pattern | Slightly dampened seasonal effect | Noise remains consistent |
| ROI_38 | Before | Highest intensity among ROIs | Prominent peak and decay | Strong seasonal behavior | Noticeable variance |
| ROI_38 | After | Slightly reduced intensity | Peak is slightly flattened | Seasonal behavior is still visible | Residuals remain similar |
In Summary:
- Trend remains consistent before and after stimulation, though usually slightly lower after.
- Seasonality is persistent across conditions and ROIs, with only slight variations in amplitude.
- Residuals show moderate noise, with little change due to stimulation.
- Observed values generally drop slightly after stimulation, indicating a response effect.
The analysis of fluorescence intensity data using SARIMA models provides key insights into the synaptic activity patterns before and after stimulation in the ROIs in the rat’s brain. The decomposition graphs of the time series data into trend, seasonal, and random components showcased significant findings that further expand our understanding of the neuronal responses to stimulation.
One of the key observations from the decomposition is strong seasonal patterns that are found in the fluorescence intensity data across all ROIs. These seasonal components show periodic patterns, which suggest biological rhythms in the synaptic activity. The presence of seasonality highlights the necessity of using seasonal models such as SARIMA to capture and consider these patterns effectively.
The SARIMA model diagnostics further affirm how reliable these models are in handling data like fluorescence intensity data. The standardized residuals for each ROI, both before and after stimulation, have a fluctuation around zero with no specific patterns, indicating that the SARIMA models capture the primary trends and seasonal components within the data. The normal Q-Q plots and histograms of residuals show that the residuals nearly follow a normal distribution, which is significant for the validity of the SARIMA models.
Comparing before and after stimulation, SARIMA models allow us to reveal key insights into the effects of stimulation on synaptic activity. The trend components of the decomposed graph present an overall reduction in fluorescence intensity after stimulation. Concluding weaker effects of stimulation on synaptic activity. This statement can be generalized over most ROIs, highlighting a systematic response to stimulation.
The findings from this analysis have multiple important biological implications. The strong seasonal patterns observed in the fluorescence intensity data suggest that synaptic activity follows regular, repeating cycles that are likely influenced by intrinsic mechanisms. The reduction of the effect of stimulation on fluorescence intensity, is shown by the trend components, indicating that external stimuli can have an impact on these intrinsic patterns and potentially affect the overall neural network dynamics.
The increased noise levels and significant residual autocorrelations after stimulation suggest that the response to stimulation is very complex and involves multiple processes. This complexity paves the way for further studies to better understand the specific mechanisms causing these responses.
This research provides a foundation for statistical analysis of VGLUT1-pH responses to external stimuli. The analysis effectively demonstrates that VGLUT1-pH does respond to stimuli and the SARIMA models can measure the effect.
There are several directions to expand this research, enabling effective application of statistical methods to evaluate the impact of external stimuli. One possibility is to use statistical methods to measure the effects of different types of stimuli in the lab. This should allow differentiating among types of external stimuli using SARIMA models. This allows a foundation for identifying similarities and differences between different stimuli using VGLUT1-pH. It would be useful to know how different stimuli map to VGLUT1-pH response. Specifically, when are there statistically significant differences between external stimuli?
The next phase of the research involves mapping the lab stimuli to external events. The data collected is based on experimental stimuli, under controlled conditions. Once multiple controlled conditions are evaluated, external stimuli, under real-world conditions can be evaluated. This enables a mapping of actual events into identified responses. Again, there is interest in understanding which types of real-world events map into different, statistically significant groups.
Finally, the type of data used in this study should be expanded to include real-time data that can easily be collected. This data could include personal data, such as heart rate, oxygen saturation, blood pressure, and physical activity, as well as external conditions, including time of day and temperature. If similar results are found in real-time data collected by a smart watch, decision support tools could be developed. At the extreme, personalized models could be developed, allowing for customized health recommendations.
6. Conclusion
In conclusion, the use of SARIMA models on time series data such as fluorescence intensity data from synaptic vessels allows the detection of seasonal patterns and shows the lowering effect of stimulation on its activity. While model diagnostics are robust, there are additional temporal dependencies that allow for further investigation. These findings provide a guide for future studies that aim to understand synaptic dynamics and the effects of applied external stimuli on neuronal activity.
7. Declarations
A. Competing Interest:
All authors declare that they have no conflicts of interest.
B. Funding:
No Funding for this project.
Bahareh Rahmani: Administration of Analytics part, Review the Paper, Validation.
Shawd Nusier: Data Analysis, Coding, Web Development, Visualization, Interpretation, Writing the original paper.
Mukta Rani: Data Analysis, Coding, Web Development, Interpretation, Writing the original paper.
Fnu Mehtab Farozan Khatoon: Coding, Web Development, Interpretation, Writing the original paper.
Brandon Tabman: Literature Review, Review the Paper.
Payam Norouzzadeh: Supervision of Analytics part, Review the Paper, Validation.
Ghazaleh Ashrafi: Supervision of Clinical part, Data Provider, Review the Paper, Validation.
Eli Snir: Administration of Analytics part, Paper Review, Paid the APC, Validation.
D. Acknowledgment:
Not Applicable.
E. Consent to Publish:
We give our consent for the publication of exclusive details, that could be included figures and tables and details within the manuscript to be published in journal.
References:
- Thau L, Reddy V, Singh P. Anatomy, central nervous system. [Updated 2022 Oct 10]. In: StatPearls [Internet]. Treasure Island (FL): StatPearls Publishing; 2025 Jan-. Available at: https://www.ncbi.nlm.nih.gov/books/NBK542179/
- Ellenbroek B, Youn J. Rodent models in neuroscience research: is it a rat race? Dis Model Mech. 2016 Oct 1;9(10):1079-1087. doi: 10.1242/dmm.026120. PMID: 27736744; PMCID: PMC5087838.
- Ma S, Skarica M, Li Q, et al. Molecular and cellular evolution of the primate dorsolateral prefrontal cortex. Science. 2022. doi: 10.1126/science.abo7257.
- Onciul R, Tataru CI, Dumitru AV, et al. Artificial Intelligence and Neuroscience: Transformative Synergies in Brain Research and Clinical Applications. J Clin Med. 2025;14(2):550. Published 2025 Jan 16. doi:10.3390/jcm14020550
- Frizzell TO, Glashutter M, Liu CC, et al. Artificial intelligence in brain MRI analysis of Alzheimer’s disease over the past 12 years: A systematic review. Ageing Res Rev. 77:101614, 2022. doi: 10.1016/j.arr.2022.101614
- Nakakubo Y, Abe S, Yoshida T, et al. Vesicular Glutamate Transporter Expression Ensures High-Fidelity Synaptic Transmission at the Calyx of Held Synapses. Cell Rep. 2020;32(7):108040. doi:10.1016/j.celrep.2020.108040
- Sankaranarayanan S, Ryan TA. Real-time measurements of vesicle-SNARE recycling in synapses of the central nervous system. Nature Cell Biology, 2(4), 197-204. 2000. doi: 10.1038/35008615
- Burrone J, Li Z, & Murthy, V. N. Synaptic vesicle recycling in hippocampal neurons. Proceedings of the National Academy of Sciences, 99(23), 14488-14493, 2002. doi: 10.1073/pnas.0501145102
- Gandhi SP, Stevens, CF. Three modes of synaptic vesicular recycling revealed by single-vesicle imaging. Nature, 423(6940), 607-613, 2003. Doi:10.1038/nature01677
- Miller, K., Yi, G., Snir, E. et al. Precipitation analysis and forecasting weather of Texas, United States. Int. J. Inf. Tecnol. 15, 549 556. 2023. Doi: 10.1007/s41870-022-01063-z
- Breakspear M. Dynamic models of large-scale brain activity. Nature Neuroscience, 20(3), 340-352. 2017. doi: 10.1038/nn.4497
- Honey CJ, Kotter R, Breakspear M, Sporns, O. Network structure of cerebral cortex shapes functional connectivity on multiple time scales. Proceedings of the National Academy of Sciences, 104(24), 10240-10245. 2007. doi: 10.1073/pnas.0701519104
- Box, G. E. P., Jenkins, G. M., Reinsel, G. C., & Ljung, G. M. Time Series Analysis: Forecasting and Control. John Wiley & Sons, 2015.
- Shumway RH, Stoffer DS. Time Series Analysis and Its Applications: With R Examples. Springer, 2017
- Cunningham JP, Yu BM, Shenoy KV. Inferring neural firing rates from spike trains using Gaussian processes. Advances in Neural Information Processing Systems, 21, 329-336, 2009.
- Gao P, Trautmann E, Yu BM, Santhanam G, Ryu S, Shenoy KV, Ganguli S, A theory of multineuronal dimensionality, dynamics, and measurement. Neuron, 91(4), 857-873, 2015. doi: 10.1101/214262
- Quian Quiroga R, Panzeri S. Extracting information from neuronal populations: Information theory and decoding approaches. Nature Reviews Neuroscience, 10(3), 173-185, 2009.
- Rahmani B, Yiyuan H, Aqeel M., Norouzzadeh P., Maazallahi A., Snir E., Ashrafi G., Brain information processing analysis using artificial intelligence methods, Signal & Image Processing: An International Journal, 16(6), Page 23-34, 2024.
- Balaji, J., Ryan, T. A. Single-vesicle imaging reveals that synaptic vesicle exocytosis and endocytosis are coupled by a single stochastic mode. Neuron, 56(6), 929 939. 2007. doi: 10.1073/pnas.0707574105
- Banker, G., Cowan, W. M. Rat hippocampal neurons in dispersed cell culture. Brain Research, 126(3), 397 425. 1977. doi: 10.1016/0006-8993(77)90594-7
- Sudhof, T. C. The synaptic vesicle cycle. Annual Review of Neuroscience, 27, 509 547. 2004. doi:10.1146/annurev.neuro.26.041002.131412
- Vieira, S., Pinaya, W. H. L., Mechelli, A. Using deep learning to investigate the neuroimaging correlates of psychiatric and neurological disorders: Methods and applications. Neuroscience & Biobehavioral Reviews, 74, 58 75. 2017. doi: 10.1016/j.neubiorev.2017.01.002
- Brown, E. N., Kass, R. E., Mitra, P. P. Multiple neural spike train data analysis: State-of-the-art and future challenges. Nature Neuroscience, 7(5), 456-461.2004. doi: 10.1038/nn1228
- Shlens, J. (2014). A tutorial on principal component analysis. arXiv. 2014. Available at: https://arxiv.org/abs/1404.1100
- Luan, Y., & Li, H. Clustering of time-course gene expression data using a mixed-effects model with B-splines. Bioinformatics, 19(4), 474 482. 2003. doi: 10.1093/bioinformatics/btg014
- Leise, T. L. Wavelet analysis of circadian and ultradian behavioral rhythms. Journal of Circadian Rhythms, 11(1), 5. 2013. doi: 10.1186/1740-3391-11-5
- Matsumura, G., Honda, S., Kikuchi, T., Mizuno, Y., Hara, H., Kondo, Y., Nakamura, H., Watanabe, S., Hayakawa, K., Nakajima, K., Takei, K., Real-time personal healthcare data analysis using edge computing for multimodal wearable sensors, Device, 3(2). 2025. 100597, ISSN 2666-9986, 2025. doi: 10.1016/j.device.2024.100597.
- Chén OY, Roberts B. Personalized Health Care and Public Health in the Digital Age. Front Digit Health. 2021 Mar 30;3:595704. doi: 10.3389/fdght.2021.595704. PMID: 34713084; PMCID: PMC8521939.