


Validating Bio-Well Technology for Medical Research
Validating Bio-Well Technology for Medical Research: A Multi-Parameter Optimization Approach
Igor Nazarov, PhD ¹; Caitlin A. Connor, DAOM, PGDip, AMP, EHP-C ²; Melinda H. Connor, DD, PhD, AMP, FAM, EHP-C ³
¹ CEO, MIG-Tech Lab, Oregon, USA
² Principal Investigator and Founder, Green Mountain Health Care, Assistant Professor, Complimentary Medicine, Akamai University
³ Co-Principal Investigator and Founder, Earthsongs Holistic Consulting, Professor Emerita, Director of Research Emerita, Akamai University
OPEN ACCESS
PUBLISHED: 30 June 2025
CITATION Nazarov, I., Connor, CA., et al., 2025. Validating Bio-Well Technology for Medical Research: A Multi-Parameter Optimization Approach. Medical Research Archives, [online] 13(6). https://doi.org/10.18103/mra.v13i6.6649
COPYRIGHT © 2025 European Society of Medicine. This is an open-access article distributed under the terms of the Creative Commons Attribution License, which permits unrestricted use, distribution, and reproduction in any medium, provided the original author and source are credited.
DOI: https://doi.org/10.18103/mra.v13i6.6649
ISSN 2375-1924
ABSTRACT
This study validates Bio-Well technology (a commercial implementation of Gas Discharge Visualization) for distinguishing treatment effects from placebo responses in medical research. In a randomized crossover study of 50 participants aged 40-90, we analyzed three key parameters (Area, Normalized Area, and Inner Noise Percentage) across 95 finger-organ pairs following consumption of light-infused water versus placebo. A novel scoring system (0-100 points) evaluated parameter-finger-organ combinations based on statistical significance, effect sizes, and opposing directional changes between conditions. Results showed exceptional sensitivity in endocrine systems, particularly thyroid measurements (80-90 points). Inner Noise Percentage demonstrated opposing directional changes in 50% of measurements, significantly exceeding random probability and indicating genuine physiological responses. Left-hand measurements consistently outperformed right-hand counterparts. Strong correlation between statistical metrics validated the methodology. This multi-parameter optimization approach establishes Bio-Well as a viable assessment tool for non-invasive monitoring of treatment efficacy when utilizing specific parameter-finger-organ combinations.
Keywords:
Bio-Well, Gas Discharge Visualization, biofield measurement, placebo response, endocrine sensitivity, non-invasive assessment
Introduction
The quest to measure and understand subtle energy fields in biological systems has long represented a critical frontier where conventional medical science converges with advanced biophysics and complementary approaches. Historically, this field has explored the intricate energetic interactions underlying health and disease, yet has faced significant challenges in establishing robust, reproducible measurement methodologies and gaining mainstream scientific acceptance. Among various technologies developed to capture these elusive measurements, Bio-Well has emerged as a promising, albeit often scrutinized, tool for assessing the human biofield.
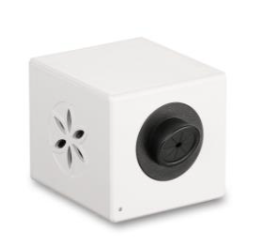
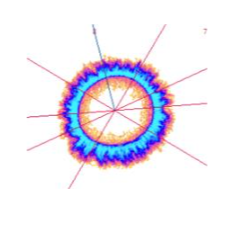
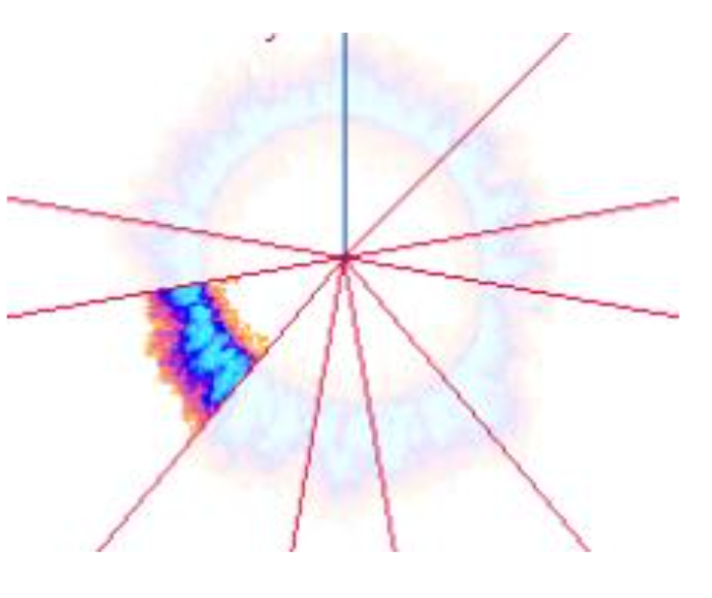
Gas Discharge Visualization, developed by Dr. Konstantin Korotkov and his team in Russia, captures the corona discharge around human fingertips. The fingertips are placed on a dielectric glass plate, which has a milliwatt of electricity passing through it, producing a scatter pattern of gas emissions from the fingertips. Through sophisticated software analysis, these corona patterns, captured by a camera as digitized images, are mapped to specific organs and body systems based on Traditional Chinese Medicine meridian theory and modern bioenergetic understanding.
Despite its intriguing premise and widespread use in complementary medicine, Gas Discharge Visualization has struggled to gain broad acceptance in mainstream medical research due to questions about measurement consistency, parameter interpretation, and its ability to robustly distinguish genuine physiological effects from noise. Our research directly addresses these fundamental challenges through a novel multi-parameter optimization approach. This manuscript specifically focuses on the methodological breakthrough and validation of Gas Discharge Visualization technology for discerning treatment effects. This methodology aims to transform Bio-Well from an exploratory tool, often met with skepticism, into a validated medical assessment technology capable of reliably detecting subtle physiological changes, thereby opening new possibilities for non-invasive monitoring of treatment efficacy.
Study Context
Our Gas Discharge Visualization method optimization research was conducted within the framework of a larger investigation (Study 4 in a series) examining the effects of water infused with specific nanometer wavelengths of light on human physiology. This light-infused water is believed to carry specific energetic signatures that interact with biological systems, forming the experimental intervention being assessed by Gas Discharge Visualization method. The study employed a crossover design with 50 participants aged 40-90, each serving as their own control. Participants consumed either light-infused water or untreated water, with comprehensive pre- and post-intervention measurements taken using multiple assessment modalities. While the overall study included various physiological, biochemical, and subjective measures, our focus here is on the methodological breakthrough in the application and optimization of Bio-Well technology.
Background: Understanding Gas Discharge Visualization Method Parameters
Bio-Well captures as a digitized image and then analyzes multiple parameters from each fingertip corona discharge. While the system measures 11 distinct parameters for analysis, our research focused on three that demonstrated the highest sensitivity and reliability:
- AREA (C)
This parameter measures the literal surface area of the energy field corona in calibrated units. It provides a direct quantification of the energy field’s physical extent around each finger sector, with different sectors corresponding to specific organs according to the Bio-Well mapping system. - NORMALIZED AREA (NORM AREA)
This parameter represents the area measurement adjusted for individual baseline variations. By normalizing the raw area data, this parameter accounts for inherent differences between subjects, making cross-subject comparisons more meaningful and reducing the impact of individual variability. - INNER NOISE (%)
This sophisticated parameter measures the heterogeneity or “fractal dimension” of the energy field, normalized for the finger image area. Higher values indicate greater irregularity in the corona discharge pattern, which can reflect stress, inflammation, or other physiological disturbances. The percentage format provides standardization across different finger sizes and measurement conditions.
These three parameters were selected from the full set of 11 based on their complementary nature—two focusing on field size (raw and normalized) and one on field quality—providing a comprehensive assessment of energy field characteristics.
Methodology: The Multi-Parameter Optimization Approach
This study was conducted in strict accordance with the Declaration of Helsinki and Good Clinical Practice (GCP) guidelines, reflecting the robust methodological framework of the larger study series. Ethical approval for the larger investigation (Study 4 in the series) was obtained from the joint National Alliance of Energy Practitioner/International Journal of Healing and Caring human studies research ethics board, which is a federally registered research ethics board. Approval was NAOEP/IJHC 05-30-24-6 for funding number #GMHC30. The study employed a randomized controlled crossover design with 50 participants aged 40-90, where each participant served as their own control. All participants provided written informed consent prior to enrollment. Participants were recruited via contacting prior participants, kiosk announcements, magazine ads, and word of mouth and rigorously screened for age, no pregnancy, and no major health issues, including psychological, to ensure participant safety and study integrity. Data collection occurred in a controlled laboratory environment with consistent lighting, temperature, and minimal electromagnetic interference to ensure measurement integrity, adhering to standardized Gas Discharge Visualization method measurement protocols.
STUDY DESIGN
- Participants consumed either light-infused water (treatment) or regular distilled water (placebo)
- Gas Discharge Visualization measurements were taken before and after water consumption
- Each finger was measured, with different finger segments mapped to specific organs
- A total of 95 finger-organ pairs were analyzed per participant.
SCORING SYSTEM DEVELOPMENT
We developed a novel sensitivity scoring system (0-100 points) that evaluated each finger-organ pair based on four criteria:
- Statistical significance (0-40 points)
- p < 0.01: 40 points
- p < 0.05: 30 points
- p < 0.1: 20 points
- p ≥ 0.1: 0 points
- Percent change differences between treatment and placebo (0-30 points)
- Difference > 10%: 30 points
- Difference > 5%: 20 points
- Difference > 3%: 10 points
- Difference ≤ 3%: 0 points
- Effect size ratios (0-15 points)
- Ratio > 2.0: 15 points
- Ratio > 1.5: 10 points
- Ratio > 1.2: 5 points
- Ratio ≤ 1.2: 0 points
- Opposing directional changes (0-15 points)
- Treatment and placebo in opposite directions: 15 points
- Same direction: 0 points
Classification Categories
Based on total scores, finger-organ pairs were classified as:
- Highly Recommended: ≥60/100
- Recommended: 40-59/100
- Potential: 20-39/100
- Not Recommended: <20/100
DATABASE ORGANIZATION
The results of the Bio-Well readings were combined into the Excel table containing all 11 Gas Discharge Visualization parameters (Area, Area (C), Norm area, Intensity, Inner area, Inner noise, Inner noise (%), Energy, Energy (C), Form coefficient FC, Entropy coefficient EC) as illustrated in Table 1. Statistical evaluation was performed for each finger-organ pair before and after the treatment (Pre vs Post). Mean values and standard deviations were calculated before the treatment and after. The observed mean (M) and its standard deviation (SD) was calculated and used to assess the amount of change accompanied by p-value1. Comparison with the placebo data was accompanied by the p-value2.
In Table 1, each row represents a specific finger-organ pair measurement, with columns organized as follows: The first columns identify the Bio-Well parameter and finger-organ combination. Treatment 1 (Trt1) columns show the active group (mean ± SD), while Treatment 2 (Trt2) columns the control group. The change columns calculate the difference between pre- and post-measurements, with p-value1 indicating within-group significance. P-value2 represents the between-group comparison (treatment vs. placebo), which is crucial for determining genuine physiological effects versus placebo responses.
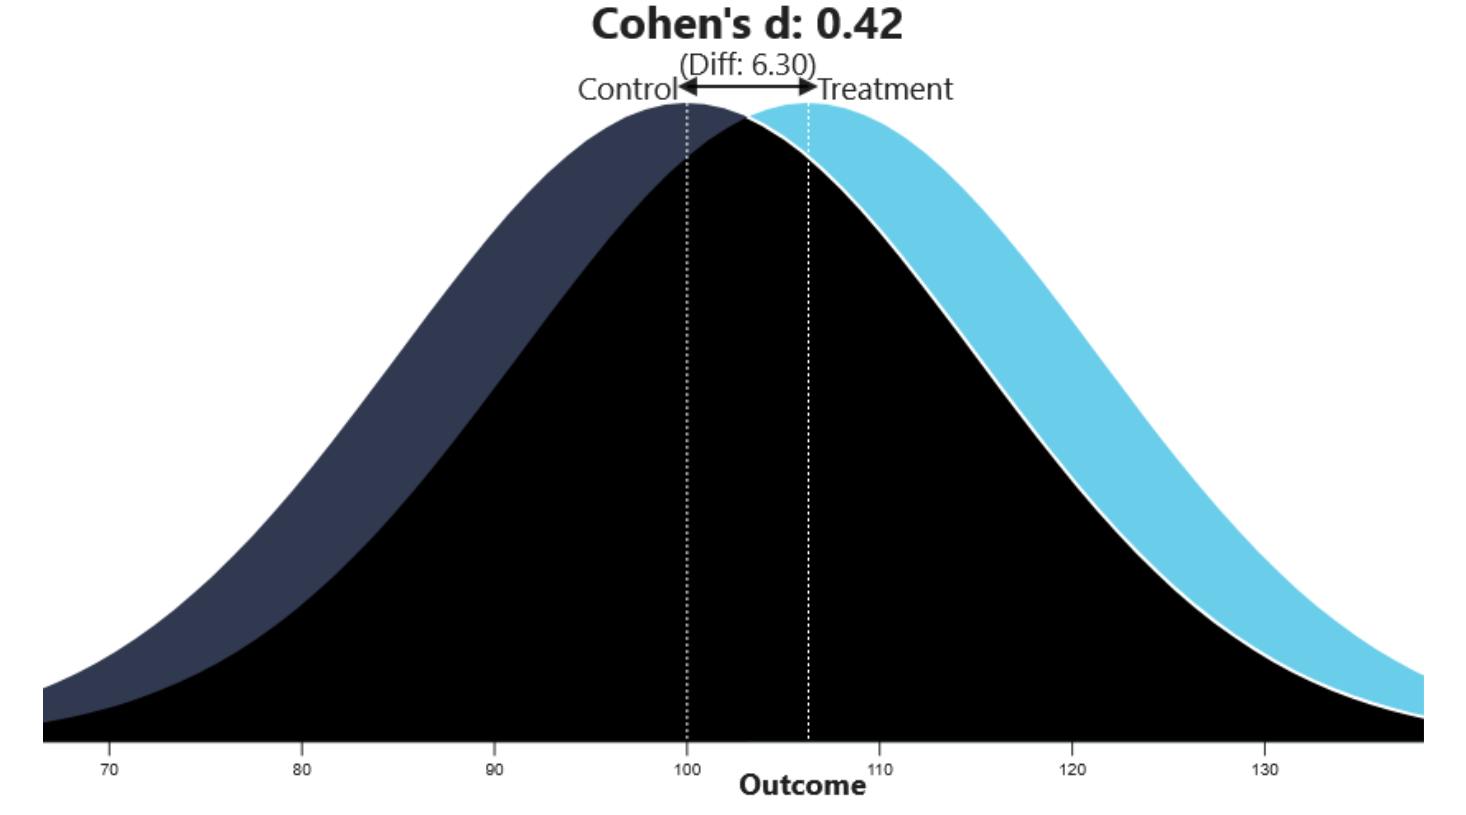
All statistical analyses were conducted by an independent senior-level biostatistician, Jens Eickhoff (Eickhoff Statistical Consulting). Dr. Eickhoff’s extensive experience in clinical trials methodology, especially in early phase clinical trials, and biostatistics, ensured rigorous data evaluation. For within-group comparisons, paired t-tests were applied to assess the significance of changes from pre- to post-intervention (p-value1). Between-group differences (treatment vs. placebo) were evaluated using independent t-tests (p-value2). Effect sizes were quantified using Cohen’s d, calculated as per Cohen, to determine the magnitude of observed effects. All statistical tests were two-tailed, with significance established at p < 0.05.
Results: Three-Parameter Analysis
AREA (C) FINDINGS
Analysis of Area (C) revealed:
- 16 highly recommended pairs (16.67%)
- 29 recommended pairs (30.21%)
- 41.05% opposing directional changes
- Average score for highly recommended pairs: 70.31/100
Top performing finger-organ pairs included:
- R Thumb Finger – Thyroid gland (90/100)
- L Thumb Finger – Thyroid gland (90/100)
- L Thumb Finger – Whole image (80/100)
NORM AREA FINDINGS
Norm Area demonstrated:
- 6 highly recommended pairs (6.25%)
- 14 recommended pairs (14.58%)
- 40.63% opposing directional changes
- Average score for highly recommended pairs: 63.33/100
Notable pairs included:
- L Fore Finger – Coccyx, Pelvis minor zone, Prostate (60/100)
- L Ring Finger – Urogenital system (60/100)
- L Ring Finger – Adrenal (60/100)
INNER NOISE (%) FINDINGS
Inner Noise (%) showed:
- 6 highly recommended pairs (6.25%)
- 18 recommended pairs (18.75%)
- 50.00% opposing directional changes (highest among parameters)
- Average score for highly recommended pairs: 71.33/100
Leading pairs included:
- L Thumb Finger – Thyroid gland (85/100)
- L Thumb Finger – Cerebral zone (cortex) (80/100)
- L Thumb Finger – Whole image (80/100)
Key Discoveries
- GLANDULAR SYSTEM SENSITIVITY
A striking pattern emerged showing that glandular systems, particularly the thyroid, demonstrated exceptional sensitivity across all parameters. Both left and right thumb measurements of the thyroid consistently scored among the highest (80-90/100), suggesting that endocrine organs may be particularly responsive to subtle energy changes. This finding aligns with clinical observations that glands respond more rapidly to interventions than major organs. The heightened sensitivity of glandular systems likely reflects their unique physiological characteristics. Endocrine glands function as biological amplifiers, where small stimuli can trigger cascading hormone releases that affect multiple body systems. Their high metabolic activity, dense vascularization, and critical role in maintaining homeostasis make them particularly responsive to subtle energetic shifts. Additionally, the rapid turnover of hormonal secretions allows glands to reflect physiological changes more quickly than structural organs with slower cellular renewal rates. This observed sensitivity provides a physiological rationale for including Gas Discharge Visualization measurements in research targeting endocrine function and stress responses. - OPPOSING DIRECTIONAL CHANGES AS BIOMARKERS
The phenomenon of opposing directional changes—where treatment produces effects in the opposite direction from placebo—proved to be a powerful indicator of genuine physiological response. Inner Noise (%) showed the highest rate at 50% for these opposing changes (compared to approximately 40% for other parameters), suggesting it may be particularly sensitive for distinguishing treatment effects from placebo responses. This 50% rate is not indicative of random probability (which would imply equal distribution of increases and decreases within each group) but rather represents a clear and significant divergence in the direction of response between the active treatment group and the placebo group. This pattern transcends simple statistical noise and represents a true differential biological response, offering robust evidence of efficacy. - LEFT-HAND DOMINANCE
Across all parameters, left-hand fingers consistently demonstrated higher sensitivity than their right-hand counterparts. This lateralization effect may reflect hemispheric differences in autonomic nervous system regulation or energy field expression. - STATISTICAL VALIDATION
Analysis of the relationship between between-group significance (p-value2) and effect size (Cohen’s d) revealed a strong correlation (r ≈ -0.82), validating our scoring system. While p-value2 was not included as a direct component in our scoring calculation, it served as a critical validation threshold. All highly recommended pairs showed both significant p-value2 (<0.05) and meaningful effect sizes (Cohen’s d > 0.39). This dual requirement ensures that our scoring system identifies only those finger-organ combinations demonstrating genuine differential responses between treatment and placebo conditions, preventing false positives while maintaining sensitivity to real physiological changes.
| Parameter | Finger Name | Trt M0 | SD0 | M1 | SD1 | M | SD | p-value1 | p-value2 |
|---|---|---|---|---|---|---|---|---|---|
| Area | L Fore Finger 1. Descending colon | 582.5 | 105.7 | 596.9 | 98.8 | 14.5 | 100.4 | 0.3179 | 0.1745 |
| Area | L Fore Finger 1. Descending colon | 599.1 | 96.9 | 587.4 | 85.1 | -11.7 | 86.3 | 0.3355 | |
| Area | L Fore Finger 2. Sigmoid colon | 1447.5 | 247.1 | 1445.8 | 223.6 | -1.7 | 196.3 | 0.9515 | 0.8120 |
| Area | L Fore Finger 2. Sigmoid colon | 1445.1 | 243.1 | 1433.9 | 187.1 | -11.2 | 202.6 | 0.6952 | |
| Area | L Fore Finger 3. Rectum | 1530.6 | 223.7 | 1525.2 | 195.7 | -5.4 | 209.5 | 0.8754 | 0.2661 |
| Area | L Fore Finger 3. Rectum | 1506.5 | 232.3 | 1553.4 | 203.2 | 46.8 | 194.9 | 0.1468 |
Results: Graphical Representation
5. PARAMETER COMPLEMENTARITY
Each parameter captured different aspects of physiological response:
- Area (C): Most sensitive to structural/physical changes
- Norm Area: Best for detecting systemic responses
- Inner Noise (%): Optimal for nervous system and stress-related changes
Implications for Medical Applications
CLINICAL PROTOCOL RECOMMENDATIONS
Based on our findings, we propose a streamlined Bio-Well assessment protocol for medical applications:
- Primary Parameters: Focus on Area (C) and Inner Noise (%)
- Key Fingers: Prioritize left thumb, left ring, and left fore fingers
- Target Systems:
- Endocrine assessment: Thyroid measurements on both thumbs
- Nervous system evaluation: Cerebral zone measurements with Inner Noise (%)
- Structural assessment: Pelvic/spinal regions with Area (C)
- Analysis Focus: Specifically examine opposing directional changes between treatment and control conditions
This streamlined protocol offers significant practical advantages over comprehensive 11-parameter analysis. By focusing on the most sensitive parameter-finger combinations, practitioners can reduce measurement time by approximately 70% while maintaining diagnostic accuracy. This efficiency leads to lower costs, improved patient compliance, and the ability to integrate Gas Discharge Visualization assessments into standard clinical workflows. Moreover, the reduced data complexity minimizes interpretation errors and training requirements for healthcare providers.
VALIDATION CRITERIA FOR MEDICAL USE
For Gas Discharge Visualization method measurements to be considered medically relevant, we recommend:
- Minimum sensitivity score of 60/100 using our classification system
- Presence of opposing directional changes between treatment and placebo
- Statistical significance in between-group comparisons (p-value2 < 0.05)
- Effect size (Cohen’s d) greater than 0.40
Discussion: Advancing Bio-Well Science
This research directly addresses the overarching goal of transforming Bio-Well from an exploratory tool into a validated medical assessment technology. By developing and applying a multi-parameter optimization approach, our findings provide robust evidence that Gas Discharge Visualization can reliably distinguish genuine physiological responses from placebo effects when specific analytical protocols are rigorously followed. This advancement significantly mitigates longstanding concerns regarding its measurement consistency and ability to yield interpretable clinical data.
Our multi-parameter optimization approach addresses several longstanding challenges in Gas Discharge Visualization research:
- MEASUREMENT RELIABILITY
By identifying specific finger-organ combinations with consistently high sensitivity scores, we’ve moved beyond the “whole system” approach that previously yielded inconsistent results. The focus on normalized parameters (Norm Area and Inner Noise %) reduces individual variability while maintaining sensitivity to physiological changes. - PHYSIOLOGICAL RELEVANCE
The strong performance of glandular measurements, particularly thyroid, provides a physiological basis for the Gas Discharge Visualization method’s sensitivity. Endocrine organs are known for their rapid response to stimuli and their role as biological amplifiers, making them ideal targets for subtle energy assessment. - STATISTICAL RIGOR
The correlation between p-value2 and Cohen’s d effect sizes demonstrates that our scoring system captures genuine biological effects rather than statistical artifacts. This relationship provides a mathematical foundation for Gas Discharge Visualization’s validity in controlled research settings. - CLINICAL PRACTICALITY
Our streamlined protocol—focusing on three parameters and specific finger-organ pairs—transforms the Gas Discharge Visualization method from a complex 11-parameter system into a practical clinical tool. This reduction in complexity without loss of sensitivity makes the Gas Discharge Visualization approach more accessible for medical practitioners.
Limitations
While this study provides significant validation for Gas Discharge Visualization technology, certain limitations must be acknowledged.
Firstly, the sample size of 50 participants, while sufficient for detecting robust effects with our optimized parameters, limits the generalizability of findings to broader and more diverse populations. Future research should replicate these findings in larger and more varied cohorts.
Secondly, the intervention itself—water infused with specific nanometer wavelengths of light—represents a novel approach within energy medicine; thus, the direct applicability of these Gas Discharge Visualization responses to other types of therapeutic interventions requires further investigation. The underlying biophysical mechanisms by which light-infused water exerts its effects, and how Gas Discharge Visualization method precisely captures these, remain areas for continued mechanistic research.
Furthermore, while our methodology provides robust statistical validation for distinguishing genuine effects, the broader acceptance of Bio-Well apparatus in mainstream medical diagnostics is still evolving. Future studies should aim for independent replication by diverse research teams and explore direct correlations with established conventional biomarkers to further bridge this gap.
Potential Future Research Directions
While our findings validate Gas Discharge Visualization method for specific medical and research applications, several areas warrant further investigation:
- Longitudinal Studies: Examining how parameter sensitivity changes over extended treatment periods
- Disease-Specific Protocols: Developing optimized measurement protocols for specific conditions
- Mechanistic Research: Investigating the biophysical basis of opposing directional changes
- Integration Studies: Combining Gas Discharge Visualization method with conventional biomarkers for enhanced diagnostic accuracy
Conclusion
This research represents a significant advance in validating Bio-Well apparatus for medical applications. Through our multi-parameter optimization approach, we’ve demonstrated that Gas Discharge Visualization method can reliably distinguish treatment effects from placebo responses when utilizing specific parameter-finger-organ combinations. The identification of highly sensitive measurement points—particularly in glandular systems—and the recognition of opposing directional changes as biomarkers of genuine physiological response establish a scientific foundation for Gas Discharge Visualization method’s clinical use. This paper specifically highlights the methodological advancements and validation criteria developed for the Bio-Well system, demonstrating its utility within rigorous research protocols.
Most importantly, our findings show that Bio-Well is not merely an exploratory tool but can serve as a legitimate medical assessment technology when properly applied. The key lies not in using all available parameters indiscriminately, but in selecting the most sensitive combinations based on rigorous statistical validation. This targeted approach opens new possibilities for non-invasive monitoring of treatment efficacy, particularly in integrative medicine settings where subtle physiological changes may precede conventional biomarker responses.
As we continue to bridge the gap between energy medicine and conventional medical science, technologies like Gas Discharge Visualization method—when validated through rigorous methodology—offer valuable insights into the subtle dynamics of human physiology. Our multi-parameter optimization approach provides a template for elevating other frontier technologies from curiosity to clinical utility, ultimately expanding our toolkit for understanding and promoting human health.
References
- Rubik B. The human energy field: A review. Altern Complement Ther. 2002;8(2):65-75.
- Oschman JL. The role of subtle energies in health and well-being. In: Consciousness and the Physical World. Springer; 2015:201-218.
- Rubik B, Muehsam D, Hammerschlag R, Jain S. Biofield science and healing: history, terminology, and concepts. Glob Adv Health Med. 2015;4(Suppl):8-14.
- Korotkov KG. Human Energy Field: study with GDV bioelectrography. Saint-Petersburg: Publishing house “Kultura”; 2002.
- Korotkov KG, Williams B, Wisneski LA. Assessing biophysical energy transfer mechanisms in living systems: the basis of life processes. J Altern Complement Med. 2004;10(1):49-57.
- McCraty R, Atkinson M, Tomasino D, Bradley RT. The coherent heart: Heart-brain interactions, psychophysiological coherence, and the emergence of system-wide order. Integral Rev. 2009;5(2):10-115.
- Korotkov KG, Matravers P, Orlov DV, Williams BO. Application of electrophoton capture (EPC) analysis based on gas discharge visualization (GDV) technique in medicine: a systematic review. J Altern Complement Med. 2010;16(1):13-25.
- Miraglia FE. Unreliability of the gas discharge visualization (GDV) device and the Bio-Well for biofield science: Kirlian photography revisited and investigated. Part I. J Anomalistics. 2024;24.
- Miraglia FE. Unreliability of the Gas Discharge Visualization (GDV) Device and the Bio-Well for Biofield Science: Kirlian Photography Revisited and Investigated. Part II. J Anomalistics. 2025;24.
- Connor CA, Connor MH, Eickhoff J, Horzempa DT, Schmidt K. Investigation into the physiological effects of nanometer light energized water study I. Med Res Arch. 2024;12(11).
- Connor CA, Connor MH, Eickhoff J, Perry M. Investigation into the physiological effects of nanometer light energized water study 2: Physical data. Int J Nurs Health Care Res. 2025;8:1632. doi:10.29011/2688-9501.101632
- Connor CA, Connor MH, Eickhoff J, Perry M. Investigation into the physiological effects of nanometer light energized water study 2: Meridian and Acupuncture data. HSOA J Altern Complement Integr Med. 2025;11:574. doi:10.24966/ACIM-7562/100574
- Connor CA, Connor MH, Eickhoff J, Perry M, Shipione H. Investigation into the physiological effects of nanometer light energized water study 3: Meridian and acupuncture data. HSOA J Altern Complement Integr Med. 2025;11:573. doi:10.24966/ACIM-7562/100573
- Faul F, Erdfelder E, Lang AG, Buchner A. G*Power 3: A flexible statistical power analysis program for the social, behavioral, and biomedical sciences. Behav Res Methods. 2007;39:175-191.
- Bland JM, Altman DG. Measuring agreement in method comparison studies. Stat Methods Med Res. 1999;8(2):135-160.
- Cohen J. Statistical Power Analysis for the Behavioral Sciences. 2nd ed. Hillsdale, NJ: Lawrence Erlbaum Associates; 1988.
- Bianco AC, Dumitrescu A, Gereben B, et al. Paradigms of dynamic control of thyroid hormone signaling. Endocr Rev. 2019;40(4):1000-1047.
- Sinha RA, Singh BK, Yen PM. Direct effects of thyroid hormones on hepatic lipid metabolism. Nat Rev Endocrinol. 2018;14(5):259-269.
- Razvi S, Jabbar A, Pingitore A, et al. Thyroid hormones and cardiovascular function and diseases. J Am Coll Cardiol. 2018;71(16):1781-1796.
- Teixeira PF, Santos PB, Pazos-Moura CC. The role of thyroid hormone in metabolism and metabolic syndrome. Ther Adv Endocrinol Metab. 2020;11:2042018820917869.
- Sinha RA, Yen PM. Metabolic messengers: thyroid hormones. Nat Metab. 2024;6(4):639-650.
- Cicatiello AG, Di Girolamo D, Dentice M. Metabolic effects of the intracellular regulation of thyroid hormone: old players, new concepts. Front Endocrinol. 2018;9:474.
- Anteneodo C, Tsallis C. Multiplicative noise: A mechanism leading to nonextensive statistical mechanics. J Math Phys. 2003;44(11):5194-5203.
- Kanis JA, Johnell O, Oden A, Johansson H, McCloskey E. FRAX and the assessment of fracture probability in men and women from the UK. Osteoporos Int. 2008;19(4):385-397.