


Validation of COVID-19 Survey Data in India
Statistical validation of a large-scale web survey during the COVID-19 pandemic in India
Abhinav Motheram¹, Soumi Roy Chowdhury², Santanu Pramanik¹*
- LEAD at Krea University, New Delhi, India
- IIT Gandhinagar and IIT Vadodara, Gujarat, India
[email protected]
OPEN ACCESS
PUBLISHED: 31 December 2024
CITATION: Motheram, A., Chowdhury, S.R., et al., 2024. Statistical validation of a large-scale web survey during the COVID-19 pandemic in India. Medical Research Archives, Online 12(12).
https://doi.org/10.18103/mra.v12i12.6223
COPYRIGHT: © 2024 European Society of Medicine. This is an open-access article distributed under the terms of the Creative Commons Attribution License, which permits unrestricted use, distribution, and reproduction in any medium, provided the original author and source are credited.
DOI https://doi.org/10.18103/mra.v12i12.6223
ISSN 2375-1924
ABSTRACT
Background: There was an overwhelming demand for data to respond to economic and health emergencies during the COVID-19 pandemic. This forced the remote modes of data collection such as mobile and web surveys to come to the forefront, which was not the case before in many low and middle-income countries, including India. The primary concerns with remote mode surveys are undercoverage of target population and self-selection of the survey respondents resulting in biased estimates.
Methods: Using unit level data from COVID-19 Trends and Impact Survey (CTIS) from India, the largest public health web survey, we examine the bias in the estimates of vaccine uptake, a population measure which changes rapidly with time, particularly right after its roll out in India on 16 January 2021. In the absence of independently verified ‘ground truth’ or ‘gold standard’ for assessing bias in surveys, we discuss the need for statistical representativeness of web surveys and methods of achieving it.
Results: Bias in CTIS estimates of vaccine uptake is not constant over time, rather it increases up to a certain point of time and then decreases. Our findings are explained by the fact that the variability in the outcome of interest in the population first increases with time and then goes downward after more than 50% of the population are vaccinated. The validation of CTIS vaccine uptake estimates was possible as it is one of the rare situations where reliable gold standard measures were available. For another key indicator from CTIS, COVID-like illness (CLI) constructed based on self-reporting of symptoms, it is not trivial to assess the bias in the outcome as the quality of the gold standard is questionable.
Conclusion: Since absence of independently verified ‘ground truth’ or ‘gold standard’ for assessing bias in surveys is well acknowledged, it is crucial to validate statistical representativeness of web surveys with respect to key demographic characteristics of respondents which are often correlated with many outcome variables.
Introduction
Face-to-face surveys as a method of data collection were commonplace prior to the COVID-19 crisis, particularly in developing countries. However, fear of contracting infection and non-pharmaceutical interventions such as physical distancing and mobility restrictions to contain the spread of infection made it infeasible to continue data collection with this mode during the pandemic. At the same time, there was an overwhelming demand for data to respond to economic and health emergencies, this forced the remote modes of data collection such as mobile and web surveys to come to the forefront.
The primary concerns with remote mode surveys are undercoverage of target population and self-selection of the survey respondents resulting in biased estimates¹–³. Large sample sizes, in such surveys, may not protect against bias, rather can make the estimates even more biased as was shown by Bradley et al. (2021)⁴. Surveys having large samples, by definition, lead to precise estimates due to smaller sampling errors; however, that does not mean it would generate accurate estimates in the sense of being closer to the true population quantity. On the other hand, if large surveys result in inaccurate or biased estimates due to undercoverage of target population and self-selection of respondents, then being precise can even be more detrimental as they produce confidence intervals with incorrect centers and substantially underestimated widths⁴. Using the COVID-19 vaccination coverage estimates from three different surveys in the United States, Bradley et al. demonstrated that two of the three surveys with large sample sizes significantly overestimated the vaccine uptake when compared with the US Centers for Disease Control and Prevention (CDC) benchmark figures while the other survey having smaller sample size estimated vaccine uptake quite accurately.
One of the two large surveys used in Bradley et al. paper is COVID-19 Trends and Impact Survey (CTIS). CTIS was conducted by Carnegie Mellon University in the United States and University of Maryland (UMD) in other parts of the world using Facebook active user base aged 18 years and above as the sampling frame⁵⁶. CTIS is the largest public health survey till date being conducted daily in the form of web survey during April, 2020–June, 2022 in more than 200 countries or territories globally⁷. The survey estimates were used widely in research and to formulate public health policy⁸–¹².
Using data from COVID-19 Trends and Impact Survey (CTIS) from India, we examine the bias in the estimates of vaccine uptake, a population measure which changes rapidly with time. Our findings show that the bias in CTIS estimates of vaccine uptake is not constant over time, rather it increases up to a certain point of time and then decreases. In other words, the CTIS estimates of vaccination coverage and the true population measures converge with time, a finding that contradicts the results in Bradley et al. paper which found that the bias has increased over time. Our findings are explained by the fact that the variability in the outcome of interest in the population (‘inherent problem difficulty’ in Bradley et al.’s terminology) first increases with time and then goes downward after more than 50% of the population are vaccinated. The validation of CTIS vaccine uptake estimates was possible as it is one of the rare situations where reliable gold standard was available to compare survey data due to the mandate of self or on-site registration for COVID-19 vaccination. For another key indicator from CTIS, COVID-like illness (CLI) constructed based on self-reporting of symptoms, it is not trivial to assess the bias in the outcome as the quality of the gold standard is questionable. Since the absence of independently verified ‘ground truth’ or ‘gold standard’ for assessing bias in surveys is well acknowledged¹³, we discuss the need for statistical representativeness of web surveys with respect to key demographic characteristics of respondents which are often related to many outcome variables.
Methods
THE COVID-19 TRENDS AND IMPACT SURVEY: A UNIQUE DATA SOURCE IN CHALLENGING TIMES
In the COVID-19 Trends and Impact Survey (CTIS), on a daily basis, randomly selected Facebook (FB) users around the world were invited to self-report Covid-19-related symptoms, experience with Covid-19 tests, contacts with others, mental health and economic security, disruptions in routine health services, vaccination status, vaccine hesitancy, and other related topics. The survey was designed to provide valuable information to help monitor and forecast how Covid-19 may be spreading.
The CTIS data present a unique opportunity to explore the spatio-temporal variation in COVID-19 related indicators in India, particularly at a time when large-scale data collection was challenging. India has traditionally relied on in-person data collection for household surveys; in the absence of reliable sampling frameworks, web surveys have generally been on the sideline¹⁴,¹⁵. CTIS India leverages Facebook’s active user base (FAUB) of over 300 million users¹⁶ as the sampling frame, which gives it a unique advantage. However, since the FAUB may not be representative of the general population at the state and national levels, the dataset includes a survey weight for each respondent so that any weighted analysis based on the CTIS sample can be used for drawing inferences at the level of the target population⁴. The survey was launched on 23 April 2020 in India and continued for more than two years without interruption.
SURVEY DESIGN AND WEIGHTS
CTIS India employed a repeated cross section design to draw new random samples of users daily. In some instances, there were repetitions of survey requests to the same users (particularly in small states in India), but that was treated as a new cross-sectional sample, as opposed to a panel sample. For representativeness at the national level, stratified random sampling design was considered (strata being the states) for selecting the daily samples for India.
To account for the potential biases in survey estimates due to survey nonresponse and exclusion of non-Facebook users from the sampling frame, FB used a two-step weighting procedure. The objective of constructing weights was to provide a weight per survey respondent so that respondents of CTIS better represent the target population of all adults in India⁶. First, non-response bias was minimized by using Inverse Propensity Score Weighting (IPSW) method⁷. Data from sampled individual’s Facebook user profile were fed into the response propensity model to make the respondents more representative of FB users. This exercise was carried out without compromising the privacy of the users who participated in the survey; Facebook does not share user’s profile data with the academic partners of the study, and in turn, the latter do not share individual survey responses with Facebook. Secondly, the coverage bias was minimized by adopting poststratification adjustment of weights¹⁸,¹⁹ with step 1 weights as inputs with the objective of generalizing from FB users to the target population of all adults in India. Poststrata were defined based on age (4 categories: 18–24, 25–44, 45–64, 65+) and gender (2 categories) within each state.
OUTCOMES
Vaccination uptake
Although the original objective of CTIS was to provide valuable information to help monitor and forecast how COVID-19 may be spreading at the early stage of the pandemic, the later versions of CTIS, starting 21 December 2020, include questions on vaccination. The CTIS questionnaire includes two questions on vaccination that can be used for estimating vaccination coverage. Firstly, all respondents were asked whether they have received COVID-19 vaccination with yes, no and don’t know as response choices. Bradley et al. used the responses to this question to estimate the vaccine uptake of at least one dose for CTIS-US. If answered ‘yes’ to the first question, respondents were asked about the number of doses they have received with 1 dose, 2 doses and don’t know as response choices. Based on these two variables,
we have calculated survey weighted daily estimates of vaccine uptake of at least one dose and two doses of vaccination during the time period 16 January to 31 December 2021.
COVID-like illness
Since experiencing symptoms is often a precursor to getting more seriously ill or going to the hospital, a original rationale of CTIS was to help produce a weekly forecast of the hospitalization rates, as well as an early indicator of where the outbreak is growing and where the curve is being successfully flattened. Several studies on symptom tracking and forecasting COVID cases have emerged using CTIS data¹¹,²⁰ and similar symptom surveys¹²,²¹.
In order to track the COVID symptoms, the CTIS asked respondents questions on various symptoms and if they have experienced any of them in the 24 hours prior to taking the survey. The University of Maryland Social Data Science Center constructed an indicator named COVID-like Illness (CLI) based on the positive responses to 3 of these symptoms namely fever, cough, and difficulty breathing and provided daily estimates of CLI on public domain.
Measuring bias in vaccine uptake estimates
To examine the bias in the CTIS estimates for India, we have compared the CTIS estimates with publicly available information in COVID-19 administrative data. While the data on vaccinations was provided upon request through Co-WIN in the form of protected APIs, the aggregated data on COVID-19 cases, deaths and testing is released by the national and subnational governments of India in the form of daily bulletins. These daily bulletins are consolidated by a crowdsourced volunteer group called covid19bharat.org. Data released by covid19bharat.org was widely used and acknowledged as the official source of data for COVID-19 indicators. Similar initiative was undertaken by another crowd-sourcing platform called covid19india.org from the early days of the pandemic up until October, 2021. Their efforts provided the foundation for the work done by covid19bharat.org. We used data from covid19bharat.org to estimate the bias in CTIS vaccination coverage for India as a whole and for Indian states.
Even though CTIS data allowed us to calculate vaccine uptake of only one dose and two doses at a given time point, administrative data did not provide estimates of only one dose of vaccination, given the aggregate number of doses published as official data. Hence, we presented results of vaccine uptake of at least one dose and two doses of vaccination.
Validation of COVID-like illness estimates
We compared the publicly available CLI estimates for India with official COVID-19 cases (administrative data) as collated based on diagnostic tests during the time period 23 April 2020 – 31 December 2021.
Results
BIAS IN VACCINE UPTAKE ESTIMATES
Figure 1 presents the CTIS and official estimates of at least one dose and two doses of vaccination at the national level. The official number of doses are scaled to the eligible target group of people 18 years or above using the Census projections for the year 2021 published by the Government of India²². The scaling factor, as plotted in the right panel, is defined as the ratio of CTIS vaccine uptake estimates to vaccine uptake in administrative data scaled to the adult population. Similar to Bradley et al. (2021), we observe the vaccine uptake as per CTIS to be higher than in the administrative data. While the daily estimates during the initial months of vaccination roll out diverge greatly, the divergence between CTIS and official estimates decreases over time as more adults in the general population are vaccinated. The scaling factors of excess vaccine uptake in CTIS for at least one dose and two doses in March 2021 stood at 8 and 120 respectively. By April-May 2021, the excess vaccine uptake fell to 2 and 15 and continued the downward trend until December 2021.
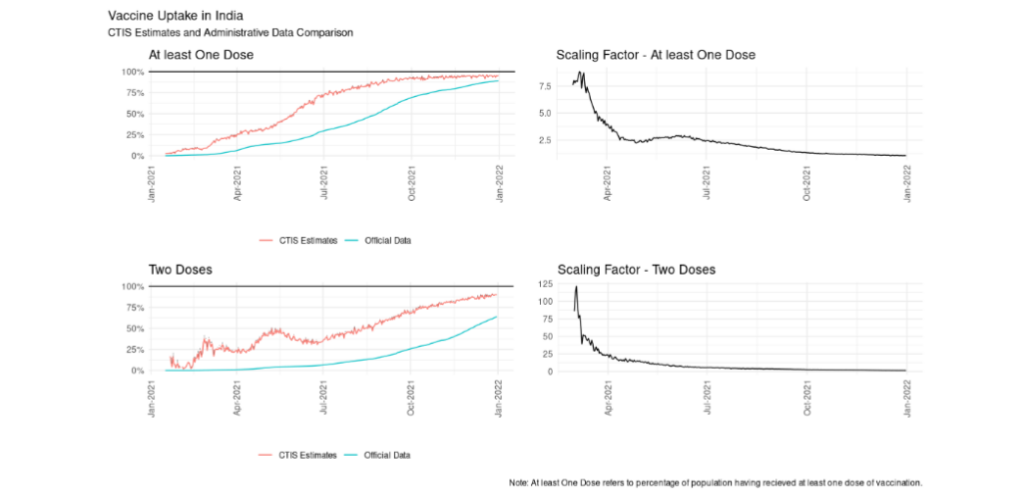
Figure 1: Vaccine Uptake in India – CTIS Estimates and Administrative Data Comparison
The convergence in estimates can be explained by a couple of factors. The COVID-19 vaccination rollout was initially restricted to self-registration on the Co-WIN application. While the registration was extremely useful in gathering information about the vaccinated, this perhaps had an unintended effect of scaling the divergence in vaccination rates between rural and urban areas due to the existing digital divide according to multiple news reports²³,²⁴. Corollary evidence of this can also be viewed from the CTIS microdata. In Figure 2, vaccination rates in rural areas can be seen to be catching up with the urban cities and towns only in the second half of 2021. Here we plot 7-day moving average of CTIS vaccination rates by three types of places of residence; city, town and village/rural area. Vaccine uptake is measured as percentage of adult population receiving at least one dose of vaccination.
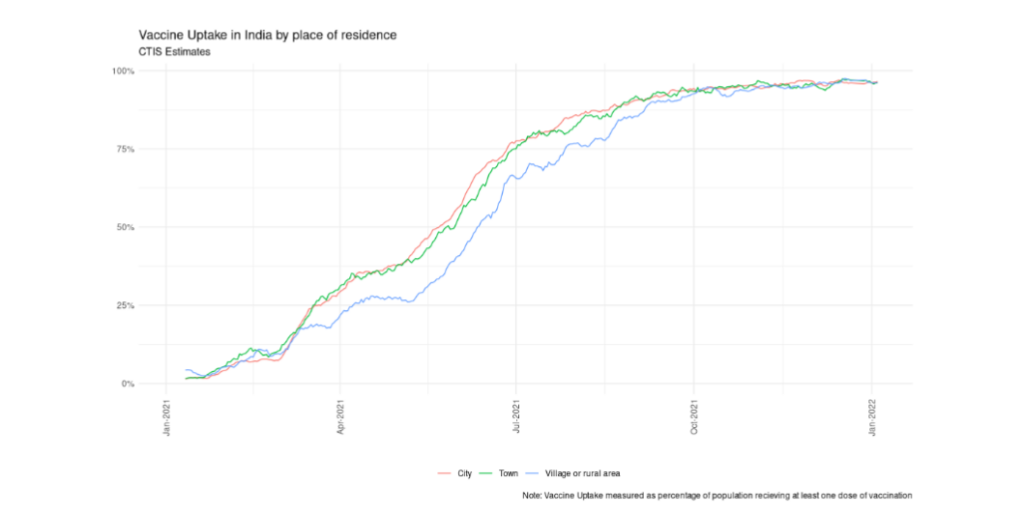
Figure 2: Vaccine Uptake in India by place of residence – CTIS Estimates
At the state level, we observe a similar convergence in trends over time between CTIS and official estimates as plotted in Figure 3. Here vaccine uptake is measured as percentage of adult population receiving at least one dose of vaccination. Due to small or no daily sample in smaller states (by population size), CTIS estimates have missing data on some days. To address that concern, we plot the 7-day moving average of CTIS trends versus official state level vaccination for the select large states (determined by population sizes). For some states, the convergence of estimates is evident where there is near universal coverage of at least one dose in the adult population. The CTIS picks up the official trends in early movers such as Kerala and Madhya Pradesh; these states had 90% coverage of at least one dose by October 2021. But in some other states such as Bihar, Maharashtra, Tamil Nadu, Uttar Pradesh, and West Bengal, CTIS data still overestimated the vaccine uptake even after one year of the vaccine roll out. In almost all the states, the CTIS estimates start higher and plateau earlier than the trends in the official vaccination numbers.
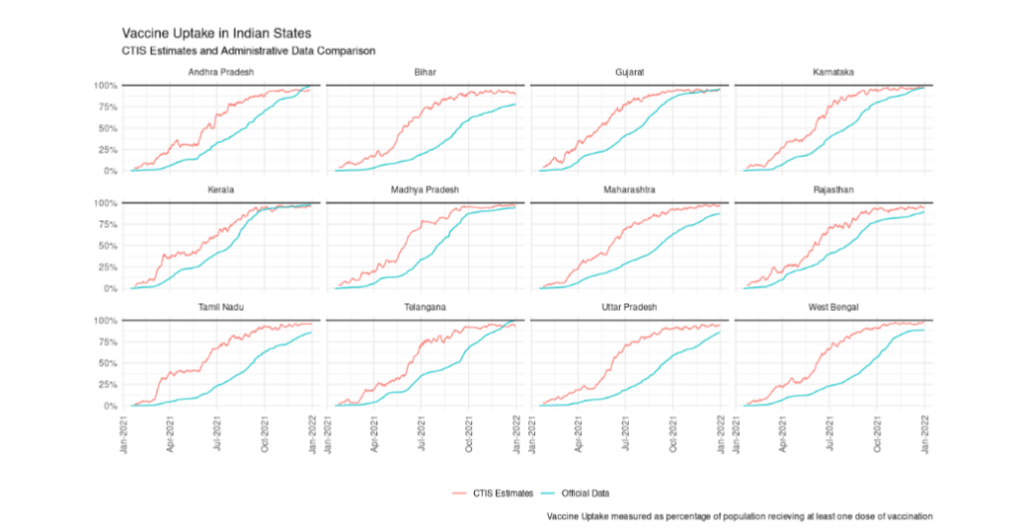
Figure 3: Vaccine Uptake in Selected Indian States – CTIS Estimates and Administrative Data Comparison
VALIDATION OF COVID-LIKE ILLNESS ESTIMATES
In Figure 4, we present the comparison of publicly available CLI estimates for India with official COVID-19 cases as collated based on diagnostic tests during the time period 23 April 2020 – 31 December 2021. The vertical dotted line denotes the emergence of wave-2 in India also known as Delta wave. Bottom left corner panel represents CTIS-CLI estimates. Other panels represent official data of cases, deaths and testing.
During the second wave in India amidst the emergence of delta variant between April-June 2021, both cases and deaths peaked sequentially and then plateaued to a relatively lower level, as per the official data. We see that the 7-day moving average of percentage of respondents with CLI trend mirrors the trend in official cases between April-June 2021. However, while the official number of cases and deaths have collapsed post wave-2 in June 2021, the percentage of respondents with CLI has not. It kept increasing past the official peak, ultimately reaching a peak of nearly 6% in November 2021. We also note that while testing has decreased post wave-2, the decrease is relatively small and perhaps not enough to entirely explain this divergence.
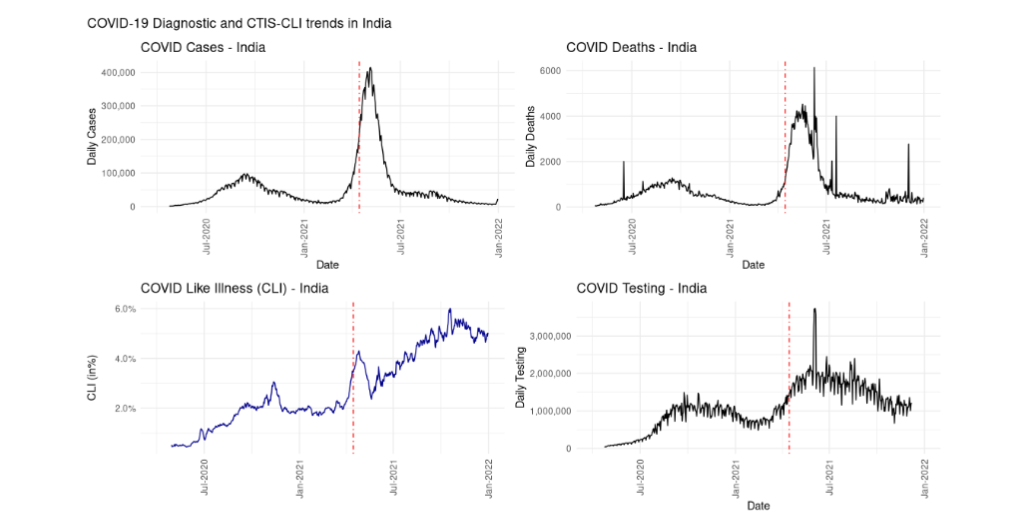
Figure 4: COVID-like illness (CLI) in India – Comparison of CTIS-CLI with COVID-19 Diagnostic Data
In Figure 5, we present the state level CLI trends by northern and southern states. For the ease of presentation, we include Gujarat and Maharashtra as northern and southern states, respectively, because of their relative geographic position, although they lie in western India strictly speaking. We observe that while the 7-day moving average CLI trends for southern states remain steady at relatively low levels, CLI trends in the northern states keep increasing post wave-2 which contributes majorly to the overall national CLI. There are two questions at play here – 1) Why do we see a persistence of trend in the CLI estimates at national level when daily COVID-19 cases have fallen? 2) Why do the northern and southern states exhibit different trends in CLI post wave-2?
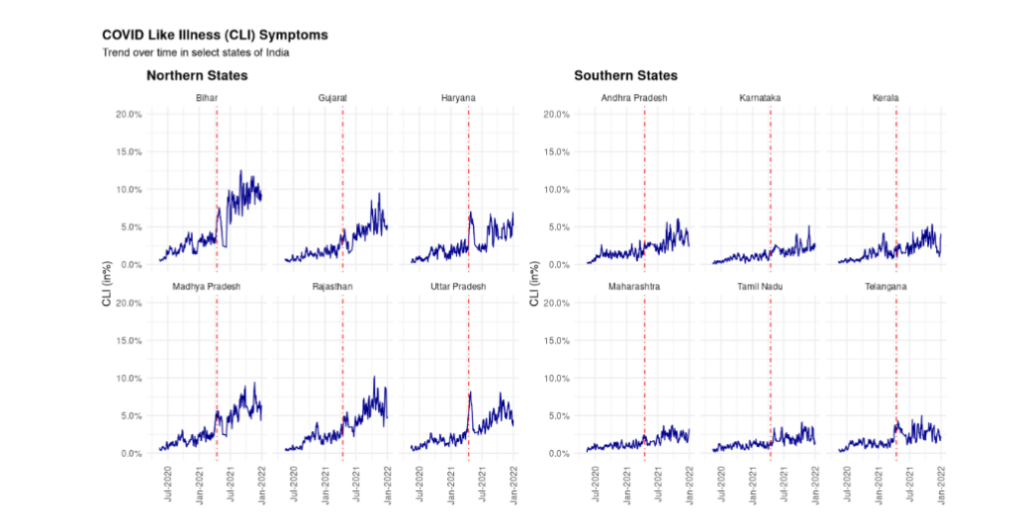
Figure 5: Reported CLI based on CTIS India data – Selected Indian States
One potential hypothesis is the confounding of symptoms between COVID-19 and seasonal flu. Although the symptoms of COVID-19 are similar to those of the seasonal flu, including fever, cough, sore throat, chest pains, and fatigue, the addition of anosmia and dysgeusia, the loss of smell and taste have been shown to be an important indicator of whether an individual has been affected with COVID-19¹. Whether the respondents have had anosmia in 24 hours prior to the interview is one of the symptoms questions asked in the CTIS. In Figure 6, we plot the 7-day moving average of the percentage of respondents who have reported anosmia as a symptom in the selected states and by place of residence. Similar to CLI trends, we see a major divergence in the trends of anosmia by northern and southern states. Decomposition of trend in reported anosmia by place of residence also shows that the increase in reporting post wave-2 has occurred mostly in the village or rural areas.
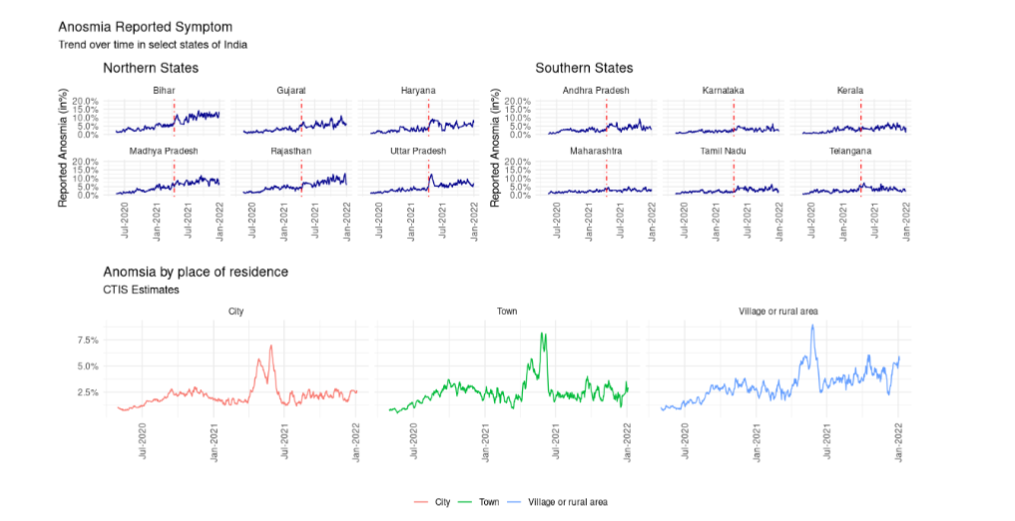
Figure 6: Reported anosmia based on CTIS India data – Selected Indian States and place of residence
Discussion
Early in the COVID-19 pandemic, there was a scarcity of timely information on regional increases in SARS-CoV-2 infections, people’s knowledge, attitudes and practices of COVID appropriate behaviours and the impact of the pandemic on people’s lives. The routine data collection efforts that existed at that time were too slow to meet the data demands for understanding and managing the pandemic¹³,²⁵,²⁶. In India, there were some nimble initiatives²⁷–³³ at the regional level to understand the social and economic effects of the pandemic, but those were not enough to compare the situation over space and time. In that context, alternative data sources like CTIS over a period that is long enough to cover the seemingly never-ending pandemic and across all states of India is a useful resource for research and policy making around the management of the pandemic. However, statistical validation of the representativeness of the sample or the lack of it and its impact on survey estimates is crucial and our paper contributes to that much needed evidence base.
Representativeness of the sample
Table 1 CTIS-India Daily Sample Characteristics: December 1, 2021 is considered as the sample date
CTIS-Unweighted Estimates
Among those who opened the survey request in Facebook
- Incomplete, N = 1,063
- Completed, N = 1,528
CTIS-Weighted Estimates
- Incomplete
- Completed
External benchmark estimates
- Based on 2021 population projection
Gender
- Male: 82 (7.7%), 1,240 (81%) | 6.1%, 55% | 50.9%
- Female: 17 (1.6%), 263 (17%) | 7.6%, 43% | 49.1%
- Prefer not to answer: 2 (0.2%), 16 (1.0%) | 0.2%, 1.6%
- Seen but unanswered: 2 (0.2%), 9 (0.6%) | <0.1%, 0.7%
- Missing: 960 (90%), 0 (0%) | 86%, 0%
Age Group
- 18–24: 21 (2.0%), 287 (19%) | 2.4%, 16% | 18.9%
- 25–34: 37 (3.5%), 594 (39%) | 3.6%, 35% | 24.4%
- 35–44: 17 (1.6%), 314 (21%) | 1.0%, 16% | 20.0%
- 45–54: 12 (1.1%), 167 (11%) | 4.6%, 15% | 15.9%
- 55–64: 4 (0.4%), 104 (6.8%) | 0.6%, 10% | 10.8%
- 65–74: 5 (0.5%), 43 (2.8%) | 0.8%, 6.3% | 6.5%
-
=75 years: 0 (0%), 17 (1.1%) | 0%, 1.3% | 3.4%
- Seen but unanswered: 1 (<0.1%), 2 (0.1%) | <0.1%, 0.1%
- Missing: 966 (91%), 0 (0%) | 87%, 0%
Area of Residence
- City: 44 (4.1%), 833 (55%) | 7.1%, 62% | 34.5%
- Town: 11 (1.0%), 250 (16%) | 1.0%, 15%
- Village or rural area: 26 (2.4%), 441 (29%) | 2.4%, 23% | 65.5%
- Seen but unanswered: 1 (<0.1%), 4 (0.3%) | <0.1%, 0.3%
- Missing: 981 (92%), 0 (0%) | 89%, 0%
* Completed cases are usually considered for analysis of most indicators.
* The Indian Census 2021 population projection report is used as an external benchmark.
* For comparability, gender and age distributions are presented for adults only. However, rural and urban (City + Town) population percentages are calculated based on all ages as age-wise urban and rural population distribution is not available in the population projection report.
Table 1 presents the unweighted and weighted sample characteristics by interview completion status for a randomly selected daily sample from December 1, 2021. We also present the corresponding estimates from Indian Census’ 2021 population projection report as an external benchmark²². We see that the two-step weighting procedure partially corrects the bias in gender and age groups (to a lesser extent) represented in the CTIS samples. For the age group 25–34 years, CTIS-weighted estimates of percentage of Indian adults belonging to this age group are much higher (35%) than the external benchmark (24.4%). This suggests the abundance of FB users in the age group of 25–34 years. When we compare the distribution of adults across four broad age categories which were considered for the poststratification adjustment (18–24, 25–44, 45–64, 65+), the matching of distribution is much better. For example, for the age group 25–44 years, based on the December 1, 2021 sample, the CTIS-weighted and external benchmark estimates are 51% and 44.4%, respectively.
Although the original objective of CTIS was to provide valuable information to help monitor and forecast how COVID-19 may be spreading at the early stage of the pandemic, the later versions of CTIS, starting 21 December 2020, include questions on vaccination. Availability of gold standard data on COVID-19 vaccination coverage allows us to measure the bias in CTIS vaccine uptake estimates. Results indicate that the vaccination estimates from CTIS are inflated compared to the official numbers. There are many potential reasons behind this systematic overestimation. First, the CTIS-India sample is overrepresented by younger, more educated, internet savvy, urban respondents even after correction for survey nonresponse and frame imperfection. Not all relevant demographic characteristics were used as poststratifying variables in the second stage of weighting adjustment. For example, the area of residence (rural or urban), a key determinant of being a FB user in India, is not used in the poststratification adjustment of weights. Majority of the respondents are from cities whereas the proportion of rural population is much higher in India. No attempt has been made to account for this mismatch between sample and population distribution with respect to area of residence; this is likely to skew the estimates towards urban population. The choice of poststratification variables and their levels play an important role in forming a representative sample and producing near-unbiased estimates for outcome of interest as long as poststratification variables are predictive of the outcomes.
Secondly, inclusion of adult respondents in the CTIS sample, satisfying both the criteria of being a FB user and willing to take a web survey, is highly correlated with vaccination status of individuals. The COVID-19 vaccination roll-out was initially restricted to self-registration on the Co-WIN web portal or mobile application. This suggests that the respondents of CTIS are more likely to be vaccinated as it was much easier for them to book appointments for vaccination in the Co-WIN app. The process of exclusion of target population from the sampling frame and the nonresponse mechanism being correlated with the outcome of interest is known as informative sampling and nonignorable nonresponse, respectively, in the survey methodology literature and they are known to produce biased estimates³⁴–³⁶.
The impact of digital divide on vaccination status started to diminish towards the later part of 2021 through introduction of more walk-in vaccination centers, near to home temporary vaccination centers in non-health facility based settings, on-site registration, vaccination at government and private workplaces. The convergence of CTIS and official estimates towards the latter part of 2021 is an artefact of the above-mentioned initiatives by the Ministry of Health and Family Welfare, Government of India which led to similar average vaccine uptake in CTIS sample and general adult population. Some of the initiatives might have been prioritized after the Supreme Court ruling on 2 June 2021 which criticized the vaccination policy for relying exclusively on a digital portal for vaccinating the adult population and warned that the existing policy might fail to achieve universal immunization owing to a digital divide in the country’s infrastructure²⁴.
While assessing the bias in CTIS estimates of vaccine uptake, the official data can be considered as “gold standard” due to the mandate of self or on-site registration on Co-WIN app for COVID-19 vaccination. However, in our second example, where the symptom trends observed in the CTIS diverge from the official estimates, the quality of “gold standard” data is questionable. It is unclear at this moment as to why the percentage of respondents with CLI and anosmia persists at a high level post wave-2. We do not rule out the possibility that it could simply be an artefact of the survey. However, there have been concerns around underestimation of COVID cases and deaths in the official data for various reasons. The Indian Council of Medical Research, the apex body in India for the formulation, coordination and promotion of biomedical research had changed the COVID-19 testing strategy during and post wave-2 to optimize the use of RT-PCR testing and recommended increased use of rapid antigen tests (RATs) particularly in the rural areas where testing facilities are rather meagre³⁷. This might have had implications on the test positivity rates based on several news reports and initial researchers³⁸–⁴¹. Anecdotal evidence suggests people’s unwillingness to get the COVID test done, even in the presence of symptoms, because of fear of institutional quarantine. There is also ongoing research on the persistence of symptoms in long COVID patients⁴²,⁴³, role of absolute humidity and seasonality in the COVID-19 transmission dynamics⁴⁴–⁴⁷. In summary, unlike in the case of vaccination, the official COVID-19 diagnostic numbers cannot be substituted for a gold standard³⁴. However, they are used widely to track the progress of the pandemic despite the shortcomings⁴⁸,⁴⁹. For instance, test positivity rate is a widely used metric which suffers from selection bias in testing and test positivity rates has been documented⁵⁰,⁵¹.
Conclusions
In response to Bradley et al. (2021)⁴, Professor Frauke Kreuter who co-led the Global CTIS writes “The (survey) quality is very difficult to assess, because there is usually no independently verified ‘ground truth’ or ‘gold standard’ with which to compare survey data”¹³. This rings even truer in the context of India and other developing economies where the gold standard estimates are deficient in collecting the required information in some cases, defunct in others or not at all present in some others. Going forwards, it is clear that any research in public health and social sciences has to make use of data coming in all shapes and forms. For surveys with biased samples, novel techniques such as Multilevel Regression and Poststratification (also known as Mister P or MRP) have shown promise in correcting the survey biases⁵². As Professor Kreuter writes, “For certain inferential tasks, surveys with deficiencies can be useful. The usefulness of a data set can be evaluated only in the context of a specific research question”¹³. We agree with one caveat that the survey methods and data including metadata and survey process data (paradata) be made available transparently. This means embracing more openness in all forms – accessibility, availability and less transaction costs in general to acquire the needed information.
Conflict of Interest:
The authors declare no competing interests.
Funding Statement:
This work was supported by Bill and Melinda Gates Foundation [Grant Number INV-003352, INV-009903, INV-010337] through the NCAER National Data Innovation Centre research grant.
Acknowledgements:
We thank Facebook Global Research team members; Katherine Morris, Kris Barkume, Sarah LaRocca, Kelsey Mulcahy for productive conversations about the global CTIS survey, weighting method and the bias in vaccine uptake estimates. We are grateful to Jaya Koti, Project Analyst, NCAER National Data Innovation Centre for calculating external benchmark estimates based on population projection data.
Data Availability Statement
Data used in the analysis come from various sources. CTIS aggregate estimates at state and national levels are obtained from UMD’s Global CTIS Open Data API. CTIS Microdata is made available through UMD’s Global CTIS Microdata Repository to researchers upon request. Separately, an R interface to access UMD’s Open Data and Microdata APIs is made available as an R package (https://github.com/am0505/ctisglobal). While CTIS open data estimates are made publicly available for other countries, we restrict our analysis to India. Administrative data for states and national level in India on COVID-19 is obtained from COVID19Bharat (https://covid19bharat.org/). Data on state and national level population by subgroups is obtained from Population Projections Report by Census of India 2011 (https://nhm.gov.in/New_Updates_2018/Report_Population_Projection_2019.pdf). We restrict the time period of our study to December 2021 as initial reports suggest that the reported symptoms of infections from Omicron variant are perhaps different to that of the other coronavirus variants.
Author contributions
AM, SRC, and SP conceived and formulated the research questions. AM performed CTIS India data analysis and visualization. AM and SP contributed equally to the writing of the paper. SRC reviewed the manuscript, provided critical comments and revised the manuscript. SP supervised the work.
References
2. Tsuboi S, Yoshida H, Ae R, Kojo T, Nakamura Y, Kitamura K. Selection bias of Internet panel surveys: A comparison with a paper-based survey and national governmental statistics in Japan. Asia Pacific Journal of Public Health 2015; 27(2): NP2390-NP9.
3. Rao J. On making valid inferences by integrating data from surveys and other sources. Sankhya B 2021; 83(1): 242-72.
4. Bradley VC, Kuriwaki S, Isakov M, Sejdinovic D, Meng X-L, Flaxman S. Unrepresentative big surveys significantly overestimated US vaccine uptake. Nature 2021; 600(7890): 695-700.
5. Kreuter F, Barkay N, Bilinski A, et al. Partnering with a global platform to inform research and public policy making. Survey Research Methods 2020; 14(2): 159-63.
6. Barkay N, Cobb C, Eilat R, et al. Weights and methodology brief for the COVID-19 symptom survey by University of Maryland and Carnegie Mellon University, in partnership with Facebook. arXiv preprint arXiv:200914675 2020.
7. Pramanik S, Motheram A. India’s COVID-19 Vaccination Drive: Its Relevance in Managing the Pandemic. Contextualizing the COVID Pandemic in India: A Development Perspective: Springer; 2023: 199-223.
8. Adjodah D, Dinakar K, Chinazzi M, et al. Association between COVID-19 outcomes and mask mandates, adherence, and attitudes. PLoS One 2021; 16(6).
9. Babalola S, Krenn S, Rimal R, et al. KAP COVID Dashboard. Johns Hopkins Center for Communication Programs, Massachusetts Institute of Technology, Global Outbreak Alert and Response Network, Facebook Data for Good 2021.
10. Chowdhury SR, Motheram A, Pramanik S. Covid-19 vaccine hesitancy: trends across states, over time. Ideas for India 2021; 16.
11. Salomon JA, Reinhart A, Bilinski A, et al. The US COVID-19 Trends and Impact Survey: Continuous real-time measurement of COVID-19 symptoms, risks, protective behaviors, testing, and vaccination. Proceedings of the National Academy of Sciences 2021; 118(51).
12. Sukumaran R, Patwa P, Sethuraman T, et al. COVID-19 Outbreak Prediction and Analysis using Self Reported Symptoms. arXiv preprint arXiv:2101 10266 2020.
13. Kreuter F. What surveys really say. Nature: News and Views 2021.
14. Couper MP. Web surveys: A review of issues and approaches. The Public Opinion Quarterly 2000; 64(4): 464-94.
15. Couper MP, Miller PV. Web survey methods: Introduction. Public Opinion Quarterly 2008; 72(5): 831-5.
16. Keelery S. Number of Facebook users India 2015-2023. https://www.statista.com/statistics/304827/number-of-facebook-users-in-india/. 2020.
17. Little RJ, Vartivarian S. Does weighting for nonresponse increase the variance of survey means? Survey Methodology 2005; 31(2): 161.
18. Holt D, Smith TF. Post stratification. Journal of the Royal Statistical Society: Series A (General) 1979; 142(1): 33-46.
19. Zhang L-C. Post-stratification and calibration—a synthesis. The American Statistician 2000; 54(3): 178-84.
20. Astley CM, Tuli G, Mc Cord KA, et al. Global monitoring of the impact of the COVID-19 pandemic through online surveys sampled from the Facebook user base. Proceedings of the National Academy of Sciences 2021; 118(51).
21. Menni C, Valdes AM, Freidin MB, et al. Real-time tracking of self-reported symptoms to predict potential COVID-19. Nature medicine 2020; 26(7): 1037-40.
22. National Comission on Population. Population projections for India and States 2011-2036: Report of the technical group on population projections: Ministry of Health and Family Welfare, Government of India New Delhi, 2019.
23. Legal Correspondent. On CoWIN, Supreme Court flags digital divide. Available at https://www.thehindu.com/news/national/on-cowin-supreme-court-flags-digital-divide/article34711169.ece. New Delhi: The Hindu, 2021.
24. Sharma R. India: digital divide and the promise of vaccination for all. Available at https://blogs.lse.ac.uk/southasia/2021/06/28/india-digital-divide-and-the-promise-of-vaccination-for-all/: South Asia@ London School of Economics & Political Science, 2021.
25. United Nations. The need for data innovations in the time of COVID-19. New York: United Nations Statistics Division, 2020.
26. Heggeness M. The need for data innovation in the time of covid-19. Available at https://www.minneapolisfed.org/article/2020/the-need-for-data-innovation-in-the-time-of-covid-19: Policy brief. Opportunity and Inclusive Growth Institute, Federal Reserve Bank of Minneapolis., 2020.
27. NCAER NDIC. Delhi NCR Coronavirus Telephone Survey- Round 1 (April 3-6): Preliminary report. Available online https://www.ncaer.org/image/userfiles/file/NDIC-TEL/DCVTS%20Results%202020-04-12-FINAL.pdf. New Delhi: National Council of Applied Economic Research, National Data Innovation Centre, 2020a.
28. NCAER NDIC. Delhi NCR Coronavirus Telephone Survey- Round 2 (April 23-26): Preliminary report. Available online https://www.ncaer.org/image/userfiles/file/NDIC-TEL/Round-2/NCAER%20May%201%202020%20DCVTS-2%20Presentation.pdf. New Delhi: National Council of Applied Economic Research, National Data Innovation Centre, 2020b.
29. NCAER NDIC. Delhi NCR Coronavirus Telephone Survey- Round 3 (June 15-23): Preliminary report. Available online https://www.ncaer.org/NDIC/DCVTS3%20Report_Final.pdf. New Delhi: National Council of Applied Economic Research, National Data Innovation Centre, 2020c.
30. NCAER NDIC. Delhi NCR Coronavirus Telephone Survey, Round 4 Dec 23, 2020 – Jan 4, 2021. Available at https://www.ncaer.org/image/userfiles/file/DCVTS4/DCVTS4_Presentation.pdf. New Delhi: National Council of Applied Economic Research, National Data Innovation Centre, 2021.
31. Hersh S, Nair D, Komaragiri PB, Adlakha RK. Patchy signals: capturing women’s voices in mobile phone surveys of rural India. BMJ Global Health 2021; 6(Suppl 5): e005411.
32. Totapally S, Sonderegger P, Rao P, Gupta G. The efficacy of government entitlements in helping BPL families navigate the financial impacts of COVID-19. Note to policymakers: Early results from an ongoing survey of 2020; 18.
33. Jaacks LM, Veluguri D, Serupally R, Roy A, Prabhakaran P, Ramanjaneyulu G. Impact of the COVID-19 pandemic on agricultural production, livelihoods, and food security in India: baseline results of a phone survey. Food security 2021; 13(5): 1323-39.
34. Qin J, Leung D, Shao J. Estimation with survey data under nonignorable nonresponse or informative sampling. Journal of the American Statistical Association 2002; 97(457): 193-200.
35. Pfeffermann D, Eltinge JL, Brown LD, Pfeffermann D. Methodological issues and challenges in the production of official statistics: 24th annual Morris Hansen lecture. Journal of Survey Statistics and Methodology 2015; 3(4): 425-83.
36. Pfeffermann D. Bayes-based non-bayesian inference on finite populations from non-representative samples: A unified approach. Calcutta Statistical Association Bulletin 2017; 69(1): 35-63.
37. ICMR. Advisory for COVID-19 Testing During the Second Wave of the Pandemic. Was available at https://www.icmr.gov.in/pdf/covid/strategy/Advisory_COVID_Testing_in_Second_Wave_04052021.pdf. New Delhi: Indian Council of Medical Research, 2021.
38. Maitra P, Shelar, Jyoti and Thevar, Steffi. Reliance on RAT in rural Maha indicates caseload may be higher. Available at https://www.hindustantimes.com/cities/mumbai-news/reliance-on-rat-in-rural-maha-indicates-caseload-may-be-higher-101622661246313.html. Nagpur/ Mumbai/ Pune: Hindustan Times, 2021.
39. Chaba AA. Explained: Can Increasing Rapid Antigen Tests Control Rural Covid-19 Spread in Punjab? Available at https://indianexpress.com/article/explained/punjab-covid-spread-second-wave-antigen-testing-7329121/, 2021.
40. Mehta V, Jyoti D, Guria RT, Sharma CB. Correlation between chest CT and RT-PCR testing in India’s second COVID-19 wave: a retrospective cohort study. BMJ Evidence-Based Medicine 2022.
41. D’Souza S, Shetty R, Kundu G, et al. COVID-19 positivity rate in corneal tissue donors–A cause for concern! Indian Journal of Ophthalmology 2021; 69(10): 2808.
42. Carfì A, Bernabei R, Landi F. Persistent symptoms in patients after acute COVID-19. Jama 2020; 324(6): 603-5.
43. Sudre CH, Murray B, Varsavsky T, et al. Attributes and predictors of long COVID. Nature medicine 2021; 27(4): 626-31.
44. Shaman J, Galanti M. Will SARS-CoV-2 become endemic? Science 2020; 370(6516): 527-9.
45. Liu X, Huang J, Li C, et al. The role of seasonality in the spread of COVID-19 pandemic. Environmental research 2021; 195: 110874.
46. Baker RE, Yang W, Vecchi GA, Metcalf CJE, Grenfell BT. Assessing the influence of climate on wintertime SARS-CoV-2 outbreaks. Nature communications 2021; 12(1): 1-7.
47. Phillips N. The coronavirus is here to stay—here’s what that means. Nature 2021; 590(7846): 382-4.
48. Karlinsky A, Kobak D. Tracking excess mortality across countries during the COVID-19 pandemic with the World Mortality Dataset. Elife 2021; 10: e69336.
49. Serikbayeva B, Abdulla K, Oskenbayev Y. State capacity in responding to COVID-19. International Journal of Public Administration 2021; 44(11-12): 920-30.
50. Wälde K. How to remove the testing bias in CoV-2 statistics. 2020.
51. Díaz-Pachón DA, Rao JS. A simple correction for COVID-19 sampling bias. Journal of theoretical biology 2021; 512: 110556.
52. Wang W, Rothschild D, Goel S, Gelman A. Forecasting elections with non-representative polls. International Journal of Forecasting 2015; 31(3): 980-91.