


VDR Gene Polymorphisms in Northern Eurasia Populations
Distribution of VDR Gene Polymorphisms in Northern Eurasia Populations
Andrey I. Kozlov1, Galina G. Verzhbitskaya2, Elena G. Nagornaya3, Maria M. Voronina4, Vladimir Yu. Pylev5, Elena V. Balanovska6
- Anuchin Research Institute and Museum of Anthropology, Moscow State University, Moscow, Russia;
- National Research University Higher School of Economics, Moscow, Russia;
- Research Center for Medical Genetics, Human Population Genetics Laboratory, Moscow, Russia;
- Biobank of North Eurasia, Moscow, Russia.
OPEN ACCESS
PUBLISHED: 31 October 2024
CITATION: Kozlov, AI., Vershubskaya, GG., et al., 2024. Distribution of VDR Gene Polymorphisms in Northern Eurasia Populations. Medical Research Archives, [online] 12(10).
https://doi.org/10.18103/mra.v12i10.5897
COPYRIGHT © 2024 European Society of Medicine. This is an open-access article distributed under the terms of the Creative Commons Attribution License, which permits unrestricted use, distribution, and reproduction in any medium, provided the original author and source are credited.
DOI https://doi.org/10.18103/mra.v12i10.5897
ISSN 2375-1924
Abstract
Maintaining bone health involves a complex balance of factors, including the intake and absorption of minerals such as calcium and phosphorus. These processes are influenced by the presence of vitamin D and its receptor (VDR). The VDR gene is essential for regulating these processes, and variations in the gene can impact bone density and susceptibility to diseases.
This study aimed to analyze the frequencies of potentially “risky” alleles C*ApaI (rs7975232), G*BsmI (rs1544410), A*TaqI (rs731236) and G*FokI (rs2228570) in ethnic groups of Northeastern Europe, Central and Northern Asia, taking into account their origin and local environmental features (latitude and UV-B radiation). The analysis included 3,464 DNA samples from 96 geographic locations, representing 70 populations.
The study revealed distinct differences in the distribution of VDR polymorphisms between European and Asian populations. In European populations, the frequencies of the G*BsmI and C*ApaI alleles increased with higher latitudes and lower UV-B radiation levels during winter months (Rsp=0.356 and Rsp=0.327, respectively, p<0.05). Conversely, the frequency of the G*FokI allele decreased with higher latitudes and lower UV-B radiation levels (Rsp=-0.537, p<0.001). No significant correlations were observed in Asian populations.
These interpopulational differences in VDR polymorphism frequencies can be attributed to selection pressure to eliminate maladaptive variants. The study concludes that populations in Northeastern Europe, Central Asia, and Northern Asia exhibit significant variation in the frequencies of these potentially “risky” VDR gene alleles.
The results highlight the importance of environmental factor, such as UV-B radiation, in maintaining bone tissue health. Further research is necessary to elucidate the roles of diet and other factors in the metabolic chain ensuring bone health, particularly in understanding the observed ethnic and regional differences.
Keywords
- VDR gene
- polymorphisms
- Northern Eurasia
- vitamin D
- bone health
Introduction
The body’s requirements for mineral elements to maintain bone health are fulfilled through a dynamic balance of several factors. First, the mineral substrate (most importantly calcium and phosphorus) must be ingested and absorbed by the organism. The body’s ability to absorb these minerals depends on the presence of two elements that have identical physiological effects but differ in their evolutionary history and routes of entry: cholecalciferol (D3) synthesized in the skin and ergocalciferol (D2) consumed in food¹. The levels of D2 and D3 metabolites, particularly 25(OH)D (25-hydroxyvitamin D), are commonly interpreted as an indicator of a patient’s vitamin D status²˒³. However, high blood serum 25(OH)D concentrations do not guarantee that tissues will receive sufficient amounts of vitamin D: the metabolite can be transported to target organs only when bound to vitamin D-binding protein (DBP)⁴. Yet DBP may be functionally ineffective if a vitamin D-receptor (VDR) in the target tissue has low sensitivity to the vitamin. On the other hand, increased VDR activity can compensate for the deficiency of other factors⁵.
The activity of this intracellular receptor is controlled by the vitamin D receptor gene (VDR). VDR is located on chromosome 12q13.1; the gene is quite large (over 100 kb in size) and has an extensive promoter region. Single nucleotide polymorphisms (SNPs) in the functional regions of this gene affect the absorption of minerals, including calcium, and consequently the density of bone tissue⁶. VDR allelic variants are distinguished according to their respective endonuclease (restriction) recognition sites. The three following SNPs (among those variants) are of most interest: ApaI (rs7975232), BsmI (rs1544410), and TaqI (rs731236). They are located between exons 8 and 9 and are in non-equilibrium linkage with each other. FokI, another important SNP (rs2228570 previously known as rs10735810), was found within exon 2⁷˒⁸.
The ApaI polymorphism is located in the 3′regulatory region within intron 8 and it is essentially a C→A substitution; C*ApaI is its reference allele. This polymorphism does not have a functional impact because it does not cause a change in the amino acid sequence of the VDR protein⁹. However, there are reports that it may affect messenger RNA (mRNA) stability¹⁰. In addition, research has shown that AC heterozygotes and CC homozygotes have reduced mineral bone density in comparison with AA homozygotes¹¹.
The BsmI polymorphism is also located in the 3′regulatory region and is a G→A substitution (its reference allele is G*BsmI)⁹. It changes the splice sites for mRNA transcription or the intron regulatory elements of VDR¹². According to some studies, the G allele is associated with reduced bone density, increasing the risk of osteoporosis in both women and men, and response to antiresorptive therapy¹²˒¹³.
The TaqI polymorphism occurs within exon 9. It affects mRNA stability and regulation of functions of the final protein. The T allele is associated with age-independent reduced mineral bone density¹¹ and may affect mRNA stability⁹.
The FokI polymorphism is located in exon 2 of the VDR gene and involves a G-to-A point mutation (rs2228570). This mutation affects the start codon of the VDR gene, leading to the translation of two VDR proteins. The A→G substitution results in a shorter VDR A protein with 424 amino acids, whereas the presence of the A nucleotide results in a full-sized protein (427 amino acids) and has higher transcription activity¹⁴. The G*FokI variant is associated with reduced bone density and is more common in Europeans and Asians than in Africans⁷˒¹³. Some authors have reported that FokI polymorphism is also linked to an increased risk of postmenopausal osteoporosis in Asian (but not European) populations¹⁵.
Based on these findings, we make a working conclusion that carriage of CApaI (rs7975232), GBsmI (rs1544410), ATaqI (rs731236), and GFokI (rs2228570) alleles is associated with a decrease in bone mineral density and conditionally consider these alleles as “risky” in relation to
development of osteoporosis and other pathologies of the bone system. From the perspective of evolutionary medicine, interpopulation differences in the presence of these polymorphisms can be regarded as a result of selection pressure to eliminate maladaptive variants. Revealing trends in the prevalence of these alleles in different habitats will provide information for identifying limiting environmental factors and for specifying risk groups in modern populations.
Our study sought to analyze the frequencies of potentially “risky” alleles CApaI (rs7975232), GBsmI (rs1544410), ATaqI (rs731236) and GFokI (rs2228570) in ethnic groups of Northeastern Europe, Central and Northern Asia, taking into account their origin and local environmental features (latitude and UV-B radiation).
Materials and Methods
A total of 3,464 samples contributed by the Biobank of North Eurasia were included in the work. The samples were collected from unrelated indigenous individuals whose ancestors from two previous generations, including grandparents, were members of a studied ethnic group and were descended from the same population. The study was approved by the Ethics Committee of the Research Center for Medical Genetics (protocol No. 1 dated June 29, 2020). The study was conducted in accordance with the principles of human experimentation as defined in the Declaration of Helsinki. Informed consent was obtained from each donor.
The samples were collected at 96 geographic localities, mainly covering the genetic diversity of Northeastern Europe, Central Asia, and Northern Asia (or Northern Eurasia). Most of the samples represent peoples living in the area of the Caucasus Mountains and adjacent territories but whose genesis involved not only the population of Europe, but also some of West and Central Asia. To avoid confusion, we did not use the term “Caucasians” but identified them as populations of European or Asian descent. Ethnic groups related to the studied populations but living in different latitudes and/or under different insolation conditions were considered different populations. Only 70 populations, representing fewer than 20 samples each, were included in the analysis. Among them, we did not divide the groups by populations of European or Asian descent, hereinafter European or Asian groups.
All populations considered in that study are shown and listed in Figure 1. The ordering and numbering of the populations reflect their longitudinal distribution (degrees East, °E).
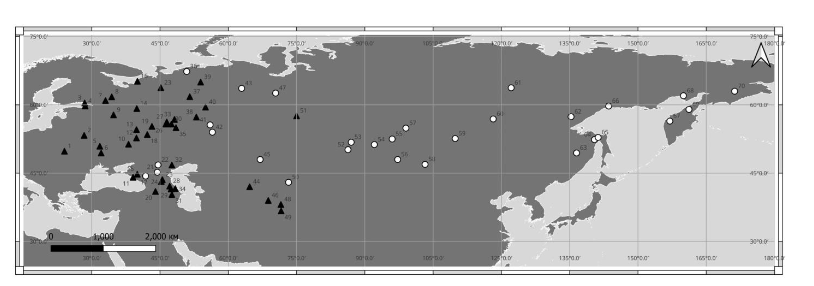
Figure 1. Localization of the surveyed populations.
Note: ▲ – populations of European descent; ○ – populations of Asian descent.
1, 5, 6 – Ukrainians; 2 – Belarusians; 3 – Finns; 4 – Izhorа; 7 – Karelians; 8 – Veps; 9, 10, 12, 13, 14, 16, 23 – Russians; 11, 15 – Adyghe; 17, 21 – Nogais; 18, 19 – Mordvins; 20 – Armenians; 22 – Kalmyk; 24 – Chechens; 25 – Turkmen; 26 – Chuvash; 27, 33 – Mari; 28, 29 – peoples of Dагestan; 31 – Azeri; 32, 35, 51 – Tatars; 34 – Lezgin; 36 – Nenets; 37 – Komi; 38, 39 – Udmurts; 40 – Komi-Permyaks; 41, 42 – Bashkirs; 43 – Mansi; 44 – Uzbeks; 45 – Kazakhs; 46 – Tajiks; 47 – Khanty; 48, 49 – Peoples of Pamir; 50 – Kyrgyz; 52, 53 – Altaians; 54, 55 – Tuvans; 56, 58 – Mongols; 57 – Tofalar; 59 – Buryats; 60, 62 – Evenks; 61 – Yakuts; 63 – peoples of Amur; 64 – Ulchi; 65 – Nivkh; 66, 68 – Evens; 67 – Itelmens; 69 – Koryaks; 70 – Chukchi.
Medium-wavelength UV radiation (280–315 nm), or UV-B, have the most prominent effect on cholecalciferol (D3) synthesis in human skin. Given that the half-life of 25(OH)D is 2–3 weeks¹⁶, three consecutive months during which UV-B radiation levels are the lowest were considered critical in terms of cholecalciferol availability. The mean daily UV-B radiation values during winter months (UV-B_mean; J/m²/day) were obtained from the global UV-B radiation dataset (gIUVI)¹⁷. The data were processed in ArcGIS Pro, and the obtained values were assigned to the corresponding points using the Extract Values to Points (Spatial Analyst) tool.
DNA genotyping was performed using an Infinium iSelect HD Custom BeadChip (Illumina, USA) and an iScan microarray scanner (Illumina, USA). Our custom beadchip included an additional marker of VDR activity. Some data were generated by genotyping genome-wide Illumina panels that were available before this study.
Allele frequencies of the analyzed SNPs were calculated using Python 3 and PLINK 1.9. All computations and data analysis were carried out in Statistica 10.0. The significance threshold was set at the level p = 0.05. Intergroup differences in the frequencies of VDR alleles and genotypes were analyzed using the maximum likelihood chi-square test. Confidence intervals (95% CI) were calculated using the exact Clopper-Pearson method. The Mann–Whitney U test was used to compare allele frequencies between groups.
Results
On the scatterplots of CApaI, GBsmI, GFokI, and ATaqI frequencies at different latitudes, populations of European and Asian descent visibly deviate from each other (Figure 2). Therefore, we analyzed the distribution patterns of VDR alleles in European and Asian groups separately.
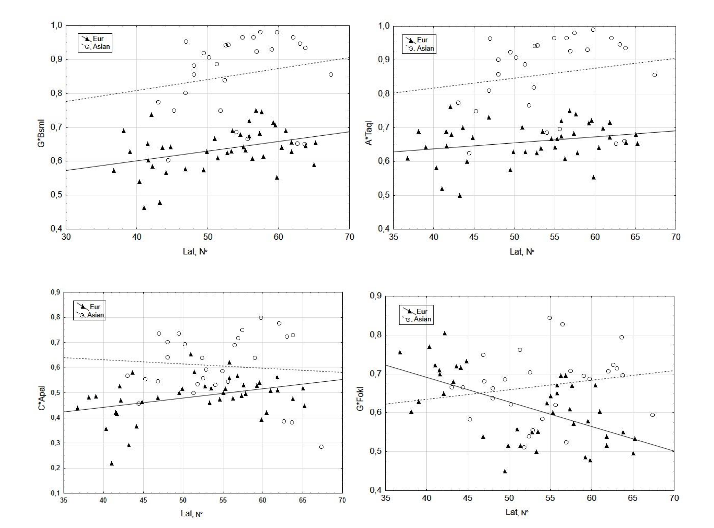
Figure 2. Scatterplots of CApaI, GBsmI, GFokI, and ATaqI allele frequencies at different geographical latitudes of populations.
The frequencies of VDR polymorphisms in the European and Asian groups are presented in Table 1. The Mann–Whitney U test revealed that ATaqI and GBsmI were less common in European (n = 41) than Asian (n = 29) groups; this difference was significant for both alleles (p < 0.00001).
Table 1. Prevalence of VDR polymorphisms in European (n=41) and Asian (n=29) groups of populations and p-values of Mann–Whitney comparison U test
| Median values of polymorphism prevalence | VDR polymorphism | |||
|---|---|---|---|---|
| A*TaqI | G*BsmI | C*ApaI | ||
| in European group of populations | 0.667 | 0.640 | 0.496 | |
| in Asian group of populations | 0.902 | 0.888 | 0.639 | |
| Significance levels of U test | 0.0001 | 0.0001 | 0.0001 |
Note: significant differences (p<0.05) are indicated in bold
However, the correlation between latitude and frequencies of the GBsmI allele (Table 2) was statistically significant only in European populations (Rsp=0.356, p<0.05). The frequencies of the CApaI allele were also lower (p<0.00001) in European group and increased at higher latitudes (Rsp=0.327, p<0.05). No significant correlation was detected between latitude and C*ApaI frequencies in the Asian group of populations.
Table 2. Spearman rank order correlation between frequencies of VDR polymorphisms and latitude (°N)
| Polymorphism VDR | European groups (n=41) | Asian groups (n=29) | ||
|---|---|---|---|---|
| Rsp | p | Rsp | p | |
| A*TaqI | 0.225 | 0.157 | 0.290 | 0.134 |
| G*BsmI | 0.356 | 0.022 | 0.300 | 0.121 |
| C*ApaI | 0.327 | 0.035 | 0.084 | 0.659 |
| G*FokI | –0.537 | 0.001 | 0.283 | 0.145 |
Note: significant correlations (p<0.05) are indicated in bold; Rsp = Spearman rank-order correlation; p = significance level
The difference in GFokI frequencies between the European and Asian groups was not so notable, though this allele was less common in the populations of European descent (p=0.027), similar to ATaqI, GBsmI, and CApaI. However, in contrast to these SNPs, GFokI frequencies increased at higher latitudes in European populations (Rsp=–0.537, p<0.05), i.e., the trend was opposite (Table 2). In the Asian group, the correlation between GFokI frequencies and latitude was statistically insignificant.
Drawing on the statistically significant results (p<0.05), we conclude that the frequencies of GBsmI and CApaI alleles increase from south to north in the populations of European descent, whereas GFokI, by contrast, occurs at higher frequencies in southern regions (the geographic trends of ATaqI frequencies are statistically insignificant). Therefore, the Spearman rank-order correlation values reflect the geographic variation in VDR allele frequencies determined by the latitude of the European region where the population originated. For Asian group of populations, no reliable correlation between the frequency of VDR alleles and latitude was detected.
UV radiation is strongly associated with geographic latitude. The rank correlation for all 96 geographic sites of sample collection was Rsp=–0.98 (p<0.001; n=96), i.e., the higher the latitude, the weaker the radiation. Consequently, the correlations between VDR allele frequencies and mean daily values of UV-B radiation over three months with the least amount of sunlight (Table 3) have the same strength as the correlations between VDR allele frequencies and latitude, but their direction is opposite. A positive correlation between UV-B_mean and G*FokI frequency was observed in the European group of populations (Rsp=0.537, p=0.001; n=41), but it dropped to zero in the Asian
showed significant negative correlations between the mean daily UV-B radiation values during winter months and the frequencies of GBsmI and CApaI polymorphisms (Table 3).
Table 3. Spearman rank order correlation between frequencies of VDR polymorphisms and mean daily of UV-B radiation levels during winter months
| VDR polymorphisms | European group (n=41) | Asian group (n=29) | ||
|---|---|---|---|---|
| Rsp | p | Rsp | p | |
| A*TaqI | -0.206 | 0.196 | -0.286 | 0.140 |
| G*BsmI | -0.338 | 0.030 | -0.293 | 0.130 |
| C*ApaI | -0.320 | 0.042 | -0.095 | 0.631 |
| G*FokI | 0.537 | 0.001 | -0.368 | 0.054 |
Note: significant correlations (p<0.05) are indicated in bold; Rsp = Spearman rank order correlation; p = significance level
Discussion
Figure 2 and Tables 2, 3 show a weak yet significant increase in the frequency of risk alleles GBsmI and CApaI to the north and in regions with low levels of UV-B radiation during winter months (in all cases Rsp=0.3; p<0.05). By contrast, GFokI frequencies exhibit the opposite trend, decreasing to the north and in regions with low UV radiation levels. The rank correlations of GFokI frequencies with geography and climate (Rsp=–0.537, p<0.001 for both parameters) were substantially higher than those of GBsmI and CApaI.
The differences in the strength of associations between the frequencies of VDR polymorphisms and geography and climate are consistent with currently available data. Numerous publications have demonstrated that the FokI polymorphism is an independent VDR gene marker unrelated to BsmI, ApaI or TaqI (review: ⁷). From this perspective, interpopulation differences in the prevalence of VDR allelic variants may be interpreted as a result of selective pressure of different intensities and/or directions.
The absence of significant correlations in Asian group of populations and their presence in European group does not contradict this point of view. Reviews and meta-analyses confirm the lack of similarity in VDR allele frequencies between populations of European, Asian and African origin⁷˒¹⁸˒²⁰. The variation in the distribution of VDR polymorphisms and the strength of associations between VDR alleles and bone tissue development, the risk of osteoporosis and other bone pathologies raises the need for further analyses that may benefit from an ecological approach.
Previously, we demonstrated that the results of case-control studies may vary among populations under different environmental conditions. For instance, the association of GFokI and G polymorphisms with height, body mass, and the amount of bone and muscle tissue in young Komi (far regions of European Northeast)²¹ is consistent with or does not contradict the data obtained for the populations of Sweden²², the Netherlands²³, England²⁴ and Northern France²⁵ but is in discord with the results for the populations of Southern Italy²⁶, Turkey²⁷ and India²⁸ who live in environments with higher UV-B radiation levels and have different dietary habits.
We completely agree with Uitterlinden et al.⁷(p.148), who proposed that “VDR allele frequency differences between ethnic groups most likely result from evolutionary processes and population genetic behavior”. This is also evidenced by paleogenetic data, according to which Eurasian populations of temperate and northern latitudes in the last 8–10 thousand years experienced selective pressure in favor of genotypes determining the increase in sensitivity to UV-B irradiation and the ability to stably assimilate milk as a source of calcium²⁹.
Eastern Europe and Northern Asia corroborate the importance of investigating various adaptation pathways that maintain bone tissue homeostasis. In the Eastern European populations of the temperate climate zone (45–60°N) and high-latitude regions (60–68°N), 25(OH)D concentrations are weakly associated with latitude but strongly associated with the duration of daylight hours (Rsp=0.396, p<0.00001; n=245). Vitamin D levels decline during three winter months, hitting their minimum in February³⁰˒³¹. Consequently, as in the case of VDR, the leading factor is not the “northerness” of the population itself but the level of UV radiation that affects the autosynthesis of cholecalciferol D3. Another important determinant of vitamin D status in northern and high-latitude regions is the availability of food-provided vitamin D2, which depends on dietary habits³²˒³³.
Therefore, the obtained conclusions on D-vitamin status and 25(OH)D concentrations in the groups examined in this study are consistent with population genetic data and indicate an important role of environmental factors and nutrition in the metabolic chain providing maintenance of bone tissue status.
Limitations and Prospects
The fact that we were able to cover a large number of Northern Eurasian populations with the study allowed us to see the specificity of the distribution of potentially “risky” alleles of the VDR gene in groups of European or Asian descent. At the same time, it should be kept in mind that the revealed differences may be mediated by the influence of some other underlying factors, which became apparent when distinguishing European and Asian groups. The search for these factors should be the goal of the future studies.
Conclusion
The populations of Northeastern Europe, Central and Northern Asia exhibit significant variation in the frequencies of the potentially ‘risky’ CApaI, GBsmI, ATaqI, and GFokI alleles of VDR gene.
In the European populations, the frequencies of the GBsmI and CApaI alleles increased to the north and in regions with low levels of UV-B radiation during winter months (Rsp=0.3).
The prevalence of the GFokI allele shows the opposite trend, decreasing to the north and in regions with low UV-B radiation (Rsp=–0.537). Supposedly, under northern conditions, carriage of the GFokI allele resulted in significant bone status disorders and was being eliminated in the course of selection. According to literature data, it can be concluded that in modern populations of European origin, carriage of the G*FokI allele should be regarded as a factor increasing a risk of bone metabolism disorders. In contrast to European populations, no significant correlations were observed between the frequencies of VDR gene polymorphisms, the geographic latitude of population locality, and the mean daily level of UV-B radiation in Asian group. Further research is needed to explain these ethnic and regional differences and test the hypothesis regarding their association with the dietary habits of indigenous populations. The results of the population genetic study are consistent with clinical and laboratory data and confirm the important role of environmental factors in shaping the metabolic chain that ensures bone health. Further research is needed to elucidate the roles of diet and other factors in the metabolic chain that provide the maintenance of bone health, particularly in understanding the ethnic and regional differences observed.
Conflict of Interest
The authors have no conflicts of interest to declare.
Funding
The study was performed within the framework of the research topic “Anthropology of Eurasian Populations (AAAA-A19-119013900163-2)” of the Anuchin Research Institute and Museum of Anthropology of Moscow State University (medical and anthropological studies), and the Research Program of the National Research University Higher School of Economics (NRU HSE), and the State assignment of Research Center for Medical Genetics (genogeographical analysis). The bioinformatics determination of allele frequencies in most populations was supported by the Russian Science Foundation, project no. 21-14-00363 (Balanovska E.V. and Pylev Y.U.).
Acknowledgments
The authors would like to thank all sample donors who participated in this study. The DNA collection was contributed by the Biobank of Northern Eurasia.
References
1. Göring H. Vitamin D in Nature: A product of synthesis and/or degradation of cell membrane components. Biochemistry (Mosc). 2018;83(11): 1350-1357. DOI: 10.1134/S0006297918110056.
2. Lips P. Which circulating level of 25-hydroxyvitamin D is appropriate? J Steroid Biochem Mol Biol. 2004;89-90:611-614.
3. Holick M. Vitamin D deficiency. N Engl J Med. 2007;357:266-281.
4. Daiger S, Schanfield M, Cavalli-Sforza L. Group-specific component (Gc) proteins bind vitamin D and 25-hydroxyvitamin D. Proc Natl Acad Sci USA. 1975;72(6):2076-2080. DOI: https://doi.org/10.1073/pnas.72.6.2076 .
5. Uitterlinden A, Ralston S, Brandi M, et al. The association between common vitamin D receptor gene variations and osteoporosis: A participant-level meta-analysis. Ann Intern Med. 2006;145 (4):255-264.
6. Banjabi A, Al-Ghafari A, Kumosani T, et al. Genetic influence of vitamin D receptor gene polymorphisms on osteoporosis risk. Int J Health Sci (Qassim). 2020;14(4): 22-28.
7. Uitterlinden A, Fang Y, van Meurs J, et al. Genetics and biology of vitamin D receptor polymorphisms: Review. Gene. 2004;338:143-156. DOI: https://doi.org/10.1016/j.gene.
8. Randerson-Moor J, Taylor J, Elliott F, et al. Vitamin D receptor gene polymorphisms, serum 25-hydroxyvitamin D levels, and melanoma: UK case-control comparisons and a meta-analysis of published VDR data. Eur J Cancer. 2009;45(18):327 1-3281. DOI: https://doi.org/10.1016/j.ejca.2009.06.011.
9. Mahto H, Tripathy R, Das B, Panda A. Association between vitamin D receptor polymorphisms and systemic lupus erythematosus in an Indian cohort. Int J Rheum Dis. 2018;21:468-476. DOI: https://doi.org/10.1111/1756-185X.13245
10. Triantos C, Aggeletopoulou I, Kalafateli M, et al. Prognostic significance of vitamin D receptor (VDR) gene polymorphisms in liver cirrhosis. Sci Rep. 2018;8:14065. DOI: https://doi.org/10.1038/s41598-018-32482-3
11. Ansari M, Mohammed A, Wani K, et al. Vitamin D receptor gene variants susceptible to osteoporosis in Arab post-menopausal women. Curr Iss Mol Biol. 2021;43(3):1325-1334. DOI: 10.3 390/cimb43030094.
12. SACN Vitamin D and Health Report. Published July 21, 2016. Accessed August 10, 2024. DOI: https://assets.publishing.service.gov.uk/media/5a804e36ed915d74e622dafa
13. Pakpahan C, Wungu C, Agustinus A, Darmadi D. Do Vitamin D receptor gene polymorphisms affect bone mass density in men?: A meta-analysis of observational studies. Ageing Res Rev. 2022; 75:101571. DOI: 10.1016/j.arr.2022.101571.
14. Arai H, Miyamoto K-I, Taketani Y., et al. Vitamin D Receptor gene polymorphism in the translation initiation codon: Effect on protein activity and relation to bone mineral density in Japanese women. J Bone Mineral Res. 1997;12(6):915–921. DOI: https://doi.org/10.1359/jbmr.1997.12.6.915
15. Marozik P. Tamulaitiene M, Rudenka E, et al. Association of Vitamin D Receptor gene variation with osteoporosis risk in Belarusian and Lithuanian postmenopausal women. Front Endocrinol. 2018;9 :305. DOI: 10.3389/fendo.2018.00305
16. Zerwekh J. Blood biomarkers of vitamin D status. Am J Clin Nutr. 2008;87(Suppl.):1087S-1091S.
17. Beckmann M, Václavík T, Manceur A, et al. glUV: A global UV-B radiation dataset for macroecological studies. Methods Ecol Evol. 2014;5:372–383.
18. Zmuda J. Cauley J, Ferrell R. Molecular epidemiology of vitamin D receptor gene variants. Epidem Rev. 2000;22(2):203-217.
19. Ji G-R, Yao M, Sun C-Y, et al. BsmI, TaqI, ApaI and FokI polymorphisms in the vitamin D receptor (VDR) gene and risk of fracture in Caucasians: A meta-analysis. Bone. 2010;47(3):681-686.
20. Xu G, Mei Q, Zhou D, et al. Vitamin D receptor gene and aggrecan gene polymorphisms and the risk of intervertebral disc degeneration – a meta-analysis. PLoS One. 2012;7:e50243.
21. Kozlov A, Vershubsky G, Ateeva Yu, et al. Association of vitamin D receptor gene with anthropometric measures in Komi ethnic group. Russ J Genet: Appl Res. 2014;4(5):397–404.
22. Grundberg E, Brandstrom H, Ribom E, et al., Genetic variation in the human vitamin D receptor is associated with muscle strength, fat mass and body weight in Swedish women. Eur J Endocrinol. 2004;150:323–328.
23. Fang Y., van Meurs J, Rivadeneira F, et al. Vitamin D receptor gene haplotype is associated with body height and bone size. J Clin Endocrinol Metab. 2007;92(4):1491–1501.
24. Todhunter C, Sutherland-Craggs A, Bartram S, et alP. Influence of IL-6, COL1A1, and VDR gene polymorphisms on bone mineral density in Crohn’s disease. Gut. 2005;54:1579-1584 doi:10.1136/gut. 2005.064212
25. Ye W-Z, Reis A, Dubois-Laforge D, et al. Vitamin D receptor gene polymorphisms are associated with obesity in type 2 diabetic subjects with early age of onset. Eur J Endocrinol. 2001;145:181-186.
26. Ferrara M, Matarese S, Francese M, et al. Effect of VDR polymorphisms on growth and bone mineral density in homozygous beta thalassaemia. Brit J Haematol. 2002;117: 436–440.
27. Özaydin E, Dayangac-Erden D, Erdem-Yurter H, et al. The relationship between vitamin D receptor gene polymorphisms and bone density, osteocalcin level and growth in adolescents. J Pediatr Endocrinol Metabol. 2010;23(5):491–496.
28. Vupputuri M, Goswami R, Gupta N, et al. Prevalence and functional significance of 25-hydroxyvitamin D deficiency and vitamin D receptor gene polymorphisms in Asian Indians. Am J Clin Nutr. 2006;83:1411-1419.
29. Mathieson I, Lazaridis I, Rohland N, et al. Genome-wide patterns of selection in 230 ancient Eurasians. Nature. 2015; 528:499–503. DOI: 10.10 38/nature16152.
30. Kozlov A, Vershubskaya G. Blood serum 25-hydroxyvitamin d in various populations of Russia, Ukraine, and Belarus: a systematic review with elements of meta-analysis. Hum Physiol. 2017;43( 6):135-146.
31. Kozlov A, Vershubskaya G. Systematic review on vitamin D levels in various populations of the Russian North. Hum Physiol. 2019;45(5):565-575.
32. Rejnmark L, Jorgensen M, Pedersen M, et al. Vitamin D insufficiency in Greenlanders on a westernized fare: ethnic differences in calcitropic hormones between Greenlanders and Danes. Calcif Tissue Int. 2004;3:255-263.
33. Kozlov A, Khabarova Yu, Vershubsky G, et al. Vitamin D status of northern indigenous people of Russia leading traditional and ‘‘modernized’’ way of life. Int J Circumpolar Health. 2014;73:26038. DOI: http://dx.doi.org/10.3402/ijch.v73.26038.