

Allosteric Regulation of Pyruvate Kinase in Erythropoiesis
Cutting the Gordian Knot of Iron, Oxygen Radicals, Erythropoiesis, and Red Cell Survival: Allosteric Regulation of Pyruvate Kinase Activity
M. Tarasev 1
- Blaze Medical Devices Inc., Ann Arbor, MI
OPEN ACCESS
PUBLISHED: 31 July 2025
CITATION: Tarasev, M., 2025. Cutting the Gordian Knot of Iron, Oxygen Radicals, Erythropoiesis, and Red Cell Survival: Allosteric Regulation of Pyruvate Kinase Activity. Medical Research Archives, [online] 13(7). https://doi.org/10.18103/mra.v13i7.6749
COPYRIGHT: © 2025 European Society of Medicine. This is an open-access article distributed under the terms of the Creative Commons Attribution License, which permits unrestricted use, distribution, and reproduction in any medium, provided the original author and source are credited.
DOI https://doi.org/10.18103/mra.v13i7.6749
ISSN 2375-1924
ABSTRACT
Iron is an element critical to supporting a wide range of biological functions, chief among them being the support of oxygen transport and cellular respiration. However, iron reduction-oxidation reactions give rise to reactive oxygen species causing oxidative damage. Being both essential and potentially dangerous, iron metabolism from its absorption to utilization in erythropoiesis is tightly controlled. Erythrocyte health and oxygen delivery, reactive oxygen species generation and associated antioxidant activity are all interconnected through a network of feedback loops allowing for dynamic regulation in response to changing body requirements. When tangled by a pathology, this network becomes a real Gordian Knot. Resultant highly variable pathological homeostasis is reviewed with examples of pyruvate kinase (PK) deficiency, hereditary iron overload syndromes, chronic kidney disease, anemia of chronic inflammation, chronic Hepatitis C, beta-thalassemia and homozygous sickle cell disease, and blood transfusion therapy. Emerging understanding of the feedback links between different regulatory systems helps us to cut the metabolic Gordian Knot by tackling the underlying mechanisms of pathology, driving aberrant metabolism towards healthy homeostasis. One such opportunity lies in management of pathology-driven oxidative stress by modulation of the activity of the glycolytic cycle, specifically in the activation of its final energy producing step catalyzed by the pyruvate kinase enzyme. Allosteric regulation of its activity offers an attractive target in multiple therapeutic applications. Most of the evidence of clinical performance of pyruvate kinase activators comes from the work done with mitapivat (Agios Pharmaceuticals), a small-molecule allosteric PK activator that was granted an orphan drug designation by the Food and Drug Administration for PK deficiency, thalassemia, and sickle cell disease. It is currently approved for treatment of PK deficiency in adults and is under review for treatment of thalassemia. A number of other PK activity modulators are currently in development, with different PK isoforms targeted for a range of clinical applications. This potential is rooted in the ability of PK activators to re-activate the glycolytic pathway to generate energy for antioxidation systems, improve glucose utilization, and, in the case of the PK M2 isoform, shift the oligomeric balance away from the form associated with induced transcription of inflammatory cytokines. However, despite extensive research, application of PK activators in clinical practice remains limited. Available clinical evidence and emerging applications are discussed making a case for potential utility of PK activators in a wide spectrum of conditions associated with elevated reactive oxygen species production, increased oxidative stress and inflammation.
Keywords
Pyruvate kinase, Erythropoiesis, Red Blood Cells, Oxygen radical, Iron
THE EUROPEAN SOCIETY OF MEDICINE
Medical Research Archives, Volume 13 Issue 7
RESEARCH ARTICLE
Introduction:
Homeostatic maintenance aims at organism stability while supporting dynamic adjustments that may be required to meet environmental challenges. It is characterized by built-in feedback loops, often with redundancy in operation, allowing for finer control and greater flexibility. In normal physiology, homeostatic regulation maintains concentration and activities of metabolites within optimal narrow ranges, however pathological conditions often create an imbalance, shifting certain metabolites out of their physiological range. Compensatory actions occur resulting in the development of pathological homeostasis. Such new homeostasis may be unstable due to a progressive nature of a pathology and/or inability of regulatory systems to fully compensate for the pathology-induced disruptions.
Reactive Oxygen Species (ROS) arise cumulatively from normal physiology, as a physiological response to a pathological condition or due to a non-physiological factor such as a pathogen. They play an important role as signaling molecules in regulation of a wide variety of physiological functions. As these functions critically depend on ROS concentration, in healthy homeostasis, ROS levels are tightly controlled by multi-level antioxidant activity. While insufficient ROS would disrupt cell signaling pathways, excessive ROS would induce damage to membrane lipids, nucleic acids, and proteins. Such oxidative damage could be a part of a positive feedback loop further promulgating ROS generation. A relevant example is offered by the pyruvate kinase enzyme, where oxidation of cysteine residues in its catalytic domain causes a reduction of its enzymatic activity, which in turn reduces ATP availability for downstream antioxidant activity. Despite the difference in the underlying etiology, oxidative stress resulting from unmitigated ROS generation is viewed as a common denominator for many chronic diseases.
Iron is an element critical to supporting a wide range of biological functions, chief among them is the support of oxygen transport and cellular respiration, however, iron reduction-oxidation reactions can give rise to ROS and oxidative damage. Being both essential and potentially dangerous, iron metabolism is tightly controlled and is aimed at maintaining systemic iron homeostasis. The majority, about 70 percent, of body’s iron is found within Red Blood Cells (RBC) being bound to hemoglobin (Hb). At RBC senescence, Hb is released and iron is effectively recycled, providing over 90 percent of iron used for erythropoiesis. Pathology-related oxidative damage can induce accelerated RBC clearance and/or ineffective erythropoiesis (when elevated erythroid drive is combined with premature destruction of erythroblasts) resulting in anemia. Additionally, such processes place extraordinary demands on iron utilization and ROS neutralization. In a positive feedback loop, oxidative damage could further exacerbate dysregulation of iron homeostasis, e.g., leading to elevation of plasma iron and membrane-bound hemichromes, to feed back to ineffective erythropoiesis and reduced RBC survival in circulation.
In RBC, multiple antioxidant pathways, including the GSH system and the pentose phosphate pathway, exist for control and mitigation of physiologically generated ROS. However, cells still suffer oxidative damage inducing, e.g., membrane remodeling, which is an important factor in RBC senescence and cell clearance from circulation. Erythrocyte metabolic state, and availability of ATP in particular, affects the balance between ROS generation, e.g., due to Hb oxidation, and resultant membrane deterioration, manifested among other properties by changes in deformability and fragility, which are assessable by a variety of experimental methods. Pathology-driven elevation of oxidative stress is often cited as a contributing factor associated with anemia.
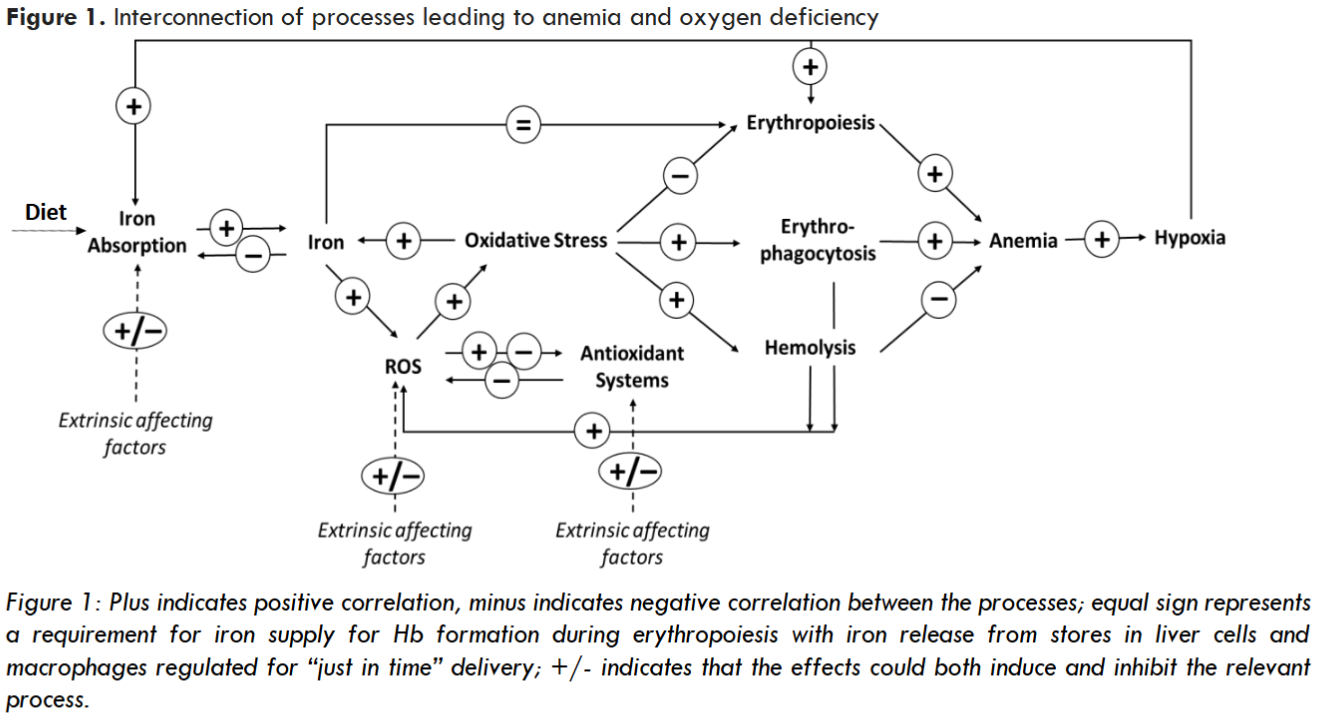
Highly interconnected metabolic processes create a net that is challenging to unravel. Iron absorption and utilization, erythropoiesis, erythrocyte health and blood oxygen carrying capacity, physiologically-generated ROS and associated antioxidant systems are all connected through a network of feedback loops allowing for dynamic regulation in response to changing body requirements. When further tangled by a pathology, this network becomes a real Gordian Knot. Emerging understanding of the feedback links between different regulatory systems allows for treatments that tackle the underlying mechanisms of pathology, in this case iron levels and utilization and oxidative stress, to synergistically drive aberrant metabolism towards healthy homeostasis. One such opportunity may be in modulating activity of the glycolytic cycle, specifically in the activation of its final energy-producing step. In particular, regulation of pyruvate kinase (PK) reaction rates has the potential to cut the proverbial Gordian Knot by targeting the drivers for increased oxidative stress and inflammation. However, despite extensive research, application of PK activity modulators in clinical practice remains limited. Available clinical evidence and emerging applications are discussed making a case for potential utility of PK activators in particular in a wide spectrum of conditions associated with elevated ROC production, increased oxidative stress and inflammation.
Regulation of iron homeostasis:
Absorption:
Intake of iron occurs through the intestinal lumen with only a small fraction of ingested iron being absorbed. Absorption efficiency, and thus the quantity of iron absorbed, depends on the type of diet and presence of absorption enhancers (e.g. ascorbic or citric acids) or inhibitors (e.g. phytates, tannins, or calcium). While iron intake from heme and non-heme sources follows different pathways, iron ends up in the same pool, targeted either for storage or for export into plasma. Iron absorption in duodenal enterocytes is highly regulated, with both body iron stores and oxygen playing a role. The regulation is enabled by a set of oxygen-dependent, iron-containing prolyl hydroxylases (PHD) that hydroxylate target residues on the hypoxia inducible transcription factors (HIF) α-chain, making it susceptible to a follow-up degradation by the von Hippel–Lindau tumor suppressor protein. HIF, and especially HIF-2α, degradation inhibits activation of HIF target genes, including those for duodenal cytochrome B (DCYTB), effecting the reduction of dietary iron from Fe3+ to Fe2+ for its import by a divalent metal transporter 1 (DMT-1). HIF additionally inhibits the transcription for the only known mammalian iron exporter, ferroportin 1 (FPN), which further enhances iron retention in intestinal epithelial cells.
As PHD activity is both oxygen and iron dependent, it is no surprise that there is a similarity in response both to critically low oxygen conditions (hypoxia) and to a decline of body iron storage and plasma iron levels. In both cases, loss of PHD activity supports stabilization of HIF-α with the activation of HIF target genes. Resultant synthesis of DCYTB, DMT-1, and FTP lead to increasing iron influx into plasma. Impact of intracellular iron is dependent on the amount of iron in body stores, resulting in an inverse correlation of such stores and iron absorption. This process is mediated by a liver-produced hormone hepcidin (HEP), one of the key agents in iron metabolism regulation. Under iron-replete conditions, HEP binds to FPN and facilitates its degradation, thus inhibiting iron absorption into enterocytes, and its export into plasma from hepatocytes and macrophages, supporting PHD activation. When iron stores are limited, opposite effects are observed. That makes HEP interaction with FPN key to the body’s managing of iron homeostasis. Elevated iron loading (e.g., high iron amounts in serum or in hepatic storage) and inflammation (e.g., through the action of inflammatory IL6 cytokine) stimulate the transcription of HEP mRNA. Iron deficiency, anemia, hypoxia and elevated erythropoietic drive have the opposite effect of downregulating HEP synthesis. HEP concentrations are further regulated by the saturation level of the main blood iron transporter protein transferrin (Tf) and by the bone morphogenetic protein 6 receptor (BMP-6R).
Storage:
Iron intracellular storage is predominantly by its incorporation into the hollow core of iron storage protein, ferritin (FER). Each FER molecule consists of 24 subunits and retains about 4,500 atoms of iron in its Fe3+ state. FER has ferroxidase activity with iron-free FER (apo-FER) supporting Fe2+ to Fe3+ transition for iron internalization and storage while iron-rich protein allows for Fe3+ extraction as Fe2+ for its subsequent export from the cell. In addition to intracellular FER, small amounts of iron-poor protein are present in blood and can be elevated in the presence of iron overload or inflammation. Presently, serum ferritin is one of the biomarkers used most often for diagnosing iron-related disorders. Despite its utility being a subject of some controversy, commonly, 30 µg/L or less are accepted as an indication of iron deficiency and 1,000 µg/L or more are commonly associated with iron overload.
Transport:
Ferrous iron is exported to blood plasma by the only known mammalian iron exporter ferroportin 1 (FPN) (also known as Ireg1 or Mtp1). Follow-up oxidation to Fe3+ state, required for iron transport through the body, occurs in an oxygen-dependent reaction by hephaestin (HEPH), an enterocyte transmembrane copper ferroxidase. Inhibition of this ferroxidase activity was linked with FPN degradation. Upon conversion to Fe3+ state, iron, in 2 to 1 stoichiometry, can be bound by transferrin. Regulation of expression of HEPH and FPN has been suggested as a possible link between systemic changes in iron stores and body iron requirements with iron absorption. Beside Tf-bound iron, plasma may contain non-transferrin bound iron (NTBI) which is unavailable for erythropoiesis. Such iron can be taken up by non-hematopoietic cells with high propensity for both plasma membrane and intra-cellular oxidative damage. Elevated NTBI levels are often associated with iron overload disorders but may also be present in some other conditions.
Absent pathology, in steady state conditions, dietary iron absorption is sufficient to replace the small quantity of iron (1–2mg/day) lost through desquamation or occasional bleeding. However, erythropoiesis alone requires up to 25 mg of iron per day. Such high body demand for iron is met predominantly through recycling iron scavenged from senescent and hemolyzed Red Blood Cells’ (RBC) heme by macrophages. Post-hemolysis heme oxygenase 1 releases iron from the heme of iron complexes like haptoglobin-hemoglobin and hemopexin-heme either for storage (by ferritin) or transport (by Tf after iron export into plasma through FPN and its oxidation by ceruloplasmin). Uptake of Tf-bound iron is facilitated by the Tf receptor (TfR) on the macrophage membrane, and for NTBI by either a metal transporter like ZIP 14 upregulated in infection or, similar to that in enterocytes, by a combined action of duodenal cytochrome B and divalent metal transporter 1 for ferritin storage or export as Fe2+ by FPN for transport. As with the dietary iron absorption process, iron release from macrophages is regulated by HEP-FPN axis. Additional regulation occurs through combined effects of iron and oxygen through HIFs, which were shown to induce the transcription of key iron metabolism genes, including Tf, TfR and ceruloplasmin.
Physiological saturation of Tf is about 30 percent, with the remaining iron-free apo-Tf providing a buffer to limit accumulation of redox-active iron that may be released into the blood stream. (Tf saturation, over 80%, due e.g. to extraordinary hemolysis leads to accumulation of toxic NFBI, which was shown to significantly contribute to multiple pathologies.) Transferrin binds and transports only about 3 mg of iron at one time, but can still satisfy much higher demand for iron, including that for erythropoiesis, by rapid, less than 2.5 per hour, turnover.
Erythropoiesis:
Iron availability in blood marrow is critical for erythroid cell differentiation and hemoglobin (Hb) synthesis. Iron intake is again mediated through TfR, with its expression parallelling the needs for heme synthesis; the receptors are shed by erythroid cells at later erythropoiesis stages. When RBC production is enhanced, hepcidin downregulation increases both duodenal iron uptake and release of iron from macrophages and liver stores. Another key element is the delivery of kidney-generated hormone erythropoietin (EPO) to activate RBC production. Transcription of EPO is stimulated by iron and oxygen-dependent HIF-2α factor. Translation of HIF-2α mRNA, in turn, is controlled by aconitase-1 (ACO-1), an upstream regulator of erythropoietic activity and iron homeostasis. In normal conditions, EPO stimulates the proliferation and terminal differentiation of burst-forming unit-erythroid cells into colony-forming unit-erythroid cells. These cells express the EPO receptor (EPOR) and depend on EPO for survival and follow-up differentiation into erythroblasts. Reticulocytes and mature RBC do not express EPOR and are not affected by EPO. Notably, the magnitude of response in RBC count to EPO depends more on precursor exposure time to the hormone, and much less on EPO concentration. That stems from the difference between EPO half-life and the lifespan of RBC. Thus, a transient increase in EPO, in response to an even short exposure to hypoxia, can trigger a burst in RBC production with a prolonged increase in RBC count.
While EPO does not seem to have a direct impact on iron availability for erythropoiesis, it is a part of a feedback loop of regulation of iron dietary absorption and its release into plasma from both duodenal enterocytes and macrophages. That connection is mediated through EPO-stimulated secretion of erythroferrone (ERFE), an erythroid regulator of hepcidin production in hepatocytes. During stress erythropoiesis, elevated ERFE synthesis leads to suppression of hepcidin production, which in turn induces FPN driven mobilization of stored iron and promotes absorption of dietary iron. The hypoxia-inducible factor, suggested as a regulator of HEP transcription, also acts as a direct regulator of renal and hepatic EPO synthesis. Thus, HEP systemically coordinates iron homeostasis and erythropoietic activity. In case of iron deficiency, regulatory systems both suppress erythroid cell maturation and “de-motivate” RBC production by decreased generation of EPO along with the decrease in erythroid precursors’ sensitivity to EPO.
Glycolysis and pyruvate kinase
Glycolysis is the primary anaerobic source of energy for most cells and in the presence of oxygen is also the first step in cellular respiration. It starts with glucose oxidation and continues to the generation of pyruvates. The process consumes 2 adenosine triphosphate (ATP) and generates 4 ATP molecules. To sustain the process, in the follow-up pyruvate conversion to lactate, reduced nicotinamide adenine dinucleotide (NADH) is re-oxidized, regenerating NAD. In the last step of glycolysis, conversion of phosphoenolpyruvate (PEP) to pyruvate is catalyzed by the pyruvate kinase (PK) enzyme, the key regulator of lipid metabolism and mitochondrial function. During subsequent steps, in the presence of oxygen, pyruvate is used as an energy source in the mitochondrial respiratory chain through oxidation to generate more ATP; in a low-oxygen environment, it is converted to lactic acid by NADH, with generation of NAD to support the glycolytic cycle. Additionally, the product of the catalytic reaction supported by PK, pyruvate, itself is shown to be a potent scavenger of ROS that are generated in mitochondrial respiration.
Pyruvate kinase (PK): Pyruvate kinase is active as a tetramer that has four isoforms with tissue-specific expression. Type L isoenzyme (PKL) is the main isoform in liver and kidneys. Type M isoenzyme (PKM) exists two forms: PKM1, expressed in energy-demanding skeletal and heart muscles as well as in the brain, and PKM2, an embryonic isoform, which is present nearly in all tissues, and is common in proliferating cells such as platelets and leukocytes. Physiologically, PKM2 may be present in both dimeric and tetrameric forms, with the fast-acting tetramer catalyzing oxidative phosphorylation and the slower dimer functioning as a protein kinase in aberrant glycolysis which is often cancer-related. PKM2 is a minor isoform, also expressed in kidneys. PKM2 is also present in erythroid progenitors, however in the course of erythropoiesis, erythroblasts gradually switch to the R form (PKR) with it being the only PK isoenzyme present in RBC. Cell maturation is associated with the gradual switch from the homotetrameric PKR from (PKR1) in reticulocytes to the heterotetrametric form (PKR2) predominating in mature RBC. It was reported that PKR enzymatic activity decreases with RBC age.
Physiologically, glycolytic rates are controlled both through the transcriptional control of glycolytic enzymes and through allosteric regulation of enzymatic activity. Allosteric regulation of PK activity in particular garnered significant interest as a way to increase ATP production and enhance cell energy balance, offering the opportunity for its use for therapeutic purposes. The rate-limiting step in the glycolic pathway is PEP conversion to pyruvate, with the conversion rate dependent on the oligomeric form of PK enzyme which catalyzes the reaction. Activity of PK types M2, L, and R is regulated through the binding of endogenous allosteric activator fructose 1,6-bisphosphate (FBP), with PKM1 isoenzyme considered non-regulated.
The role PK, and specifically PKM2 isoform, plays in pathologies, including development and propagation of cancer, deserves special consideration. Multiple studies report overexpression of PKM2 in tumors as well as a potentially tissue-specific shift in PK isoforms during tumor formation from PKL, PKR or PKM1, to PKM2. There is a seeming dissonance between PKM2 overexpression and substitution of PKM1 with PKM2 in tumors as well as tumor suppression upon disruption of PKM2 expression on one side, and on the other, the ubiquitous nature of PKM2 and the data showing that PKM2 activation could lead to tumor suppression. However, overexpression of PKM2 in cancer cells does not necessarily imply that it has a causative effect and is not an adaptation employed by fast proliferating cells.
The tetramer form of PKM2 has high binding affinity to FBP and allows for high catalytic activity, thus enabling fast conversion of PEP to pyruvate and ATP generation. In a dimer form, PKM2 has low binding affinity to FBP and low catalytic activity, thus constraining lower glycolysis and increasing the availability of the upstream intermediates for follow-up biosynthesis. Also, in its dimeric form, PKM2 can translocate into the cell nucleus, where it increases the transcription of proinflammatory cytokines. PKM2 dimer, acting as a kinase, supports the Warburg effect in tumor cells.
The balance between PKM2 oligomeric forms can be affected by enzyme mutations and/or post-translational modifications. It is also shifted towards the dimeric form in the presence of inflammation in high-proliferating cancer cells, e.g., by interfering with FBP binding, the balance is shifted towards the low-activity dimeric PKM2. Transition to PKM2 in its dimeric form was observed even in cells that constituently express high activity PKM1 isoform. It was suggested that the shift to low-activity dimeric PKM2 may be associated with the cancer cells’ demand for glycolytic intermediates required for biosynthesis, especially in a low-nutrient environment. Overexpression of PKM2 may then be necessary to fulfil tumor cell energy needs in the face of reduced activity of PKM2 dimers.
Current evidence suggests that it is the dimeric form of PKM2 that plays a key role in tumor progression. Indeed, small molecule exogenous PKM2 activators that stabilized the enzyme tetramer form increased PKM2 enzymatic activity and inhibited proliferation of neoplastic cells and tumor growth. Interestingly, published data indicates that oxidative stress can in turn effect changes in the oligomeric state of PKM2 causing dissociation of PKM2 subunits and/or reduction in stability of subunit aggregates. This could represent another indirect mechanism for pyruvate kinase activators (PKA) to support the stabilization of PKM2 active tetrameric forms. A positive feedback loop may be created between PK oligomeric state and oxidative stress. Increased tetramer to dimer ratio of PK oligomers, e.g. due to PKA treatment, would stimulate antioxidation leading to a reduction in oxidative stress. This in turn would support further PK activation by reducing disruption of PK multimers. Inversely, a pathology driven shift from tetrameric to dimeric PK oligomers would reduce ATP availability for antioxidation, leading to elevation of oxidative stress which, through the feedback loop, would further decrease PK multimeric stability.
Pathological conditions:
Despite superficial similarity of anemia presentation, different etiologies of pathological conditions can lead to vastly different activity of iron and erythropoiesis regulatory pathways, like EPO and HEP, and thus of the observed iron levels.
| β-thal | PKD | CKD | ACI | HbSS | CHC | HFE | TAIO | |
|---|---|---|---|---|---|---|---|---|
| RBC lifespan (days) | Reduced (40) | Varies | Reduced (60) | Varies | Reduced (20) | Normal | Normal | Varies |
| Hemolysis | ↑ | ↑ | ↑ | •/↑ | ↑ | • | ↑ | ↑ |
| Iron status | ↑ | ↑ | ↓ | •/↓ | ↑/↓ | ↑ | ↑ | ↑ |
| Oxidative stress | ↑ | • | ↑ | ↑ | ↑ | ↑ | ↑ | ↓ |
| Antioxidant activity | ↑/↓ | ↓ | ↓ | •/↓ | ↓ | ↓ | • | • |
| EPO | ↑ | ↑ | ↓ | See note | ↑/↓ | ↑ | • | ↑/↓ |
| HEP | ↓ | ↑/↓ | ↑ | ↑ | ↓ | ↑ | ↑/↓ | ↑/↓ |
Key: ↑: elevated or overload; ↓: suppressed or deficiency; ↑↓: varies; •: normal or no significant change; β-thal, β-thalassemia; PKD, private kinase deficiency; CKD, chronic kidney disease; HbSS; homozygous hemoglobin type S sickle cell disease; ACI, anemia of chronic inflammation; HFE, hereditary hemochromatosis (HFE gene); CHC, chronic hepatitis C; EPO, erythropoietin; HEP, hepcidin.
Notes:
- Erythrocyte lifespan in PKD is often cited as short, from a few days to weeks. However, most hemolysis occurs in younger cells, with mature RBC showing much higher resilience to lysis.
- Dependent of the type and/or progress of underlying pathology.
- While iron stores are normal at the initial presentation, an iron deficiency could develop over time with disease progression.
- Could be elevated compared to normal, however an increase in EPO is typically blunted (see text).
- Variable between patients depending on the genetic factors, progression of the disease, or other contributing factors.
- Depends on HFE type, with HEP being deficient in HFE Type 1 and 2 (absolute deficiency or that being relative to the level of iron overload).
- Removal of transfused RBC in a non-linear process with a large fraction hemolyzing shortly after the transfusion. The survival kinetics of transfused cells depends on multiple factors including cell age at collection and transfusion, storage lesion effects, and microenvironment in circulation.
- Published results indicate that both over and under-expression is possible with the presentation being dependent on multiple patient-specific factors.
- Dependent on the patient’s condition and treatment. See text for details.
Pyruvate kinase deficiency (PKD)
Pyruvate kinase deficiency (PKD) is a congenital enzymatic defect of glycolysis restricting adenosine triphosphate (ATP) generation. The disease has heterogeneous presentation with severity and manifestations varying greatly between patients. Enzyme deficiency results in suppressed cellular energy availability through the depletion of generated ATP, in parallel inducing an increase in 2,3-DPG content, a key regulator of hemoglobin-oxygen affinity, thus shifting the oxygen dissociation curve to promote oxygen offloading in the tissues at least in part compensating for anemia. Depletion of available ATP reduces the activity of P-type ATPase pumps causing alteration of ion balance of the cell, leading to RBC dehydration, disruption of membrane structural homeostasis, and premature lysis. It also inhibits synthesis of reducing agents for prevention of oxidative damage.
Erythropoietin levels are commonly elevated with HEP concentration sometimes, but not always, depressed. Overall, the disease is associated with both ineffective erythropoiesis and decreased RBC survival. Reticulocytosis, a common feature of the disease, has been shown to correlate with PK activity, unlike hemolysis or the degree of anemia. Overall, impact of PK deficiency on RBC survival was reported to be heterogeneous, with younger cells being more susceptible to damage. It was suggested that higher ATP requirements of reticulocytes, as compared to mature RBC, make them more sensitive to the diminished ATP generation. Hemolysis and iron overload are commonly observed in patients even with no transfusion.
Beta-thalassemia (β-thal)
Beta-thalassemia (β-thal) is a hereditary blood disorder caused by anomalies in the synthesis of the beta Hb chains. Low stability of unpaired globin chains and degradation of unstable Hb lead to premature destruction of RBC precursors in the bone marrow and to reduced lifespan of RBC in circulation. Reported RBC survival in β-thal patients was about 40 days, compared to 120 days for normal RBC. (Interestingly, hydroxyurea treatment, while elevating fetal Hb (HbF), did not result in increased RBC survival.) The disease is characterized by an expansion of early erythroid precursors (proerythroblasts and earlier) followed by ineffective erythropoiesis. Despite significantly elevated EPO concentrations, erythropoiesis remains inefficient, possibly due to elevated rate of apoptosis of erythroid precursors. Oxidative stress from unstable Hb degradation and iron overload leads to a persistent pro-oxidative state in RBC and can significantly contribute to disease pathology manifestations. While elevation of oxidative stress in β-thal has been observed in all studies, associated changes in antioxidant capacity and activity are subject to controversy. Some authors report an increase in antioxidant capacity, others report no change or a decreased/depleted antioxidant capacity. The reason for the disparities is likely in the phenotypic variability of β-thal, patient condition and treatment, including blood transfusion and iron chelating therapies. Both increase and decrease in antioxidant activity has been attributed to “compensatory” mechanisms in their response to an increase in oxidative stress. While elevation of oxidative stress may stimulate antioxidant generation, high ROS levels may also be depleting the pool of antioxidants, especially if mechanisms for its replenishment are compromised. For example, in RBC of β-thal patients, uncompensated oxidation of glutathione (GSH) may inhibit GSH-dependent reduction of dehydroascorbate, thus limiting the availability of ascorbate, one of the key non-enzymatic antioxidants.
Chronic kidney disease (CKD)
CKD is a condition characterized by a gradual loss of kidney function accompanied by persistent low-grade inflammation. Increased production of proinflammatory cytokines, oxidative stress, chronic and recurrent infections have all been recognized as major contributing factors to CKD chronic inflammatory state. Development of anemia is a common complication in CKD, especially in its advanced stages. In the course of the disease, RBC lifespan is progressively decreased from the normal 120 days down to about 60 days for stage 5 disease. This typically occurs on the background of elevated hemolysis. The main cause for anemia in CKD patients is the reduction in erythropoietin (EPO) production by the failing kidneys. Unlike normal kidneys, where hypoxia induces EPO production through HIF action on hypoxia response element (HRE) of EPO gene, in CKD, HRE is silenced by DNA methylation, with the resultant reduction of HIF binding and thus of EPO transcription. Inflammation and developing iron deficiency have been suggested as additional and significant contributing factors driving the development of anemia. Iron deficiency is common in CKD and was shown to be associated with elevated HEP levels and downregulation of FPT, leading to decrease in dietary iron absorption, impaired iron release from body stores, and its delivery to erythroid precursors. Clinically, iron deficiency is further promoted by elevated iron loss especially for hemodialysis patients. Despite low iron availability and thus low potential for Non-Transferrin Bound Iron (NFBI)-induced ROS formation, CKD typically presents elevated levels of biomarkers of oxidative stress. While chronic inflammation can be promoted by oxidative damage and its byproducts, in CKD, kidney inflammation in turn was suggested as one of the key factors driving oxidative stress, along with the commencement and duration of dialysis, which is a common treatment for the disease with long recognized inflammatory impact. Damage to proteins, lipids, and DNA from overproduction of ROS is further enhanced by a reduced antioxidant capacity due to decreased activity of antioxidant enzymes like superoxide dismutase and glutathione peroxidase, as well as of low molecular weight antioxidants.
Homozygous sickle cell disease (HbSS)
Homozygous sickle cell disease (HbSS) is the most common form of sickle cell disease (SCD), where a single amino acid substitution (glutamic acid to valine at position 6) results in the development of a mutated, type S, hemoglobin (HbS) which replaces beta-globin subunits in Hb. The disease is typically associated with markedly reduced RBC lifespan, down to about 20 days on the background of extraordinary hemolysis. Despite the elevated and chronic hemolysis typically observed in HbSS patients, a recent study reported that for HbSS patients not on blood transfusion therapy, most patients (about 40%) were iron sufficient, with the rest about equally distributed between iron overload and iron deficiency states. The balance can be expected to shift towards the iron overload status in chronically transfused patients. Reported variability in iron state in non-transfused patients underscores the heterogeneity in the disease progression, manifestation and treatment that complicates the analysis.
Oxidative stress has been proposed as the key factor in developing SCD HbSS pathophysiology. Multiple sources of ROS including the action of NAD phosphate oxidases, activation of the xanthine-xanthine oxidase system, and autoxidation of the abnormal HbS which have been extensively reviewed. Extensive ROS formation leads to generation of pro-inflammatory cytokines, endothelial activation, and elevated cell adhesion, creating the pro-inflammatory state characteristic of HbSS. Extracellular heme, arising from large amounts of Hb released due to elevated hemolysis, promotes free radical formation in a positive feedback loop of increasing oxidative stress.
When considering all HbSS patients as one group, without differentiation based on transfusion history, iron status, or erythropoietic activity, various studies report HEP concentrations being lower, equal, or higher than non-SCD controls. EPO levels were also reported to be either elevated in HbSS or significantly decreased. It was suggested that HEP values in HbSS are dependent on multiple factors including erythropoietic drive, condition of iron stores, and inflammation status. Some of those, like the characteristic anemia and intense, even if ineffective, erythropoiesis, would depress HEP production, while others, including HbSS inflammation and elevated iron, would instead induce HEP transcription.
Reticulocyte percentage, an erythropoiesis marker, was shown as the strongest predictor of HEP serum concentration, followed by EPO and the condition of iron stores, as represented by ferritin. Specifically, the highest HEP values were observed in patients with low reticulocyte fraction and low erythropoietin. These results are in line with the report linking HEP levels with the iron state as represented by the presence or absence of iron overload. In that analysis, HbSS patients had similar, if decreased – on average by 40-45 percent – Hb and hematocrit markers, and similar levels of ongoing hemolysis as represented by comparable, and significantly elevated, lactate dehydrogenase (LDH; more than 2-fold compared to control). Despite that, patients without iron overload (moderately elevated ferritin with a mean of 168 ng/mL vs. 40 ng/mL for the control) had decreased HEP levels (mean of 4.2 ng/mL vs 7.2 ng/mL for the control). In contrast, patients with iron overload (mean ferritin of about 2,000 ng/mL) exhibited markedly elevated HEP (mean of 11.6 ng/mL). These findings are consistent with the current understanding of iron’s role in the regulation of its own homeostasis.
Anemia of chronic inflammation (ACI)
Anemia of chronic inflammation (ACI) is one of the most common anemias in the world, is characterized by milder Hb decline (to 8-10 g/dL) and is associated with an activated immune response through elevation of inflammatory cytokines. The disease, despite sufficient iron stores, is associated with a decline in Tf-bound and plasma iron. It was suggested that reduced iron availability could play a defensive role in fighting off infection, e.g., through suppression of iron-dependent DNA synthesis and aerobic respiratory enzymes activity. However, iron being retained by reticuloendothelial macrophages also impairs its delivery for erythropoiesis. While initial ACI presentation is a mild normocytic anemia on the background of normal iron stores, associated impairment of iron absorption could, over time, lead to iron deficiency and impaired intestinal iron absorption associated with the anemia of chronic disease, leading to iron deficiency and microcytic anemia. It has been suggested that elevation of inflammatory cytokines leads to increased HEP concentration, in turn causing FPN inactivation and blocking iron egress from the cells. Resultant low availability of iron for erythropoiesis negatively impacts erythroid progenitor differentiation and RBC production.
Despite the developing anemia, ACI does not seem to be associated with an appropriately robust increase in EPO. This could be due to elevated inflammatory cytokines inhibiting the activity of nuclear proteins regulating hypoxia-driven EPO generation. Cytokine-driven oxidative damage could also reduce the efficacy of EPO-mediated signaling through declined responsiveness of cell EPO receptors manifested in an impairment of bone marrow response to EPO. It has been suggested that oxidative stress may be the real cause of the ongoing chronic inflammation and not the other way around. Antioxidant activity could also be inhibited, at least in some of the related inflammatory-related pathologies. In addition to the inhibition of erythropoiesis, lifespan of RBC is also likely to be reduced through induced erythrophagocytosis and eryptosis, with oxidative stress believed to be one of the main culprits, further contributing to the anemia. Eryptosis could be further aggravated by iron deficiency, a range of pathological conditions including HbSS and β-thal SCD, and certain pathogens. Eryptosis was also reported to be inhibited by EPO, which acts to prolong RBC survival. Decreased RBC lifespan (up to 50 percent; down to 60 days) was observed in many cases. Such a decrease could be associated with elevated hemolysis, however, no extraordinary RBC lysis was detected in other cases. The scope of reduction in RBC lifespan is highly variable between conditions, with smaller decrease and even no observable decrease being reported.
Chronic Hepatitis C (CHC)
Chronic Hepatitis C (CHC) is a highly prevalent liver infection caused by the hepatitis C virus (HCV) and is commonly associated with iron overload. It was shown that virus eradication results in significant decrease in iron load metrics including ferritin, serum iron, and transferrin-iron saturation. Elimination of the infection was reported to resolve abnormal iron metabolism in most HCV patients as manifested by the decline of ferritin and Tf saturation levels to normal levels.
Serum HEP is significantly reduced in HCV positive patients. Down-regulation of HEP synthesis driven by HCV-induced ROS has been proposed as the main force behind HCV-induced iron overload. In parallel, HCV infection is associated with declined cellular concentrations of glutathione (GSH), contributing to development of oxidative stress causing damage to lipids, proteins, and DNA. Elevated ROS production has been associated with the immune response and at the same time with the activity of the virus itself. Overall, oxidative stress occurs in parallel with lower levels of antioxidant activity, closely associated with iron overload status.
The infection does not seem to be associated with anemia or hemolysis with higher levels of endogenous EPO observed in patients with CHC. Some reports indicate that in CHC such EPO response was blunted. Patients with CHC also required less EPO support during hemodialysis therapy. However, anemia, due to drug-induced hemolysis by either commonly used interferon or ribavirin, is a common side effect of the HCV treatment and is commonly ameliorated through an adjuvant therapy with recombinant EPO.
Hereditary iron overload syndromes
Hereditary iron overload syndromes, often collectively referred to as hereditary hemochromatosis (HH), is defined by the development of iron overload due to dysregulation of genes responsible for iron intake and/or further management. An Online Catalog of Human Genes and Genetic Disorders (OMIM), provides 5 different classes of HH based on the disease etiology. In that classification, type 1 HH, which is the most common, refers to the condition arising from a mutation(s) of the HFE gene. The two most common ones are at codons 282 (C282Y; cysteine →tyrosine) and/or 63 (H63D; histidine aspartate). Other classes of HH are also associated with mutations in proteins critical for iron homeostasis, including hepcidin (Type 2), transferrin receptor 2 (Type 3), ferroportin (Type 4), and ferritin (Type 5).
Developing iron overload is typically greater for the more common C282Y homozygotes than for the less commonly encountered H63D. Heterozygotes typically do not present with iron overload. HH Type 1, Type 3 and Type 4 (when associated with high HEP) hemochromatosis typically present iron accumulation in hepatocytes, while types 2 and 3 are associated with systemic iron overload. Macrophage-focused iron overload seems to dominate in Type 4 HH with normal HEP levels.
Anemia is rare in HH patients despite the prevalence of organ dysfunction comorbidities commonly considered as risk factors for anemia development. Existing evidence suggests that HH may have limited direct impact on EPO and may not directly impact EPO synthesis. However, HH may indirectly stimulate RBC production by increasing iron availability to the erythroid tissues, with erythrocytosis being one of the common HH symptoms. It was reported that HEP is undetectable in type 2 HH and its deficiency is a feature of untreated Type 1 and Type 3 HH. Consequently, similar to the other conditions involving iron overload, induction of HEP overexpression and use of HEP agonists had been suggested as possible treatments for Type 1 and Type 2 HH. In contrast, elevated HEP levels were reported in patients with Type 4 HH (ferroportin mutation), specifically in HEP-resistant HH.
Elevated iron levels in HH induce ROS formation and oxidative stress with the accompanying reduction in intrinsic antioxidant activity.
Blood transfusion-associated iron overload (TAIO)
Blood transfusion-associated iron overload (TAIO) is a complication associated with blood transfusions of cold-stored packed RBC (pRBC) which remain one of the main treatments for chronic anemia. Despite providing a boost to patients’ hematocrit and offering an improvement on oxygen delivery, chronic transfusions are associated with iron overload that is typically controlled by using iron chelators. Food and Drug Administration (FDA) guidelines stipulate that packed RBC units should have less than 1 percent hemolysis at the end of storage, and require mean 75 percent recovery, with a one-sided lower confidence limit of 75% at 24 hours post-transfusion. That value is not routinely tested, with reliance on good manufacturing practices and prior validation of storage solution formulations. In practice, pRBC viability varies significantly at the end of storage with the reported recoveries ranging from 60 to 95 percent. Dumont and AuBuchon reported that while most units had recoveries of 75-80 percent, consistent with the FDA benchmark, some units had close to 100 percent recovery rate, and some had 55-65 percent recoveries with the minimum reported value of 36 percent. Additionally, the validation studies are performed in healthy volunteers; in critically ill patients, the 24-hour post-transfusion pRBC survival could be substantially lower.
Notably, removal of transfused pRBCs from circulation is a non-linear process. A fraction of cells (up to 15 percent) is removed within 1 hour post transfusion with a larger fraction (e.g. to 20-22 percent) cleared within the next 4 hours. At 24 hours, the “fast clearance” (up to 25 percent per FDA guidelines; between 1 and 64 percent per observations) is essentially finished. Lifespan of remaining pRBC, while variable, could be expected to be shortened with 20 to 50 percent of the transfused cells remaining in circulation after 30 days. Observed variability in pRBC performance even of units of the same age (same time in storage) is predicated by donor-dependent factors including, among others, the variability in donor RBC metabolic age upon collection and variability in ATP levels.
Survival of pRBC is further affected by variable time in storage and progressive, unit-to-unit variable, deterioration of pRBC properties during storage (storage lesion). Notably, even units with the acceptable (per the FDA) 75% RBC recovery at 24 hours would contribute a quarter of their cells (about 50 mg iron per transfused unit) only to iron overload.
By temporally normalizing oxygen delivery, and alleviating oxygen deficit, transfusions could be expected to reduce hypoxia-induced effects on both erythropoiesis and iron utilization. That would be associated with suppression of the existing compensatory erythropoiesis and decrease in reticulocyte production. Studies of transfusion treatment in different multiple anemia-associated pathologies report an increase in post-transfusion HEP levels concomitant with the decrease in HEP-to-ERFE ratio and EPO concentration, however, such changes seem to be patient and condition dependent. In parallel, while some studies observed significant markers of transfusion-related oxidative stress, no additional oxidative damage was detected by others. This may not be surprising, considering the differences in patient condition and underlying pathology, combined with potentially significant variability in transfused pRBC stability due to donor variability, cell age, and effects of storage lesion.
Clinical evidence
Most of the evidence of PK activators’ clinical performance comes from the work done with mitapivat, a small molecule allosteric activator of PR, specifically of erythrocyte PKR.
In patients with PKD treatment with mitapivat resulted in a decrease in EPO, ERFE, and reticulocytes indicating increase in erythropoietic efficiency. Additionally observed was a decrease in markers of iron overload like Tf saturation, serum Tf, and liver iron concentration. Mitapivat treatment also increased HEP concentration consistent with alleviation of iron overload severity. In a separate study, patients receiving mitapivat exhibited early and sustained improvements in both hematopoietic activity as shown by the reticulocyte percentage and markers of RBC hemolysis, including decreased lactate dehydrogenase (LDH) and bilirubin, and increased haptoglobin. In an in-vitro study on human β-thal erythroblasts, mitapivat improved energy production providing a relief of oxidative stress, translating to improved cell maturation due to a reduction in ROS-induced DNA damage. In SCD patients, treatment with mitapivat led to a decline in hemolysis and was associated with reduction in absolute reticulocyte count and no increase in erythropoietin levels.
In a mouse model of hereditary spherocytosis, mitapivat restored glycolysis and the GSH cycle. Observed reduction of Na/K/Cl cotransport and Na/H-exchange overactivation contributed to improved RBC health correlating with decreased release of erythroid vesicles. Improvement in iron homeostasis was also shown, along with the reduction in iron overload due to the reduction of iron uptake due to downregulation of Dmt1 expression, accompanied by decreased protein oxidation in liver as evidenced by both Perls’ staining and liver iron concentration. Decrease in hemolysis biomarkers like LDH and total bilirubin, and reduced reticulocyte count accompanied observed amelioration of preexisting anemia. In a Townes mouse model of SCD, increased ATP due to mitapivat treatment resulted in decrease in RBC oxidative stress which could have been the proximal cause for the observed decrease in leukocytosis and improvements in RBC maturation. In a β-thal mouse model, mitapivat treatment ameliorated ineffective erythropoiesis, promoting erythroid maturation, decreased apoptosis and anemia. The duodenal Dmt1 expression was also reduced, potentially through the activation of PKM2 in its interaction with HIF-2α, and linked with the reported reduction in liver iron overload and oxidative stress. In β-thal patients, mitapivat treatment reduced hemolysis and improved markers of erythropoiesis supporting its use for treatment of this disease.
Another PKA agent (AG-946) is under development by Agios for treatment of myelodysplastic syndromes. In mouse models it was shown to ameliorate ineffective erythropoiesis by supporting erythroblast maturation, demonstrated by the shift in erythroblast populations from early to late-stage.
Etavopivat (FT-4202), a small‐molecule allosteric activator of PK under development by Novo Nordisk, was also shown to lead to a decline in absolute reticulocyte counts and lower hemolysis, as evidenced by decreased LDH levels which translated into improvements in severe anemia associated with SCD. The treatment induced a reduction of hemolysis markers including LDH and bilirubin, consistent with the observed significant increase in RBC survival.
Discussion and developments
In pathologies where anemia is not associated with iron deficiency, iron overload may preexist, like in HFE. It may also develop over time, like in CHC, further enhanced by chronic transfusions like in, e.g., HbSS or β-thal. While iron overload and elevated oxidative stress each has its own unique drivers, the two conditions also show a strong interdependence. Non-Transferrin Bound Iron arising in iron overload condition, including that due to elevated RBC lysis, is a strong driver of oxidative stress. Regardless of the initial cause, once manifested, iron overload and oxidative stress go hand-in-hand, offering positive feedback to each other. Consequently, inhibition of either one has the potential to also inhibit the other. Iron reduction through phlebotomy was shown to reduce HEP expression, oxidative stress, and lipid peroxidation in CHC patients. Iron chelation therapy also was shown to reduce oxidative stress and associated damage in β-thal patients and reduce oxidative DNA damage in hematopoietic cells.
Oxidative stress, when not appropriately controlled through intrinsic antioxidant activity, can inhibit synthesis of iron homeostasis proteins like HEP, driving abnormal iron accumulation. In parallel, it can induce anemia through extraordinary hemolysis and elevated erythrophagocytosis. Elevated oxidative stress in RBC precursors can also lead to ineffective erythropoiesis – another factor contributing to anemia. Anemia-associated tissue hypoxia can further drive iron absorption as described above. Oxygen deficiency also stimulates EPO synthesis to boost RBC formation. However, an increase in EPO concentration may not generate an appropriate response, if occurring on the backdrop of high rates of oxidative stress-driven apoptosis of erythroid precursors, including erythroblasts and reticulocytes, which may be particularly sensitive to oxidative damage.
In certain pathologies, elevation of oxidative stress may be a primary result of inhibited antioxidant activity, as e.g., in PKD, where decreased ATP production leads to the depletion of GSH, a key reducing agent in RBC. In other pathologies, the primary cause instead may be in elevated ROS generation, as e.g., is likely the case in β-thal SCD. Such can be condition-specific, e.g., elevated ROS generation due to auto-oxidation of HbS observed in HbSS SCD. It can also be due to systemic processes, e.g., being a direct consequence of hemolysis through elevation of cell-free Hb, release of heme and free iron, or a result of a chronic pro-inflammatory state. Thus, it is not surprising that oxidative stress, ubiquitous for anemia-associated pathologies, is a contributing factor to pathophysiology of many, seemingly unrelated conditions.
Management of pathology-driven oxidative stress could be key to cutting the metabolic Gordian Knot, and such a “cut” could be potentially enabled through regulation of PK reaction rates. PK activation, e.g., by extrinsic small molecule activators, can boost the rate of catalysis enhancing utilization of glucose and generation of ATP which can be used for regeneration or recycling of antioxidant molecules. For instance, ATP is required in the glutathione antioxidant system, where it enables the reduction of oxidized glutathione (GSSG) by glutathione reductase back to reduced glutathione (GSH). In the thioredoxin (Trx) antioxidant system, thioredoxin reductase utilizes ATP to reduce oxidized thioredoxin back to its reduced form. Separately, it was reported that ATP can mimic intrinsic peroxidase and catalase activities driving the decomposition of hydrogen peroxide, potentially providing additional protection against reduction of elements of mitochondrial membrane. Reduced availability of ATP due to its limited generation (e.g., through disruption of glycolysis or due to mitochondrial damage) or elevated demand (e.g., due to an elevated antioxidant activity) could become detrimental to cells’ ability to neutralize ROS and maintain healthy homeostasis. Activation of pyruvate kinase, even if its activity had not been impaired, by enhancing ATP production and supporting antioxidant activity, may promote healthy homeostasis. Such direct glycolysis-related effect could be further supported by non-glycolic activity of PR isoforms.
Attention to PK modulation got a significant boost when inhibition of the PKM2 isoform was first proposed as potential cancer therapy. This goal still remains the primary development focus for PK activity modulation. While before 2005 the number of PubMed referenced publications related to cancer was about 20 percent of all publications on clinical use of PK modulators, by 2011 that number reached 40 percent and still remains in 40-50 percent range fourteen years later. Notably, despite PK being a potential target in a wide range of conditions the range of applications in actual clinical development remains somewhat limited. Interestingly, despite the domination of PK-activating drugs in clinical development, research activity appears to be more evenly split between PK activators and inhibitors. Both PKM2 activators like mitapivat or TEPP-46, and inhibitors like shikonin, were shown to have therapeutic potential in cancer treatment. Similarly, both PK activators and inhibitors, working through different mechanisms, could have a therapeutic effect in other pathologic conditions, e.g., in kidney disease or traumatic brain injury. For example, reduction of PKM2-generated fraction of glycolytic metabolites and PKM2-mediated transcriptional activation could be achieved both through inhibition of the enzyme and by inducing its transition into an active tetrameric state. This highlights the complexity of PK activity that extends beyond its glycolysis function and plays significant role in regulating gene expression and cell signaling. Moreover, systemic treatments could potentially be affecting multiple PK variants, both those involved and unrelated to the treated pathology. That could either be a direct result of the intervention, or a compensatory response to the induced changes, e.g., restoration of PKM1 expression upon inhibition of PKM2.
| Condition | Key PK isoform | Therapeutic agent | Effect | Reference |
|---|---|---|---|---|
| Hereditary spherocytosis | PKR | Mitapivat | A | 135 |
| Myelodysplastic syndromes | PKR | AG-946 | A | 141 |
| Pyruvate kinase deficiency | PKR | Mitapivat, Etavopivat | A | 130 |
| SCD: HbSS | PKR | Mitapivat, Etavopivat | A | 133,143 |
| SCD: α and β-thalassemia | PKR | Mitapivat, Etavopivat | A | 165,166 |
| Autoimmune diseases | PKM2 | TEPP-46 | A | 167,168 |
| Acute Lung Injury | PKM2 | ML265 | A | 169 |
| Cancer: Breast cancer | PKM2 | DASA-58, 15n, IMID-2, 7d | A | 170-173 |
| Cancer: Colon | PKM2 | IMID-2 | A | 172 |
| Cancer: Lung | PKM2 | 9b | A | 174 |
| Cancer: Non-small lung cancer | PKM2 | 0089-0022 | A | 175 |
| Cancer: pancreatic | PKM2 | TEPP-46 | A | 176 |
| Cardiovascular: ischemic stroke | PKM2 | TEPP-46 | A | 177 |
| Graft-versus-Host disease | PKM2 | TEPP-46 | A | 178 |
1 Activation (A) or Inhibition (I)
Figure 2. Publications discussing Pyruvate Kinase activation and/or inhibition.
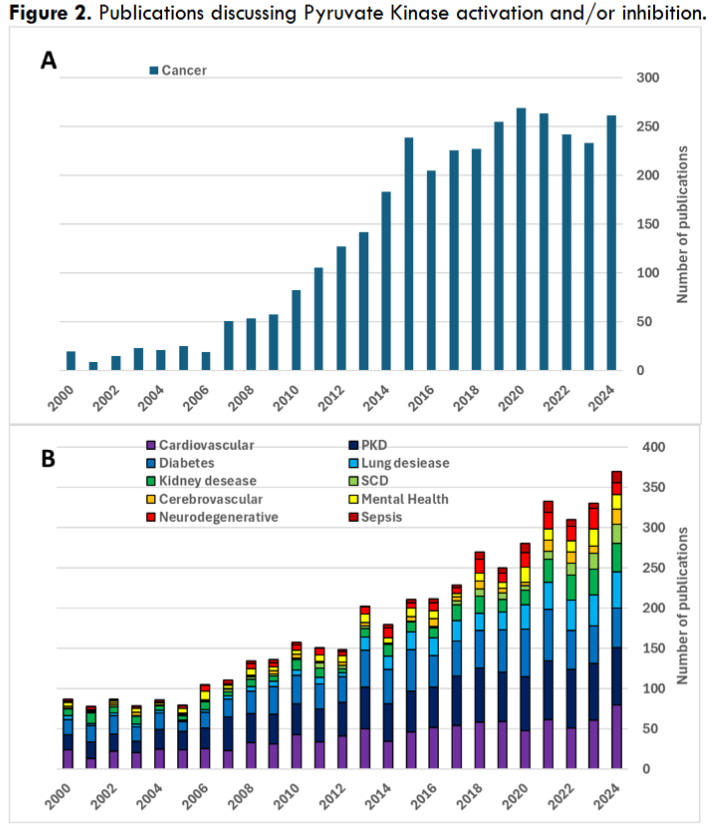
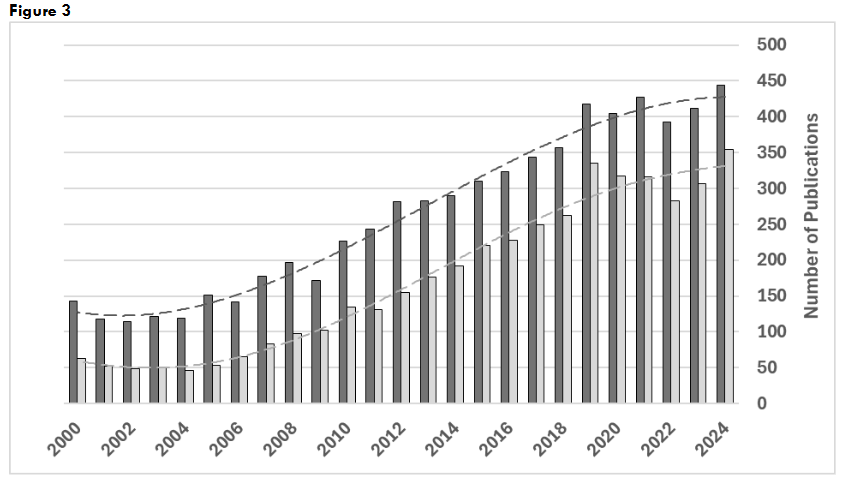
Figure 3: Publications on pyruvate kinase for years 2000-2024. Search results for: “(pyruvate kinase) AND (activator OR activation); “(pyruvate kinase) AND (inhibitor OR inhibition).
Hopefully, interest in research, development, and validation of new clinical application of PK activity modulators may be stimulated by the commercial success of FDA-approved drugs like mitapivat, that are likely to find utility in a progressively increasing range of clinical applications. In recent years, multiple PK activators have been under development for a variety of conditions that involve alteration of cellular metabolism due to pathology, infection, or other exogenic factors. Mitapivat (Agios) is a small molecule which binds in the allosteric pocket of the enzyme stabilizing PK active form and enhancing its affinity for the substrate, PEP. At present, it is the only PK activator approved by the FDA as a treatment for hemolytic anemia in adults with pyruvate kinase deficiency (PKD). Additional studies are underway to expand mitapivat application to sickle cell disease (SCD), including sickle cell anemia (HbSS) and β-thalassemia. Agios development pipeline includes hereditary spherocytosis, hereditary hemolytic anemias, and anemia of low-risk myelodysplastic syndromes (MDS) as goals for their next generation PK activator, AG-946. Including PKM2 as a target for activation, Agios also considers applications in phenylketonuria, renal disease, diabetic retinopathy and nephropathy, hereditary retinal indications, hereditary myopathies, and neurologic conditions.
Etavopivat (Novo Nordisk) is another drug candidate presently in clinical studies for its application in SCD, including transfusion-dependent and transfusion independent SCD (HbSS and thalassemia). Also in the pipeline is its use for treatment of myelodysplastic syndromes.
Despite the wide range of possible clinical targets, presently, primary PKA applications remain in PKD and in SCD conditions. Consequently, clinical studies of PK activation are strongly focused on the PKR isoform in RBC, with the activation being linked to decreased hemolysis and enhanced RBC survival. However, some PKAs are capable of binding and activating multiple PK isoforms. For example, mitapivat can interact not just with PKR, but also with PKL and PKM2. Despite the focus on PKR activation, clinically observed improvements in erythropoiesis in mitapivat treatment could, at least in part, also indicate mediation of oxidative damage in early PKR-lacking erythrocyte progenitors that could occur through PKM2 activation (e.g., activation of PKM2 was proposed for duodenal cells in the β-thal model). Decreased oxidative stress in liver cells was reported for hereditary spherocytosis and β-thal models, potentially through mitapivat-induced activation of PKL isoform. Agios’ pipeline includes development of applications for PKA that are supported by activation of PKM2 isoform even there is no explicit information available regarding mitapivat’s direct effect on PKM2 oligomerization. However, even if binding does not promote PKM2 tetramer stability, altering PK activity through mitapivat could still indirectly influence the oligomeric state of PKM2, as changes in enzymatic activity might impact its interactions with other proteins or regulatory molecules involved in its oligomerization.
Another small molecule PK activator, TEPP-66, was shown to promote transition and stabilization of a tetrameric PKM2 form. It is a highly selective PKM2 activator and exhibits little or no activity towards PKM1, PKR, or PKL isoforms. However, despite being widely used in pre-clinical and animal model studies, its utility in clinic remained to be established.
Conclusion
Activation of PK may be an exciting therapeutic approach with a very wide range of clinical applications. Its utility could be rooted in PKA ability to re-activate the glycolytic pathway generating energy for antioxidation systems, improving glucose utilization, and, at least in the case of PKM2, shifting the oligomeric balance away from dimeric form associated with induced transcription of inflammatory cytokines. That in turn implies that PK activators could potentially find utility in a spectrum of conditions associated with elevated ROC production, increased oxidative stress and inflammation.
Acknowledgement:
The author gratefully acknowledges Kenneth Alfano and Aliya Zaidi for their assistance with the manuscript review.
Disclosure:
The author has nothing to disclose regarding this article.
References
- Finkel T. Signal transduction by reactive oxygen species. The Journal of cell biology. Jul 11 2011;194(1):7-15. doi:10.1083/jcb.201102095
- Cai Z, Yan LJ. Protein Oxidative Modifications: Beneficial Roles in Disease and Health. J Biochem Pharmacol Res. Mar 2013;1(1):15-26.
- Ali SS, Ahsan H, Zia MK, Siddiqui T, Khan FH. Understanding oxidants and antioxidants: Classical team with new players. Journal of food biochemistry. Mar 2020;44(3):e13145. doi:10.1111/jfbc.13145
- Stadtman ER, Levine RL. Free radical-mediated oxidation of free amino acids and amino acid residues in proteins. Amino acids. Dec 2003;25(3-4):207-18. doi:10.1007/s00726-003-0011-2
- Ayala A, Muñoz MF, Argüelles S. Lipid peroxidation: production, metabolism, and signaling mechanisms of malondialdehyde and 4-hydroxy-2-nonenal. Oxidative medicine and cellular longevity. 2014;2014:360438. doi:10.1155/2014/360438
- Jomova K, Raptova R, Alomar SY, et al. Reactive oxygen species, toxicity, oxidative stress, and antioxidants: chronic diseases and aging. Archives of toxicology. 2023/10/01 2023;97(10):2499-2574. doi:10.1007/s00204-023-03562-9
- Slusarczyk P, Mleczko-Sanecka K. The Multiple Facets of Iron Recycling. Genes. Aug 30 2021;12(9). doi:10.3390/genes12091364
- D’Alessandro A, Hansen KC, Eisenmesser EZ, Zimring JC. Protect, repair, destroy or sacrifice: a role of oxidative stress biology in inter-donor variability of blood storage? Blood transfusion = Trasfusione del sangue. Jul 2019;17(4):281-288. doi:10.2450/2019.0072-19
- Izzo P, Spagnuolo A, Manicone A. ASSESSMENT OF ERYTHROCYTE DEFORMABILITY WITH THE LASERASSISTED OPTICAL ROTATIONAL CELL ANALYZER (LORCA). Journal of Biological Research – Bollettino della Società Italiana di Biologia Sperimentale. 02/28 1999;75(1-2). doi:10.4081/jbr.1999.10857
- Alfano KM, Tarasev M, Meines S, Parunak G. An approach to measuring RBC haemolysis and profiling RBC mechanical fragility. Journal of medical engineering & technology. 2016;40(4):162-71. doi:10.3109/03091902.2016.1153741
- Malhotra U, Roy M, Sontakke M, Choudhary P. A recent paradigm on iron absorption, prevalence, and emerging dietary approaches to eradicate iron deficiency. Food Bioengineering. 2023;2(1):53-63. doi:https://doi.org/10.1002/fbe2.12042
- Piskin E, Cianciosi D, Gulec S, Tomas M, Capanoglu E. Iron Absorption: Factors, Limitations, and Improvement Methods. ACS omega. 2022/06/21 2022;7(24):20441-20456. doi:10.1021/acsomega.2c01833
- Lee FS. At the crossroads of oxygen and iron sensing: hepcidin control of HIF-2α. The Journal of clinical investigation. Jan 2 2019;129(1):72-74. doi:10.1172/jci125509
- Saito H. METABOLISM OF IRON STORES. Nagoya J Med Sci. Aug 2014;76(3-4):235-254.
- Charlebois E, Pantopoulos K. Nutritional Aspects of Iron in Health and Disease