

Epicardial Adipose Tissue and Coronary Plaque in RA
Direct and conditional effects of epicardial adipose tissue volume on coronary plaque progression in rheumatoid arthritis
George A Karpouzas¹, Panteha Rezaeian², Elizabeth Hernandez¹, Matthew J Budoff², Sarah R Ormseth¹*
- Division of Rheumatology, The Lundquist Institute for Biomedical Innovation at Harbor-UCLA Medical Center, 1124 West Carson Street, Torrance, CA 90502, USA.
- Division of Cardiology, The Lundquist Institute for Biomedical Innovation at Harbor-UCLA Medical Center, 1124 West Carson Street, Torrance, CA 90502, USA.
Email: [email protected]
OPEN ACCESS
PUBLISHED 28 February 2025
CITATION Karpouzas, GA., Rezaeian, P., et al., 2025. Direct and conditional effects of epicardial adipose tissue volume on coronary plaque progression in rheumatoid arthritis. Medical Research Archives, [online] 13(2). https://doi.org/10.18103/mra.v13i2.6246
COPYRIGHT: © 2025 European Society of Medicine. This is an open-access article distributed under the terms of the Creative Commons Attribution License, which permits unrestricted use, distribution, and reproduction in any medium, provided the original author and source are credited.
DOI https://doi.org/10.18103/mra.v13i2.6246
ISSN 2375-1924
ABSTRACT
Objective. Epicardial adipose tissue volume (EATv) associated with coronary atherosclerosis burden, noncalcified plaque and vulnerable plaque characteristics in patients with rheumatoid arthritis. We here evaluate the influence of EATv on plaque progression and factors that modify this relationship.
Methods. We assessed 100 patients without cardiovascular disease and a screening computed tomography angiography for EATv and coronary atherosclerosis who underwent surveillance evaluation for atherosclerosis progression 6.9±0.3 years later. The main outcome was new plaque formation. Robust multivariable logistic regression evaluated the effect of high versus low EATv (based on median) on likelihood of new plaque formation and the moderating effects of prespecified predictors.
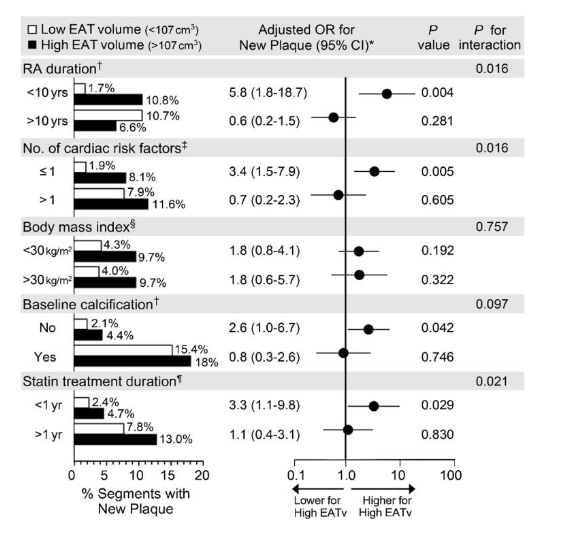
Results. High EATv (>107 cm3) predicted new plaque formation, odds ratio (OR) 2.77 (95% confidence interval [95% CI] 1.43-5.37), however, significance was lost in the multivariable model. High EATv associated with new higher-risk noncalcified and mixed plaque after adjusting for cardiovascular risk score, obesity, segment location, time-averaged C-reactive protein, duration of biologic and statin use and cumulative prednisone dose, adjusted OR 2.57, 95% CI 1.02-6.48. High EATv predicted new plaque in patients with disease duration <10 versus >10 years (adjusted OR 5.75, 95% CI 1.77-18.67), with ≤1 risk factors versus >1 (adjusted OR 3.40, 95% CI 1.46-7.90), those without baseline calcification (adjusted OR 2.65, 95% CI 1.11-6.31) and those with statin treatment for <1 versus >1 year (adjusted OR 3.33, 95% CI 1.13-9.77).
Conclusion. Baseline EATv predicted new higher-risk noncalcified and mixed coronary plaque in rheumatoid arthritis. Notably, EATv conditionally promoted new plaque in patients with earlier disease, low risk factor burden, with no or early atherosclerosis and limited statin exposure. A larger prospective evaluation of EATv as a biomarker of coronary atherosclerosis in rheumatoid arthritis may therefore be warranted.
Keywords: Rheumatoid arthritis, coronary atherosclerosis, epicardial adipose tissue, computed tomography.
Introduction
Patients with rheumatoid arthritis (RA) incur greater coronary atherosclerosis burden and ischemic cardiovascular risk compared to those without autoimmune disease. Atherosclerosis of the larger, epicardial coronary arteries predominantly accounts for this risk. These vessels are embedded within the epicardial adipose tissue (EAT) without an anatomic barrier between arterial adventitia and surrounding fat. Hence, EAT may readily influence coronary atherogenesis in a paracrine or vasocrine manner.
Patients with coronary atherosclerosis display greater inflammatory burden, pro-inflammatory (M1) macrophage polarization and a proatherogenic transcriptional profile of cytokines and adipokines within EAT compared to those without, linked to coronary calcification and noncalcified plaque formation. Coronary segments with high-risk or obstructive plaque are enveloped by larger amounts of EAT. In contrast, intramyocardial coronary segments physically separated from EAT display less atherosclerosis and surgical excision of EAT mitigated atherogenesis in the underlying coronary vessels in animal models. Notably, EAT volume (EATv) associated with high-risk noncalcified plaque, angiographic disease burden, cardiovascular risk, and improved prediction of both obstructive disease and cardiovascular events independently of abdominal visceral adiposity and coronary artery calcium (CAC) in general patients. Likewise, we recently reported that EATv was linked to greater coronary plaque burden, multivessel or obstructive disease, noncalcified plaque and vulnerable plaque characteristics in patients with rheumatoid arthritis (RA). The relationship was stronger in nonobese patients, those with earlier disease (<10 years), and in the absence of traditional, reversible cardiac risk factors and coronary calcifications.
Epicardial adipose tissue volume was also linked to coronary atherosclerosis progression; increasing coronary plaque burden yielded enhanced cardiovascular risk independently of baseline atherosclerosis in general patients. On the other hand, plaque size stabilization was linked to cardiovascular risk reduction. It is unclear whether EATv affects plaque progression or cardiovascular risk in RA. In the present study we explored the association of EATv with coronary atherosclerosis progression in patients with RA and whether prespecified moderators such as disease duration (>10 versus ≤10 years), traditional risk factor load (≤2), presence of coronary calcifications (CAC>0 vs. CAC=0) and duration of lipid lowering therapies (≤1 versus >1 year) influenced this relationship.
Materials and Methods
PATIENT RECRUITMENT
The study sample included 100 patients from our previously described PROspecTive Evaluation of Latent Coronary ATherosclerosis in Rheumatoid Arthritis (PROTECT-RA) cohort with screening EATv and coronary atherosclerosis evaluation who underwent surveillance plaque assessments 6.9±0.4 years later. Enrolled patients were 18 to 75 years old, satisfied 2010 classification criteria for RA and had no diagnosis of cardiovascular disease including angina, acute coronary syndrome, transient ischemic attack, stroke, peripheral arterial disease, revascularization, or heart failure. Patients were excluded if they had concurrent autoimmune diseases, a body weight greater than 147.7 kg (maximal scanner bed capacity), had malignancy within the past five years, active or chronic infections, iodine allergy or glomerular filtration rate <60 mL/min. All participants signed informed consent and the study was approved by the local institutional review board in compliance with the declaration of Helsinki.
EPICARDIAL ADIPOSE TISSUE VOLUME AND CORONARY ATHEROSCLEROSIS EVALUATIONS
Screening evaluations occurred upon enrollment between March 2010 and March 2011 and surveillance assessments between March 2017 and March 2018, in a 256-multidetector row scanner (GE Healthcare). Protocols describing image acquisition and processing, including grading reproducibility were previously reported. Epicardial adipose tissue measurements and CAC assessments according to Agatston were carried out in noncontrast scans. Epicardial adipose tissue was measured on the axial slices of non-contrast studies with GE Advantage Windows 4.6 workstations, by an experienced reader (PR), blinded to plaque measurements, RA clinical assessments and treatments. Epicardial adipose tissue was quantified as the fat between the heart surface and the visceral pericardium, starting 10 mm above the upper end of the left main artery ostium to the last slice that contained pericardium. The pericardium was manually traced every 2-3 slices, and the software automatically outlined the segments between selected slices. Fat was defined as a Hounsfield Unit (HU) threshold of -190 to -30 HU. Epicardial adipose tissue volume was reported as the sum of all voxels (cubic centimeters) containing fat across the prespecified boundaries. Plaque assessments were carried out on contrast-enhanced scans by another experienced interpreter blinded to EAT measurements and clinical data (MB), and based on a standardized 17-segment American Heart Association model. Baseline and follow-up studies for each participant were reviewed concurrently and in random order. Longitudinal comparisons of change in atherosclerosis burden were performed after coalignment of coronary segments utilizing fixed anatomic landmarks as fiducial points. Numbers of coronary segments with plaque (0-17) per patient were quantified. Plaque composition was reported as noncalcified, mixed, or fully-calcified, as described elsewhere.
COVARIATES AND OUTCOMES
The Framingham general cardiovascular risk score was calculated for all participants at baseline. Obesity was defined as BMI>30kg/m2 at screening. Disease activity was calculated based on a 28-joint count examination for tenderness and swelling and C-reactive protein (DAS28-CRP) at every clinic visit. Treatments including prednisone, methotrexate, other conventional synthetic disease modifying anti-rheumatic drug (DMARDs), bDMARD, and statins along with doses were verified on every clinic visit and cross-referenced against pharmacy records. Time-averaged CRP was calculated for each patient by adding the mean CRP values between consecutive measurements multiplied by the time interval between sequential measurements and up time. The main outcome of interest was new plaque formation (any, noncalcified, mixed and fully-calcified) in coronary segments without plaque at baseline.
STATISTICAL ANALYSIS
Continuous variables were summarized as means and standard deviations (SDs) and categorical variables were reported as frequencies and percentages. Epicardial adipose tissue volume was dichotomized based on median (107 cm3) and defined as high if >107 cm3 or low if ≤107cm3. Robust multivariable logistic regression models were used to evaluate the association of baseline EATv (high versus low) with any new plaque, noncalcified, mixed and fully-calcified plaque formation upon surveillance assessments in coronary segments without plaque at baseline. Per-segment models used a robust variance estimator (Huber-White Sandwich) to account for clustering of segments within individual patients. The significance of interactions was tested by adding the cross-product term of EATv and each subgrouping variable into the robust logistic regression model, adjusting for covariates as aforementioned. The significance level was set at 0.05 for main effects and 0.1 for analyses assessing effect modification. Analyses were performed using SPSS 27.0 and Stata 15.0.
Results
Of 150 patients enrolled in our originally described PROTECT-RA cohort with baseline coronary atherosclerosis evaluation, 102 underwent surveillance plaque assessments 6.9±0.4 years later. Of the 48 that did not, two died, four had no follow-up beyond baseline, six migrated, and 36 declined to participate. In two patients EATv was not calculated. Therefore, 100 patients without missing data were included in the analysis. Patient characteristics stratified by surveillance CCTA status are reported in Supplementary table S1. Patients undergoing follow-up CCTA were younger, had fewer tender joints and lower cardiovascular risk score compared to those that did not. However, these differences lost significance after adjusting for age. Patients were mostly middle-aged females with established, seropositive and erosive disease. Table 1 outlines patient characteristics stratified by EATv. All participants were treated with conventional synthetic DMARDs (78% methotrexate) and 63/100 (63%) additionally received tumor necrosis factor-alpha inhibitor bDMARDs at baseline. Throughout follow-up, 75 (75%) patients received bDMARDs (including non-TNFi), 47 (47%) prednisone, and 53 (53%) statins.
| Demographics | Low EAT volume (n=50) | High EAT volume (n=50) | p |
|---|---|---|---|
| Age (years) | 49.27±10.29 | 53.60±10.03 | 0.036 |
| Female, no. (%) | 45 (90.0%) | 41 (82.0%) | |
| RA duration (years) | 10.31±7.97 | 10.23±6.42 | |
| RF positive, no. (%) | 46 (92.0%) | 44 (88.0%) | |
| ACPA positive, no. (%) | 44 (88.0%) | 42 (84.0%) | |
| Erosions, no. (%) | 35 (70.0%) | 28 (56.0%) | |
| CRP (mg/dL) | 0.70±0.71 | 1.00±1.66 | |
| Tender joint count | 0.96±1.59 | 1.30±3.16 | |
| Swollen joint count | 1.44±2.35 | 1.64±2.75 | |
| DAS28-CRP | 1.95±0.76 | 1.97±0.87 | |
| Cardiac risk factors | |||
| Hypertension, no. (%) | 18 (36.0%) | 27 (54.0%) | |
| Cholesterol (mg/dL) | 165.52±39.35 | 162.8±26.37 | |
| LDL-c (mg/dL) | 94.04±29.62 | 92.44±29.01 | |
| HDL-c (mg/dL) | 52.58±15.03 | 49.8±10.79 | |
| Diabetes, no (%) | 5 (10.0%) | 9 (18.0%) | |
| Smoker, no. (%) | 3 (6.0%) | 4 (8.0%) | |
| BMI | 26.85±4.40 | 30.86±5.73 | <0.001 |
| BMI>30 | 11 (22.0%) | 25 (50.0%) | 0.004 |
| Framingham CVD score | 6.07±6.54 | 8.52±6.23 | |
| Medications | |||
| Prednisone, no. (%) | 15 (30.0%) | 16 (32.0%) | |
| Methotrexate, no. (%) | 39 (78.0%) | 40 (80.0%) | |
| No. csDMARDs | 1.77±0.78 | 1.98±0.77 | |
| bDMARDs, no. (%) | 30 (60.0%) | 34 (68.0%) | |
| Statins, no (%) | 19 (38.0%) | 22 (44.0%) | |
| Atherosclerosis burden | |||
| Any plaque, no. (%) | 30 (60.0%) | 39 (78.0%) | |
| SIS total | 1.60±2.43 | 2.14±2.03 | |
| SIS-NCP/MP | 1.28±2.01 | 1.70±1.57 | |
| SIS-CP | 0.32±1.02 | 0.44±0.93 |
At baseline, median (interquartile) EATv was 107.0 (84.9-135.2) cm3 and 70/100 (70%) patients had a total of 187 coronary segments with plaque. EATv (cm3) was higher in patients with baseline atherosclerosis (112.17 [95% CI 105.63-122.73]) compared to those without (98.49 [95% CI 88.23-108.85], p=0.046). This was especially true for nonobese (mean EATv difference 1.25 [1.06-1.46] cm3, p=0.007) but not obese patients. At follow-up, 6.9±0.4 years later, 96 new atherosclerotic lesions formed in segments without plaque initially; 19 were noncalcified, 21 were mixed, and 75 were fully-calcified.
High EATv (>107 cm3) associated with new plaque formation in segments without baseline plaque: odds ratio (OR) 2.77 (95% CI 1.43-5.37), p= 0.003; however, after adjusting for Framingham time-averaged CRP, statin duration, cumulative methotrexate dose, and cumulative prednisone dose, the effect of high EATv was no longer significant (adjusted OR 1.72 [95% CI 0.84-3.51], p=0.137). Importantly, high EATv associated with formation of higher-risk noncalcified or mixed plaques (adjusted OR 2.57 [95% CI 1.02-6.48], p= 0.045). High EATv was not associated with likelihood of new fully-calcified plaque formation (adjusted OR 1.41 [95% CI 0.59-3.33], p=0.438). RA duration (<10 versus >10 years), cardiac risk factor burden (≤1 versus >1), presence of mixed or fully-calcified plaque in other coronary segments at baseline, and statin duration (≤1 versus >1 year) influenced the effect of EATv on any new plaque formation (all p-for-interaction ≤ 0.021).
All models adjusted for proximal segment location, time averaged CRP, cumulative prednisone dose, and total methotrexate dose.
Discussion
We previously reported that EATv was linked to coronary plaque burden and vulnerability in patients with rheumatoid arthritis. We here show that high EATv (>107cm3) at screening influenced atherosclerosis progression in RA. Specifically, high EATv associated with new noncalcified and/or mixed plaque formation, but not fully calcified plaque, independently of cardiac risk factors, obesity, cumulative systemic inflammation, duration of bDMARD and statin treatment and cumulative corticosteroid dose. This is consistent with a report from the population-based Heinz Nixdorf Recall study that EATv was linked to latent atherosclerosis progression among general patients. Presence of a noncalcified component in a plaque reflects an early and active atherogenic process and further determines its vulnerability to rupture. In contrast, dense calcification associates with plaque stabilization. General patients with noncalcified or mixed plaques exhibited higher EATv compared to those with only fully-calcified lesions. Likewise, coronary segments harboring high-risk plaques were surrounded by larger segmental EATv.
The association of EATv with atherosclerosis progression independently of obesity indicates that EATv measurement yields materially different information than overall obesity and despite their close correlation. It further implies that the contributions of EAT to atherosclerosis may be mechanistically different from obesity. Indeed, EATv predicted coronary atherosclerosis in the absence of visceral fat accumulation in general patients. Moreover, EATv associated with greater likelihood of plaque presence in non-obese but not obese RA patients. Accordingly, nonobese general patients with coronary artery disease exhibited significantly larger adipocyte size and lower pericardial adiponectin compared to those without; in contrast, adiponectin was similar in obese patients with or without coronary artery disease.
Similarly, the association of EATv with atherosclerosis progression independently of systemic inflammation confirms the additional and unique contribution of the adjacent EAT and perivascular fat inflammation in the underlying atherogenic process. Indeed, no significant association between serum CRP and EATv in RA was observed. Instead, the extent of EAT inflammation, density of macrophage infiltration and neovascularization associated with noncalcified and vulnerable plaque formation in general patients.
We further demonstrated that high EATv predicted atherosclerosis progression in patients with shorter (<10 years) but not longer (>10 years) disease duration. One possible explanation may be that higher inflammation within EAT in earlier disease may accelerate coronary atherogenesis. Alternatively, and non-mutually exclusive, patients with shorter disease duration may experience lower cumulative inflammation, not outcompeting the individual contributions of EAT. Indeed, cumulative systemic inflammation independently predicted atherosclerosis progression in RA. However, our models adjusted for cumulative inflammation patients experienced between baseline and follow-up CCTA visit. Otherwise, differences in traditional cardiac risk factor burden between patients with shorter versus longer disease duration may also attenuate the relative contributions of EATv on atherosclerosis progression risk. Indeed, in ancillary analyses, our patients with shorter disease duration exhibited significantly fewer cardiac risk factors and lower composite cardiovascular risk scores compared to those with longer disease duration. Nevertheless, our multivariable models also adjusted for cardiovascular risk score making this a less likely explanation. Differences in bDMARD and statin use between patients with shorter and longer disease duration might also explain the differential influence of EATv on atherosclerosis progression; especially since both were shown to reduce EATv which may in turn influence its relationship with plaque progression. While our models adjusted for statin use and duration throughout follow-up, indeed, patients with shorter disease duration were significantly less likely to receive bDMARDs at baseline or anytime during follow-up.
We also observed that high EATv associated with new plaque formation in patients with lower (≤1) but not higher (>1) cardiac risk factor burden. This implies that EAT may influence atherosclerosis progression through different mechanisms than classical cardiac risk factors, perhaps in earlier disease. Indeed, our patients with disease duration <10 years exhibited significantly fewer risk factors than those with longer disease duration. In the absence of traditional risk factors, inflammation within a progressively expanding, coronary adjacent EAT may be the primary driver of atherosclerosis in the underlying coronary arteries via paracrine and vasocrine effects. The RA disease process itself and its related treatments was shown to associate with incident and prevalent cardiac risk factors including hypertension, dyslipidemia, insulin resistance and diabetes. Moreover, EATv independently associated with traditional cardiac risk factors in general patients. Therefore, the progressive accrual of cardiac risk factors along the disease trajectory may at least partially explain the influence of EATv on plaque progression. Alternatively, their joint impact may attenuate the relative contribution of EAT on atherosclerosis and/or they may collectively synergize with inflammation to promote plaque progression.
We further showed that high EATv was linked to new plaque formation in RA patients without baseline calcifications but not those with prevalent mixed or calcified plaque. This finding supports the notion of a greater contribution of EAT at the earlier stages of the atherogenic process. This is corroborated by the association of EATv exclusively with noncalcified but not fully-calcified plaque presence and progression in RA and with incident cardiovascular events in general patients with low or no CAC. This finding is also consistent with a prior report in general patients, that EAT associated with presence of coronary artery disease and plaque burden in those with CAC score of zero and the association between EATv and atherosclerosis progression in patients with low or no CAC.
We further observed that high EATv associated with atherosclerosis progression in patients treated with statin <1 year but not those with longer exposure. Statins were shown to reduce EATv and this effect appeared to be dose-dependent, yet independent of their lipid lowering properties. Statins also modulated the inflammatory profile of EAT via NOD-like receptor protein 3 (NLRP3) suppression, ameliorated EAT dysfunction, and reduced EAT attenuation on imaging. Therefore, reduction in EAT volume, inflammation and biologic dysfunction may influence its impact on atherogenesis via paracrine and vasocrine effects. Our observation is consistent with a large registry study in RA reporting a cumulative dose and temporal exposure relationship (average of 528 days) between statin treatment and cardiovascular risk reduction. It is also congruent with our prior finding that longer statin exposure significantly attenuated the effect of systemic inflammation on plaque progression.
Several limitations of our study should be acknowledged. First, we did not measure EAT attenuation as a measure of inflammation within fat in our study; therefore, we were not able to comprehensively characterize the holistic contribution of EAT on atherosclerosis progression. Lipid lowering and bDMARD therapies were initiated or intensified after the screening CCTA evaluation and throughout follow-up; this may have influenced EAT volume and inflammation and hence attenuated its impact on plaque progression. However, our models adjusted for statin and bDMARD exposure and duration throughout follow-up, at least partially mitigating this effect. Our original study design was not powered to address the effect of EATv on atherosclerosis progression; therefore our findings should be considered preliminary and externally validated in larger, prospective and adequately powered studies.
Conclusion
Among RA patients without cardiovascular disease, high baseline EATv independently predicted new higher-risk noncalcified and mixed coronary plaque formation. Moreover, it conditionally promoted atherosclerosis progression overall in patients with earlier disease, low cardiac risk factor burden, who had little or no atherosclerosis at baseline and who had limited exposure to statins. Epicardial adipose tissue volume may therefore represent an early, measurable and modifiable cardiovascular risk factor and a biomarker of atherosclerosis burden and progression in RA.
Conflict of Interest Statement:
This study was supported by grants from American Heart Association and Pfizer to GAK. The authors have no conflict of interest to declare.
Funding Statement:
This work was supported by the American Heart Association [grant number AHA-09CRP2251004] and Pfizer through an investigator-initiated grant award [grant ID number 68633259] to G.A.K. The sponsors were not involved in the study design, study-related procedures, data collection, data analysis or interpretation, manuscript drafting, or manuscript submission.
Acknowledgements:
We would like to express our gratitude to the patients participating in this study.
Data availability statement
The data underlying this article will be shared on reasonable request to the corresponding author.
References:
- Karpouzas GA, Malpeso J, Choi TY, Li D, Munoz S, Budoff MJ. Prevalence, extent and composition of coronary plaque in patients with rheumatoid arthritis without symptoms or prior diagnosis of coronary artery disease. Ann Rheum Dis. 2014;73(10):1797-1804.
- Holmqvist ME, Wedrén S, Jacobsson LTH, et al. Rapid increase in myocardial infarction risk following diagnosis of rheumatoid arthritis amongst patients diagnosed between 1995 and 2006. J Intern Med. 2010;268(6):578-585.
- Wang JC, Normand SLT, Mauri L, Kuntz RE. Coronary artery spatial distribution of acute myocardial infarction occlusions. Circulation. 2004;110(3):278-284.
- Sacks HS, Fain JN. Human epicardial adipose tissue: a review. Am Heart J. 2007;153(6):907-917.
- Packer M. Epicardial adipose tissue may mediate deleterious effects of obesity and inflammation on the myocardium. J Am Coll Cardiol. 2018;71(20):2360-2372.
- Iacobellis G. Epicardial adipose tissue in contemporary cardiology. Nat Rev Cardiol. 2022;19(9):593-606.
- Kitagawa T, Yamamoto H, Sentani K, et al. The relationship between inflammation and neoangiogenesis of epicardial adipose tissue and coronary atherosclerosis based on computed tomography analysis. Atherosclerosis. 2015;243(1):293-299.
- Wang TD, Lee WJ, Shih FY, et al. Association of epicardial adipose tissue with coronary atherosclerosis is region-specific and independent of conventional risk factors and intra-abdominal adiposity. Atherosclerosis. 2010;213(1):279-287.
- Hassan M, Said K, Rizk H, et al. Segmental peri-coronary epicardial adipose tissue volume and coronary plaque characteristics. Eur Heart J Cardiovasc Imaging. 2016;17(10):1169-1177.
- McKenney-Drake ML, Rodenbeck SD, Bruning RS, et al. Epicardial adipose tissue removal potentiates outward remodeling and arrests coronary atherogenesis. Ann Thorac Surg. 2017;103(5):1622-1630.
- Hwang IC, Park HE, Choi SY. Epicardial adipose tissue contributes to the development of non-calcified coronary plaque: a 5-year computed tomography follow-up study. J Atheroscler Thromb. 2017;24(3):262-274.
- Gorter PM, de Vos AM, van der Graaf Y, et al. Relation of epicardial and pericoronary fat to coronary atherosclerosis and coronary artery calcium in patients undergoing coronary angiography. Am J Cardiol. 2008;102(4):380-385.
- Mahabadi AA, Massaro JM, Rosito GA, et al. Association of pericardial fat, intrathoracic fat, and visceral abdominal fat with cardiovascular disease burden: the Framingham Heart Study. Eur Heart J. 2009;30(7):850-856.
- Ding J, Hsu FC, Harris TB, et al. The association of pericardial fat with incident coronary heart disease: the Multi-Ethnic Study of Atherosclerosis (MESA). Am J Clin Nutr. 2009;90(3):499-504.
- Zhou J, Chen Y, Zhang Y, et al. Epicardial fat volume improves the prediction of obstructive coronary artery disease above traditional risk factors and coronary calcium score. Circ Cardiovasc Imaging. 2019;12(1):e008002.
- Cheng VY, Dey D, Tamarappoo B, et al. Pericardial fat burden on ECG-gated noncontrast CT in asymptomatic patients who subsequently experience adverse cardiovascular events. JACC Cardiovasc Imaging. 2010;3(4):352-360.
- Forouzandeh F, Chang SM, Muhyieddeen K, et al. Does quantifying epicardial and intrathoracic fat with noncontrast computed tomography improve risk stratification beyond calcium scoring alone? Circ Cardiovasc Imaging. 2013;6(1):58-66.
- Kunita E, Yamamoto H, Kitagawa T, et al. Prognostic value of coronary artery calcium and epicardial adipose tissue assessed by non-contrast cardiac computed tomography. Atherosclerosis. 2014;233(2):447-453.
- Karpouzas GA, Rezaeian P, Ormseth SR, Hollan I, Budoff MJ. Epicardial adipose tissue volume as a marker of subclinical coronary atherosclerosis in rheumatoid arthritis. Arthritis Rheumatol. 2021;73(8):1412-1420.
- Mahabadi AA, Lehmann N, Kälsch H, et al. Association of epicardial adipose tissue with progression of coronary artery calcification is more pronounced in the early phase of atherosclerosis: results from the Heinz Nixdorf recall study. JACC Cardiovasc Imaging. 2014;7(9):909-916.
- Motoyama S, Ito H, Sarai M, et al. Plaque characterization by coronary computed tomography angiography and the likelihood of acute coronary events in mid-term follow-up. J Am Coll Cardiol. 2015;66(4):337-346.
- Gu H, Gao Y, Wang H, et al. Sex differences in coronary atherosclerosis progression and major adverse cardiac events in patients with suspected coronary artery disease. J Cardiovasc Comput Tomogr. 2017;11(5):367-372.
- Inoue K, Motoyama S, Sarai M, et al. Serial coronary CT angiography-verified changes in plaque characteristics as an end point: evaluation of effect of statin intervention. JACC Cardiovasc Imaging. 2010;3(7):691-698.
- Karpouzas GA, Ormseth SR, Hernandez E, Budoff MJ. Biologics may prevent cardiovascular events in rheumatoid arthritis by inhibiting coronary plaque formation and stabilizing high-risk lesions. Arthritis Rheumatol. 2020;72:1467-1475.
- Agatston AS, Janowitz WR, Hildner FJ, Zusmer NR, Viamonte M, Detrano R. Quantification of coronary artery calcium using ultrafast computed tomography. J Am Coll Cardiol. 1990;15(4):827-832.
- Budoff MJ, Dowe D, Jollis JG, et al. Diagnostic performance of 64-multidetector row coronary computed tomographic angiography for evaluation of coronary artery stenosis in individuals without known coronary artery disease: results from the prospective multicenter ACCURACY (Assessment by Coronary Computed Tomographic Angiography of Individuals Undergoing Invasive Coronary Angiography) trial. J Am Coll Cardiol. 2008;52(21):1724-1732.
- Leipsic J, Abbara S, Achenbach S, et al. SCCT guidelines for the interpretation and reporting of coronary CT angiography: a report of the Society of Cardiovascular Computed Tomography Guidelines Committee. J Cardiovasc Comput Tomogr. 2014;8(5):342-358.
- Pohle K, Achenbach S, Macneill B, et al. Characterization of non-calcified coronary atherosclerotic plaque by multi-detector row CT: comparison to IVUS. Atherosclerosis. 2007;190(1):174-180.
- General cardiovascular risk profile for use in primary care: the Framingham Heart Study. Circulation. 2008;117(6):743-753.
- Nichol A, Bailey M, Egi M, et al. Dynamic lactate indices as predictors of outcome in critically ill patients. Crit Care. 2011;15(5):R242.
- Swirski FK, Nahrendorf M. Leukocyte behavior in atherosclerosis, myocardial infarction, and heart failure. Science. 2013;339(6116):161-166.
- Aikawa E, Nahrendorf M, Figueiredo JL, et al. Osteogenesis associates with inflammation in early-stage atherosclerosis evaluated by molecular imaging in vivo. Circulation. 2007;116(24):2841-2850.
- Lo J, Abbara S, Rocha-Filho JA, Shturman L, Wei J, Grinspoon SK. Increased epicardial adipose tissue volume in HIV-infected men and relationships to body composition and metabolic parameters. AIDS. 2010;24(13):2127-2130.
- Okada K, Ohshima S, Isobe S, et al. Epicardial fat volume correlates with severity of coronary artery disease in nonobese patients. J Cardiovasc Med (Hagerstown). 2014;15(5):384-390.
- Tsushima H, Yamamoto H, Kitagawa T, et al. Association of epicardial and abdominal visceral adipose tissue with coronary atherosclerosis in patients with a coronary artery calcium score of zero. Circ J. 2015;79(5):1084-1091.
- Bettencourt N, Toschke AM, Leite D, et al. Epicardial adipose tissue is an independent predictor of coronary atherosclerotic burden. Int J Cardiol. 2012;158(1):26-32.
Supplementary Table S1 Baseline characteristics by follow-up CCTA status
| Follow-up CCTA | (n=102) | No follow-up CCTA | (n=44) |
|---|---|---|---|
| Age (years)* | 51.51 ± 10.25 | 57.20 ± 10.25 | |
| Female, no. (%) | 88 (86.27) | 39 (88.64) | |
| RA duration (years) | 10.17 ± 7.16 | 12.16 ± 8.81 | |
| RF positive, no. (%) | 91 (89.22) | 34 (77.27) | |
| ACPA positive, no. (%) | 87 (85.29) | 37 (84.09) | |
| Erosions, no. (%) | 65 (63.73) | 32 (72.73) | |
| CRP (mg/dL) | 0.84 ± 1.27 | 0.79 ± 1.12 | |
| Tender joint count* | 1.14 ± 2.48 | 2.50 ± 4.86 | |
| Swollen joint count | 1.57 ± 2.53 | 1.82 ± 2.70 | |
| DAS28-CRP | 2.45 ± 0.92 | 2.73 ± 1.19 | |
| Cardiovascular risk factors | |||
| Hypertension, no. (%) | 46 (45.10) | 23 (52.27) | |
| Cholesterol (mg/dL) | 167.04 ± 34.77 | 172.00 ± 33.61 | |
| LDL-c (mg/dL) | 94.52 ± 28.34 | 96.64 ± 27.03 | |
| HDL-c (mg/dL) | 50.71 ± 12.91 | 51.02 ± 16.49 | |
| Diabetes, no. (%) | 15 (14.71) | 9 (20.45) | |
| Current smoking, no. (%) | 8 (7.84) | 4 (9.09) | |
| Body mass index (kg/m2) | 28.74 ± 5.49 | 29.59 ± 5.67 | |
| Framingham-CVD risk score* | 7.45 ± 6.54 | 11.92 ± 10.48 | |
| Baseline medications | |||
| Prednisone, no. (%) | 33 (32.35) | 17 (38.64) | |
| Biologic DMARD, no. (%) | 64 (62.75) | 24 (54.55) | |
| Methotrexate, no. (%) | 80 (78.43) | 38 (86.36) | |
| No. concurrent csDMARDs* | 1.90 ± 0.78 | 2.20 ± 0.88 | |
| Statins, no. (%) | 41 (40.20) | 17 (38.64) | |
| Baseline coronary plaque | |||
| Any coronary plaque | 71 (69.61) | 32 (72.73) | |
| Number of coronary plaques | 1.89 ± 2.25 | 2.34 ± 2.43 | |
| Any coronary artery calcium | 33 (32.35) | 21 (47.73) | |
| Coronary artery calcium score | 71.34 ± 281.99 | 122.30 ± 556.18 |