


Advanced Air Distribution for Cleanliness in Operating Rooms
[1] Balaras CA, Dascalaki E, Gaglia A. HVAC and indoor thermal conditions in hospital operating rooms. Energy Build. 2007;39(4):454-470. doi:10. 1016/j.enbuild.2006.09.004
Advanced air distribution technologies for enhanced cleanliness and energy savings in operating rooms
Ales Rubina1, Pavel Uher1, Radek Salajka1, Tomas Pavlacky2, Peter Hybza3
- Brno University of Technology, Faculty of Civil Engineering, Institute of Building Services, Czech Republic
- Masaryk University, Faculty of Medicine, Department of Traumatology, Czech Republic
- Plastic Surgeon at Leticia, The Clinic of Plastic and Aesthetic Surgery Brno, Czech Republic
OPEN ACCESS
PUBLISHED: 31 January 2025
CITATION: RUBINA, Ales et al. Advanced air distribution technologies for enhanced cleanliness and energy savings in operating rooms. Medical Research Archives, [S.l.], v. 13, n. 1, jan. 2025. Available at: <https://esmed.org/MRA/mra/article/view/6079>. Date accessed: 20 oct. 2025.
COPYRIGHT: © 2025 European Society of Medicine. This is an open-access article distributed under the terms of the Creative Commons Attribution License, which permits unrestricted use, distribution, and reproduction in any medium, provided the original author and source are credited.
DOI: https://doi.org/10.18103/mra.v13i1.6079
ISSN 2375-1924
ABSTRACT
This study investigates the impact of advanced air distribution technologies on cleanliness and energy efficiency of operating rooms. A compound laminar air flow ceiling (CLAC) was developed and evaluated using computational fluid dynamics (CFD) simulations, experimental measurements, and field tests. Results show that the CLAC significantly improves air quality and reduces energy consumption compared to standard laminar airflow systems. The findings indicate potential energy savings of up to 40%.
Keywords: air distribution, cleanliness, energy savings, operating rooms, computational fluid dynamics
Introduction
With increasing demands for clean and controlled environments across a variety of industries, from healthcare to pharmaceuticals, the importance of efficient HVAC solutions is increasing. Operating theatres (OT) require specific building and technology systems and procedures that minimise the risk of ambient contamination and help to ensure the highest standards of patient safety. Contamination of the operating theatre, and especially the patient’s operating field, can be eliminated by air handling or, better, air conditioning. This space is referred to as a clean room. The concentration of solid aerosol particles in its air is controlled according to predetermined limits.
Particles are emitted into the environment by personnel, technology, maintenance and equipment. These particles must be continuously removed from the room and from the air in the OT. The cleanroom quality requirements determine what particles must be controlled. The requirements for cleanrooms and zones are contained in many standards, for example German, international, used by the Czech and United States standards. The Czech norm defines the cleanroom class as shown in Tab. 1, where class B corresponds to a superaseptic OT.
Tab. 1 – Classification of cleanroom according to Czech standard
| Class | In steady state 0.5 µm | In steady state 5.0 µm | In operating state 0.5 µm | In operating state 5.0 µm |
|---|---|---|---|---|
| A | 3 520 | 20 | 3 520 | 20 |
| B | 3 520 | 29 | 352 000 | 2 900 |
| C | 352 000 | 2 900 | 3 520 000 | 29 000 |
| D | 3 520 000 | 29 000 | undefined | undefined |
The only way to control the contamination in the operating theatre is to comprehensively manage the entire environment of the room. This includes the air handling system itself and its proper design, the operation and maintenance of the equipment and the room, and last but not least, the controlled movement of personnel and compliance with their dress code.
For the air handling system, it is mainly: air exchange, flow direction, pressure ratios, air temperature and humidity, special air filtration. Particle counts must be controlled and eliminated as much as possible. The highest ambient cleanliness must be achieved in the operating field where the patient is located. This can be achieved, for example, by using a laminar airflow ceiling (LAC).
The laminar airflow ceiling is the end distribution element of the air handling equipment. Generally, it incorporates high-efficiency 3rd stage filters – HEPA filters. The laminar ceiling ensures a sufficient supply of a large amount of air directly into the patient field. Its functioning consists in a laminar air flow moving vertically downwards. This phenomenon, among others, is the subject of the research described in this paper.
Presently, there is a technology for higher quality services, which is a compound laminar air flow ceiling (CLAC). The Society has made significant progress in terms of technology for the implementation and use of operating theatres. The risk of infection during patient surgery, where sensitive internal organs are exposed, can be more easily infected by microbial particles from the surrounding environment, has been significantly reduced. The use of a laminar ceiling is intended to ensure the highest environmental cleanliness in the operating field. Many years of use of this system have proven its functionality. Even so, the risk of infection, as well as the presence of solid aerosol particles in the air, must be continuously monitored.
Particles are emitted into the environment by personnel, technology, maintenance and equipment. These particles must be continuously removed from the air. The air supply must be controlled so that the environment is not contaminated. The air supply must be designed in such a way that the particles can be removed from the air. This is achieved by using the correct air handling equipment.
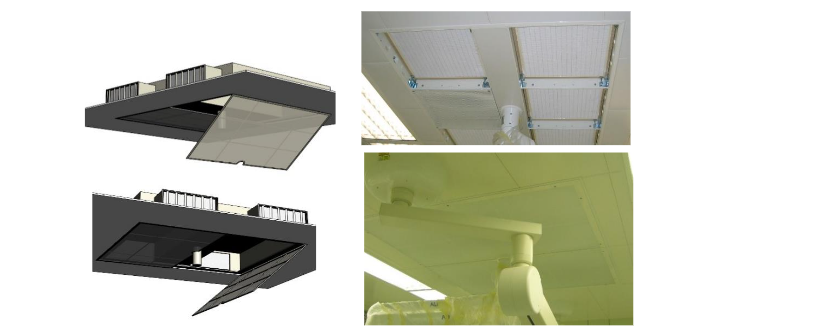
The research aims to prove this hypothesis using air motion simulations. If this is proven, better measures should be proposed to ensure that this phenomenon is eliminated or reduced. For this case, a compound laminar airflow ceiling (CLAC) was designed to change the airflow pattern in the room, especially under the ceiling where air circulation occurs.
An illustration of this CLAC is described in Fig. 3. From the illustration, it can be seen that the CLAC reduces the ceiling height and is provided with side air inlets.
Fig. 3 – Illustration of CLAC
First and foremost, the most important thing is to describe the problem and set the objectives. It is hypothesized that the use of current laminar ceilings can be further improved to improve the efficiency of air exchange in the operating room. The idea of improving efficiency is based on two components — improving the air quality in the operating room and improving the economics of both the design and operation of the air handling equipment.
The study can use multiple methods to reach these objectives. For computational modelling, a model should be used that corresponds to the currently built operating theatres, which generally have dimensions of 5×6×3 m. In comparison to the computational model in Fig. 2, in a real operating theatre there are multiple obstacles that influence the air flow, for example operating lights, stands, personnel, and other medical technology. Examination of the air quality relates to the fact that the air quality at a particular point in space is closely related to the flow pattern. From this point of view, it is possible to draw some partial conclusions about the distribution of air quality in space by identifying the flow images produced by the mathematical 3D model.
The cleanliness of the indoor environment in terms of contamination is usually measured either by the fallout method, by aeroscope, or by a laser particle counter. The State Institute of Health of the Czech Republic uses this equipment for measurement and validation of cleanrooms throughout the country, especially the laser particle counter.
Methods
Computational modelling is used to determine the current air condition in the operating theatre room with standard laminar airflow ceiling (LAC). More specifically, it is a dimensional analysis using the theory of similarity. A mathematical model has been developed in the software ADAPCO STAR CCM+ in order to create a subsequent flow picture showing the influence of the factors in the operating theatre (OT). The dimensions of the room of 5×6×3 m are respected in this model. The first visualization interprets the airflow through a LAC into a room without obstacles. For the next results, the obstacles are implemented in the model, which represents operating lights, stands, source bridges, and various elements of medical technology. These devices are not only massive, but they are also a source of heat, which is set as a boundary condition for the model.
For researching the air quality in the room, a geometrically accurate OT model with a total number of 361,315 polyhedral cells was used for the calculation. The models used for the internal equipment (lamps, operating table) are geometrically accurate. The simplification only concerns the exclusion of non-essential parts of the internal medical equipment such as tables, ventilation and patient anaesthesia devices and similar.
For the boundary conditions of the simulation, steady three-dimensional airflow with turbulence influence was chosen. The Realizable K-Epsilon model was chosen as the turbulence model, and the Two-Layer All y+ Wall Treatment model was chosen for the boundary layer calculation. The air was modelled as an ideal gas, the flow was treated as isothermal. The “Segregated flow” solver was chosen. Iterations were performed to the converged state.
After synthesizing the acquired knowledge, a smoke test is conducted in a real operating room with LAC. A smoke generator is used for this purpose. It is a device that is used to produce fine smoke and its controlled distribution to the desired location of the space. Since the smoke is white in colour, it is necessary to make a mobile dark background which is fitted with a grid for visual estimation of airflow velocity and shape.
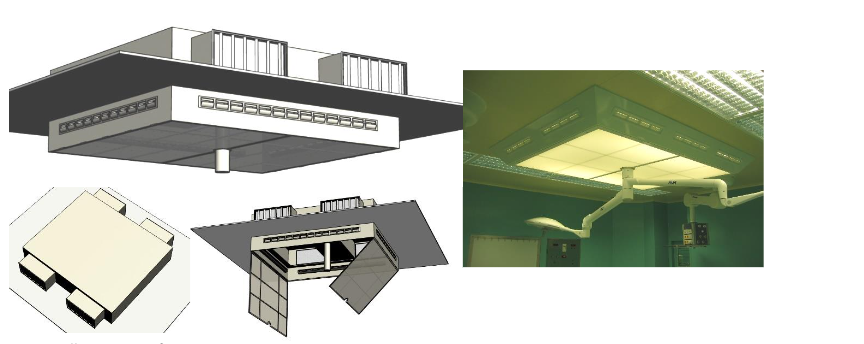
A prototype of the compound laminar airflow ceiling (CLAC) panel is manufactured and installed in a real operating theatre of a plastic surgery department. This prototype is connected to the air conditioning system and put into full operation, as would a standard laminar airflow ceiling. The next step is to measure and observe the functionality of the CLAC prototype and the air quality in the operating theatre environment.
In parallel, computational fluid dynamics (CFD) simulations of the airflow using the new panel are carried out. Finally, a system evaluation and energy balance calculation are performed to compare the required airflow values and system efficiency.
For this research, the authors used a laser particle counter to measure solid aerosol particle contamination of the room. The actual measurement was carried out using a calibrated CLIMET particle counter. Standard professional protocols for “cleanroom particle number measurements” were developed from the measurements. Both protocols are in the author’s archive.
The most significant samples are collected at the point of the operating field — at the patient site, where the lowest particle concentration is predicted, and at the exhaust outlet of the HVAC system under the ceiling, where, in turn, the greatest number of particles in the room is anticipated. In addition to these two locations, measurements were also taken at the floor, at the walls, under the ceilings outside the laminar panel, at the exhaust grille near the floor, and the values at the exhaust outlet averaged.
The efficiency of this system is calculated as a ratio of these values, using the following relation:
η=ba\eta = \frac{b}{a}
where:
aa = number of particles in the operating field [pcs per m³]
bb = number of particles in the HVAC outlet [pcs per m³]
η\eta = system efficiency [-]
To theoretically assess the potential operational savings, two case studies were developed to simulate energy consumption over the entire calendar year. In both cases, the same exterior climatic conditions and the same indoor microclimate parameters in the operating room were included in the calculation.
The calculations were performed in the TERUNA simulation software. The operating mode of the OT was chosen the same in both cases, i.e. full operation of the HVAC equipment was considered according to the real operation of the operating theatre in the hospital in Ivančice, 6 days a week from 6:00 to 20:00. Outside of working hours, a reduction of air output to 50% of full output was considered.
Results
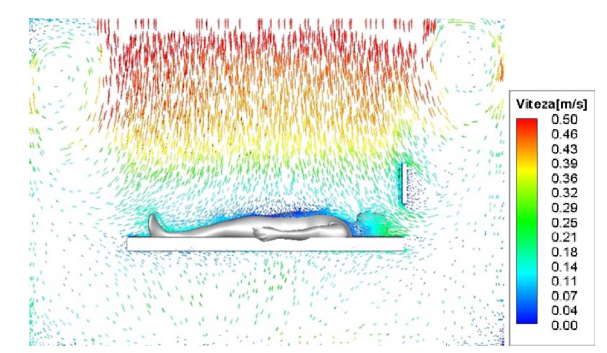
The first result is the CFD simulations of the airflow from a standard LAC presented in Fig. 4. Using this simulation, the flow characteristics of this distribution element in its standard configuration are investigated, and key parameters such as flow steadiness, turbulence, and the ability to eliminate particles from critical areas that will be emitted from pollution sources primarily personnel and clothing can be monitored.
Fig. 4 – Simulation of the airflow vectors using LAC element without obstacles
Clearly visible in the simulation is the similarity with the simulation of earlier projects. The highest air velocity is located in the operating field, on the floor and near.
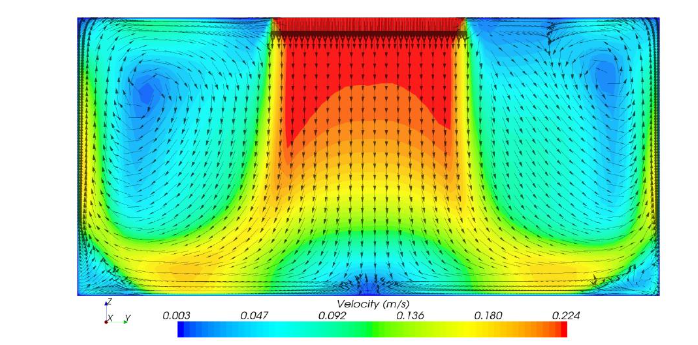
Fig. 4 — Simulation of the airflow vectors using LAC element without obstacles
Clearly visible in the simulation flow is the similarity with the simulation of earlier research interpreted in Fig. 2 of this paper. The highest air velocity is found in the operating field, on the floor, and near the walls. The space between the laminar ceiling and the walls, closer to the ceiling structure, is called the margin zone. This creates an area of air circulation with reduced air velocity.
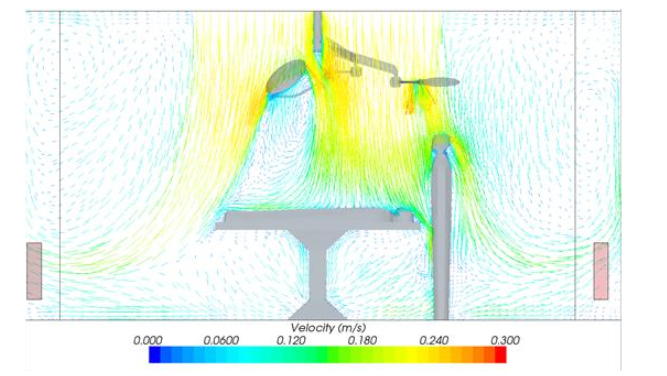
Fig. 5 — Simulation of the airflow vectors using LAC element with added obstacles, longitudinal section
To more accurately simulate air movement in the operating room, the devices found in operating rooms are added, as mentioned in the Methods chapter. Fig. 5 thus presents the results of a more realistic simulation of air movement in the room. The basic elements appear here with their respective boundary conditions in case they emit heat.
The simulation in Fig. 5 shows the same airflow analogy but is more detailed. It shows, for example, how light can impede the flow of air, creating a small region of reduced air velocity. The similarities of Fig. 5 and Fig. 4 can be seen in key areas — these are the operating field, the floor, the walls, and the space under the ceiling in the room.
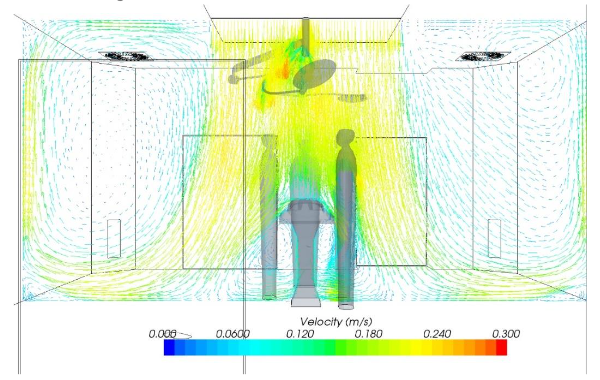
Peripheral zone. Fig. 5 shows a simulation of a more detailed model in a longitudinal section of the room. Fig. 6 further presents a simulation of air movement in a cross section of the room.
Fig. 6 — Simulation of the airflow vectors using LAC element with added obstacles, cross section
The issue of the place of circulation seems to be apparent. A location with a lower air velocity may mean that air with a higher mass age may be collected at that location. Air mass age is a term used to express the average time that air has been in a space since it entered as fresh air. This indicator helps to evaluate the efficiency of air exchange and shows how long it takes for the air in a room to be renewed with new, fresh air.
The lower the age of the air, the more efficiently the system distributes and exchanges air, which is especially crucial in clean rooms where rapid elimination of potential contaminants is required. Consequently, this area with older air mass may contain a higher concentration of particles than areas with faster air movement.
Other simulations focus on the mass age of the air itself. Fig. 7 shows a simulation of the airflow on a 3D model with a standard arrangement of the outlet elements. The left illustration contains the exhaust elements in the ceiling structure and in the corners of the room near the floor. The right illustration presents a similar simulation, but this time the position of the exhaust elements is changed for the sake of comparison, and they are located only in the walls.
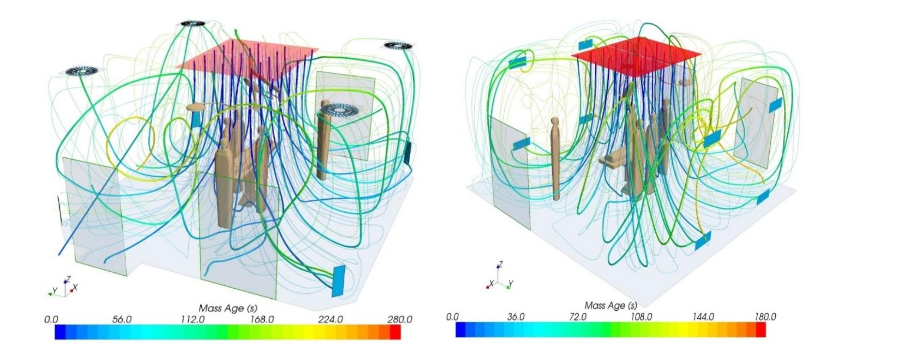
Fig. 7 — Simulation of the air mass age and airflow trajectory, left side has outlets on the ceiling, right side has outlets only on the walls.
The theoretical air change in the simulation is 35 times per hour. With a room volume of 90 m³, the air flow is 3,150 m³/h. Therefore, each air particle should ideally travel its path in 103 seconds. However, the movement of the particles is irregular mainly due to obstacles.
The different cases are described in Fig. 7. Some particles pass this path very quickly and are replaced in 30 seconds. Other particles, on the other hand, remain in the room for 3 or 4 minutes.
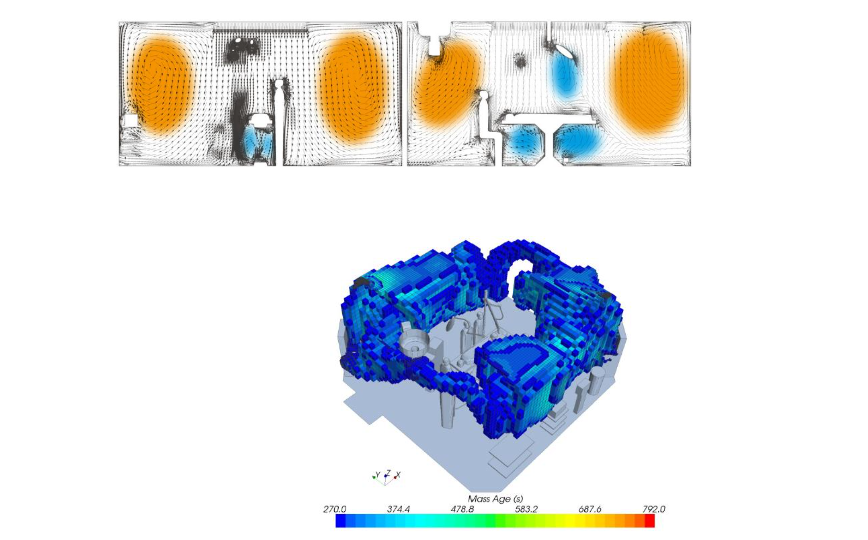
Fig. 8 — Visualization of simulated air mass age and circulating ring
In both cases of the location of the extraction end elements, there is an area visible around the perimeter of the room. Due to the visual profile of this area, it can be called the main circulation ring. In Fig. 8, this area is shown in orange. The smaller and secondary circulation areas are then marked in blue. In Fig. 8, a 3D model representation of the main circulation ring itself with an air age greater than 270 s can also be seen.
Simulations of the air flow on the mathematical model showed how the air exchange takes place in the operating theatre and what the air flow pattern looks like. This helped to understand the key air behaviour and the possible concentration of airborne particulate matter in the solved areas.
The next step is to test the airflow in actual operation using a smoke test. Fig. 9 shows a research team member with smoke conducting an experiment against a dark background. There is also a closer look at the individual airflows shown by the smoke.
In general, the area of the clean zone, i.e. the area that is completely flooded by the supply air and not mixed with the room air, is not identical to the dimensions of the air flow supply element – the laminar element, but is a direct flow path, dominated partly by inertial forces.
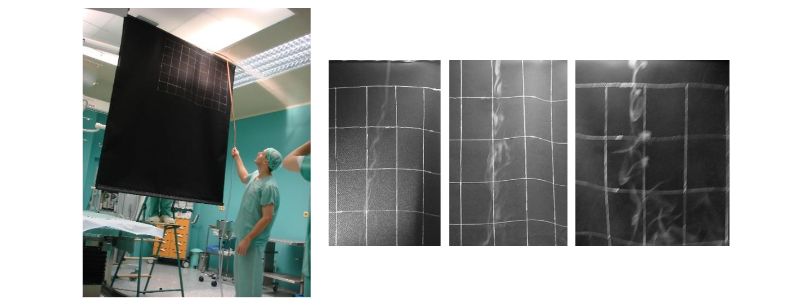
The picture of the air flow under the lamp was also interesting. The flow is slightly visible on a photograph and is also illustrated in Fig. 10.
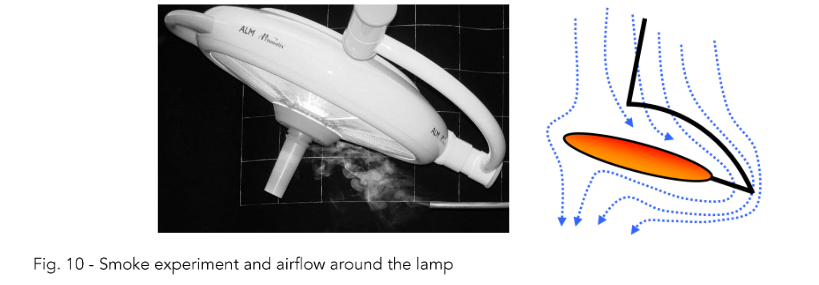
In general, the area of the clean zone, i.e. the area that is completely flooded by the supply air and not mixed with the room air, is not identical to the dimensions of the large-area supply element — the LAC.
The supply air flow cannot be considered as laminar even in the space below the laminar ceiling, but it is a directed flow, especially in the central part, dominated by inertial forces. At the edge of the main supply air flow, due to the viscosity of the air, turbulence is generated and mixing with the ambient air takes place.
The ventilation in the edge zone can be characterised as dilution ventilation, and in the centre zone as displacement ventilation. The viscosity of the air, especially in the boundary layer, is applied here.
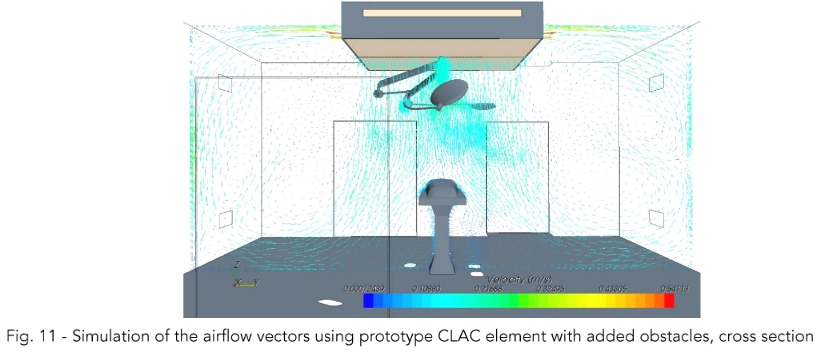
With this knowledge, we proceed to the simulation of the newly designed compound laminar airflow ceiling (CLAC). Fig. 11 shows the simulation of the airflow in the longitudinal section of the operating room and Fig. 12 shows the simulation in the cross section of the room. The relative ratio of the air supplied perpendicularly down to the operating field and to the air supplied to the sides is 90/10 [%].
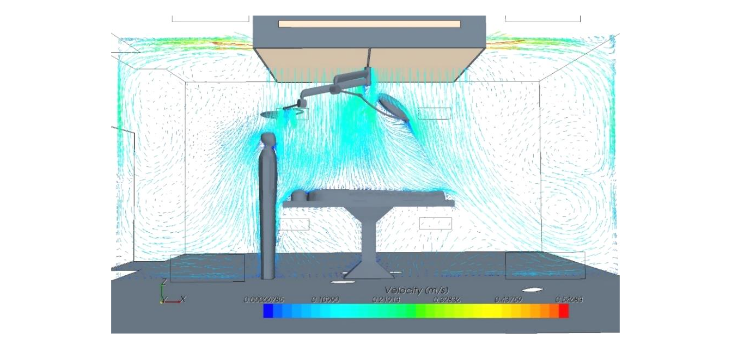
Fig. 12 – Simulation of the airflow vectors shown in the simulation
In both cases in Fig. 11 and Fig. 12, some similarity to the original standard laminar ceiling can be seen. However, it can be seen from the simulated vectors that the circulation rings are now split and smaller. The question is therefore how this affects the age mass of the air. Its simulation is shown in Fig. 13.
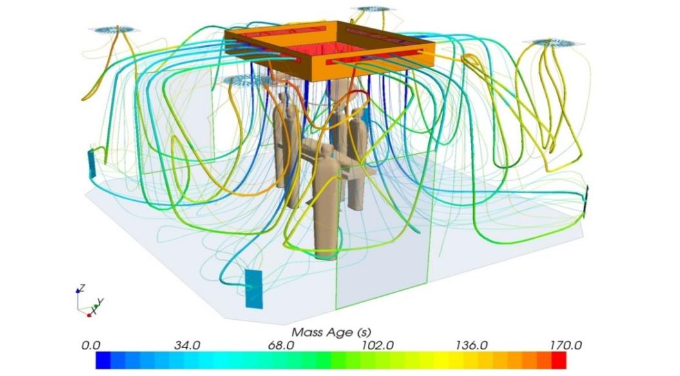
Fig. 13 — Simulation of airflow trajectory lines and air mass age for prototype CLAC element
Fig. 13 illustrates the more reasonable behaviour of the airflow, especially in terms of its age. In the larger part of the operating theatre, the air exchange is faster. The oldest particle in the room according to the simulation reaches 170 s and only at the point near the exhaust outlet.
Measurements of solid aerosol particle concentrations were performed in the operating room with the LAC and in the surgical theatre where the prototype CLAC was implemented. In order to limit the influence of different initial conditions from the LAC and CLAC measurements,
The evaluation of particle number as a standard variable for air quality assessment was carried out in a proportional manner. The average concentration of particles in the exhaust air is used as a baseline and has a value of 1 in both cases.
At the other measurement points, always the same for both LAC and CLAC measurements, the ratio of the number of particles at that measurement point to the number of particles in the exhaust air is expressed. For the resulting efficiency evaluation in Tab. 2, the absolute values of the particle ratio are calculated.
Tab. 2 — Particle count efficiency of the systems
| System | 0.5 µm | 5.0 µm |
|---|---|---|
| LAC (standard) | 5.2 | 5.9 |
| CLAC (innovative) | 10.1 | 6.4 |
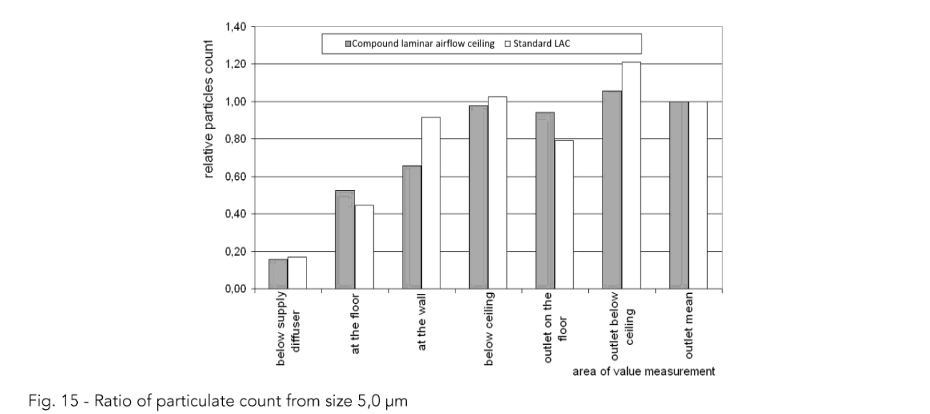
The individual measurement results are interpreted in Fig. 14, where measured solid aerosol particles from size 0.5 µm are shown, and Fig. 15, where measured solid aerosol particles from size 5.0 µm are liste
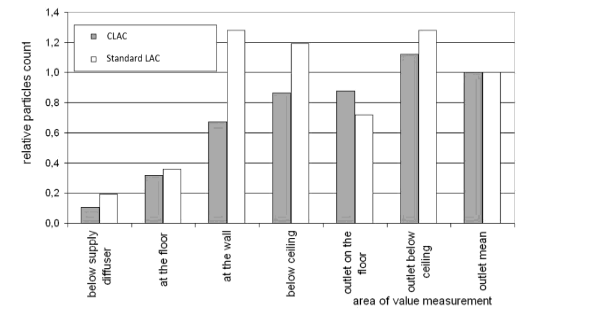
Fig. 14 — Ratio of particulate count from size 0.5 µm
For the particles sized 0.5 µm and more, there are the most significant relative differences measured at the wall. This information corresponds with the simulated air flow vectors.
Based on the experiments and measurements made after the change of the flow pattern in the operating room, it is theoretically possible to classify the operating room into a higher cleanliness class if the concentrations of solid aerosol particles in the patient’s operating field are reduced. According to the currently generally valid technical guidelines for air handling equipment, the cleanliness class of a room is determined by the intensity of air exchange, i.e. the amount of air transported and treated. In general, the air quantity for an aseptic OT is given as 2 400 m³/h or an exchange rate of at least 20 times per hour, while for a super-aseptic OT a minimum air quantity of 3 600 m³/h or an exchange rate of at least 30 times per hour is required.
An example of the energy consumption calculation for the aseptic OT is shown in Fig. 16. The result of the energy consumption calculation for the superaseptic operating theatre is shown in Fig. 17.
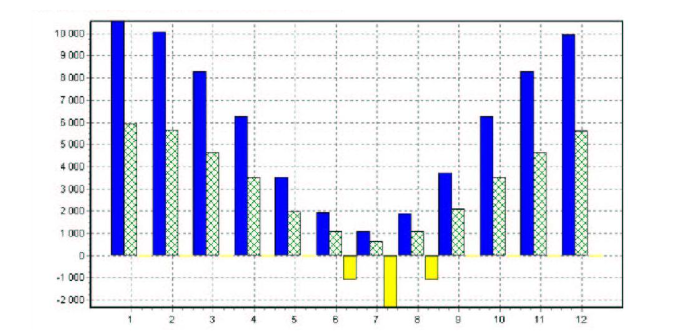
Fig. 16 – Heat energy requirements for aseptic OT throughout the year.
To further inform about the values in Fig. 16 and Fig. 17, the negative values represent cooling demand. Blue line represents values for energy demand for a facility without heat recuperation.
Green line shows heat demand for facility with heat recuperation unit. Yellow line shows cooling heat energy requirement.
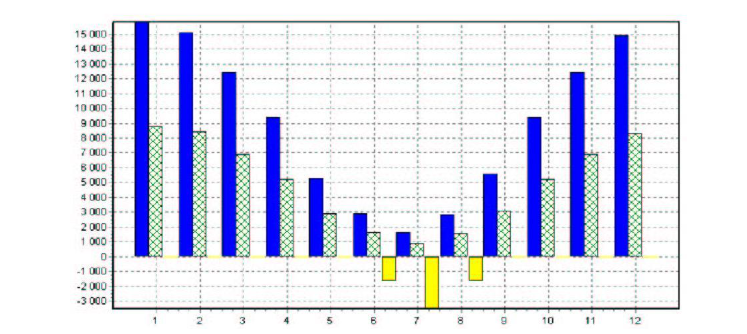
Fig. 17 – Heat energy requirements for superaseptic OT throughout the year.
Tab. 3 shows the cleanliness class of the aseptic and super-aseptic room in relation to the measured number of particles in the room according to Czech standard.
Tab. 3 – Classification of clean rooms on behalf of particle count
| Operation Theatre | Clean room class according to Czech standard | Number of particles and size for corresponding clean room class (µm) |
|---|---|---|
| for ≥ 0,5 in ft³ | ≥ 0,1 (m³) | |
| Superaseptic | 5 | 100 |
| Aseptic | 7 | 10 000 |
Based on the calculations of heat, cold, steam and electricity consumption required for air transport, the energy consumption in MWh/year was converted into the financial cost of the operation of the considered facilities. The prices used for the conversion were 19,2 € per 1 GJ of energy consumed and 0,088 € per 1 kWh of electricity.
In the case of validation of a super-aseptic OT with air parameters corresponding to an aseptic OT, up to 40 % savings in the operating costs of a given HVAC system are possible, as detailed in Tab. 4.
Tab. 4 – Calculated potential energy requirements and savings for two types of clean room classes
| Operational theatre | Supply air (m³/h) | Extract air (m³/h) | Heat recuperation (%) | Heat requirement (MWh/year) | Cooling requirement (MWh/year) | Steam requirement (tonnes/year) | Fan operation electrical energy (MWh/year) | Operating cost (€ / hour) |
|---|---|---|---|---|---|---|---|---|
| Superaseptic | 3600 | 3200 | 50 | 59,8 | 6,8 | 53 | 27 | 84 |
| Aseptic | 2400 | 2100 | 50 | 40,4 | 4,6 | 35 | 16 | 52 |
| Theoretical energy savings | – | – | – | – | – | – | – | 32 |
To further illustrate the potential energy savings, Fig. 18 shows how a total particle count changes with the air change of the researched room
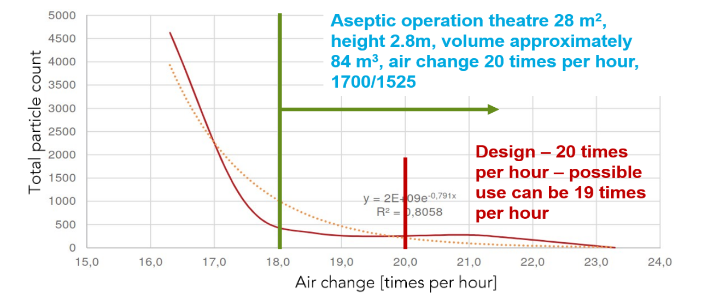
Fig. 18 – Total particle count depending on air change in a room of operating theatre with CLAC
Fig. 18 shows a measured particle count in a room of aseptic OT depending on value of air change per hour. The design value of the air change was 20 times per hour. However, the facility could change the air in the room with the value of only 19 times per hour and the concentration of solid aerosol particles could still be at approximately same low value. The orange dotted line represents a regression of particle count dependency.
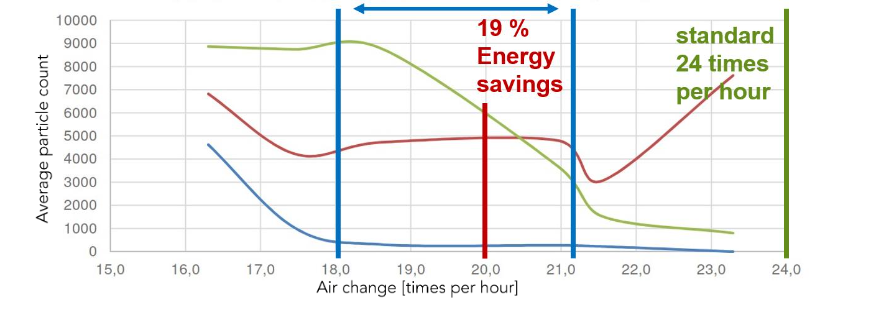
Fig. 19 – Particle count dependency on the air change value – multiple measuring points
Fig. 19 represents a measurement on a different aseptic OT in Czech Republic. This time, three individual measurement points were chosen to observe particle count dependency on the air change value. Blue line shows average particle count at the operating field. Red line represents average particle count at the air outlets. Green line shows average particle count at the door entrance to the operation theatre.
Discussion
This study demonstrated that the compound laminar airflow ceiling (CLAC) achieves a more effective performance compared to a standard laminar airflow ceiling (LAC) in terms of air change efficiency and energy consumption efficiency. By minimizing circulation zones and decreasing solid aerosol particle concentrations in the critical operating field, the CLAC enhances cleanliness of the room while providing the option to lower the airflow rates. These findings carry significant implications for both patient safety and hospital operational efficiency.
Examples of the mathematical model of isothermal airflow in OT are presented based on the outputs of CFD simulations. In general, it can be stated that the area of the clean zone, i.e. the space that is completely flooded with supply air and where no mixing with room air occurs, is not identical to the dimensions of the large-scale supply element – the laminar airflow ceiling. The supply air flow cannot be considered laminar even in the space below the LAC; however, it is a directed flow, especially in the central part, dominated by inertial forces.
At the edge of the supply air stream, turbulence is created due to the viscosity of the air, and it mixes with the ambient air. The ventilation in the edge zone can be characterised as dilution ventilation, in the centre zone as displacement ventilation. The viscosity of the air, especially in the boundary layer, is applied here. The initial velocity field is balanced due to the air flow through the laminarizer; the flow is unidirectional. When the ambient still air is flowing, the effect of air viscosity also applies here and a boundary layer of mixed air from the supply outlet and the room is formed. The velocity profile changes, and the braking effect of the boundary layer is applied.
The distribution of the supply air flow into the inner and edge zones with different flow regimes is documented by the shape of the streamlines and corresponds to the assumed mixing of the edge zone air flow by the return flows visualized in the mathematical models. As shown in the smoke test, this method of flow visualisation is suitable for the representation of the primary flow with air velocities above 0.15 m/s to counteract the effect of inertia of the incoming smoke. The display of low velocity, high turbulence flows is not illustrated by this method.
Visualization of the flow by imaging the subtle jets using controlled distribution of fine aerosol (smoke) is a very illustrative method of capturing the flow picture in OT spaces. The use of a small amount of aerosol does not degrade the OT equipment or burden the air handling equipment (the method used does not foul the laminarizer fabric), yet it is sufficient to visualise the flow at characteristic points in the space.
Optimising the air distribution therefore means establishing a flow pattern that reduces the mixing of secondary polluted air into the primary air stream. In addition, if the ventilation efficiency is increased, it will be possible to reduce the supply air flow rate, resulting in a reduction in the energy consumption of the air handling unit.
The results reveal that the CLAC system achieves a 10-fold reduction in solid aerosol particle concentrations in the operating field. This performance can be attributed to its innovative design, which reduces turbulence and improves displacement ventilation near critical zones. These observations align with findings in cleanroom technology, where airflow patterns directly influence particle dispersion and accumulation. Airflow patterns in optimizing indoor air quality are a crucial element in reducing contamination risks. Integrating such insights reinforces the broader relevance of the study.
According to the above measurement evaluation, it is possible to reduce the value of supply air to the OT using the new technology and thus reduce the operating costs of the air handling equipment. If further work proves that it is possible to reduce the amount of ventilation air with CLAC technology, this will also have a major impact on the purchase price of the air handling unit as a whole.
The operational energy savings highlighted by the CLAC system further show its benefits. By maintaining cleanliness standards with reduced airflow, the system contributes to lower energy consumption — a key goal in sustainable HVAC system design. Similar trends are documented in studies which identified energy-saving opportunities through airflow optimization in cleanrooms. This positions CLAC systems as a model for integrating environmental sustainability in surgery environments.
Although the study achieved promising findings, there are some limitations to consider. Even though the computational model included realistic equipment and boundary conditions, further refinement to the model or incorporating more detailed heat sources and dynamic conditions could improve the accuracy of the results. Also, more different models with different dimensions could potentially show different results, although the measurement in real conditions on different facilities has proven the hypotheses stated at the start of this manuscript as well as the correlation to findings in CFD modelling.
The potential of the CLAC system invites further investigation in several areas:
-
Comparative Studies: Evaluating CLAC systems against other advanced ventilation technologies, such as localized airflow systems or adaptive ventilation, would offer insights into relative benefits and trade-offs.
-
Life Cycle Assessment (LCA): Quantifying the environmental impact of manufacturing, installing, and operating CLAC systems would support broader adoption decisions.
-
More data analysis from real CLAC installations.
Conclusion
The use of a compound laminar airflow ceiling instead of a standard laminar airflow ceiling has been shown to reduce the concentration of particulate and microparticulate solid aerosol in the operating field with the patient. A CLAC system efficiency of 10 simply means that if a concentration of 10 particles per 1 m³ is measured at the extraction outlet, there is going to be 1 particle per 1 m³ in the operating field.
It has been shown by relative evaluation that CLAC establishes a more favourable distribution of particles in the space of the operating theatre, as this air distribution system achieves higher ventilation efficiency. This improvement would, in some cases, meet the requirements of the
classification for a higher cleanroom class even with a lower design airflow. Significant energy savings of up to 40 % on operating costs can be achieved in this way.
Further work by the author will focus on refining the identification and quantification of particle sources in the operating theatre so that further development of the mathematical model already includes two-phase flow with emitted particles from indoor sources, especially personnel.
Conflict of Interest:
None.
Funding Statement:
None.
Acknowledgements:
Acknowledgement is expressed of the support from the Faculty of Civil Engineering – Brno University of Technology for the specific research project “Research on environmentally sustainable systems and facilities of building services”, Grant No. FAST-S-24-8505.
References
[2] Useller JW. Clean Room Technology. Technology Utilization Division, National Aeronautics and Space Administration; 1969.
[3] VDI 2083. Cleanroom technology—Particulate air cleanliness classes. VDI-GESELLSCHAFT BAUEN UND GEBÄUDETECHNIK. 2022.
[4] ISO. Cleanrooms and associated controlled environments—Classification of air cleanliness by particle concentration. ČSN EN ISO 14644-1. Praha: The Czech Office for Standards, Metrology and Testing; 2016.
[5] U.S. General Services Administration. FED-STD-209E: Airborne particulate cleanliness classes in cleanrooms and clean zones. Federal Standard; 1992.
[6] Memarzadeh F. Comparison of operating room ventilation systems in the protection of the surgical site. ASHRAE Trans. 2004;110(2):1-11.
[7] Tacutu L, Nastase I, Bode F. Operating room ventilation with laminar air flow ceiling and a local laminar air flow system near the operating table for the patient. IOP Conf Ser: Mater Sci Eng. 2019;609 :032014. doi:10.1088/1757-899X/609/3/032014
[8] Rubina A, Blasinski P, Hyza P. Reducing the required amount of air for air conditioning of standard surgeries by installing a two-way laminar ceiling panel; 2021.
[9] Pirouz B, Palermo SA, Naghib SN, Mazzeo D, Turco M, Piro P. The role of HVAC design and windows on the indoor airflow pattern and ACH. Sustainability. 2021;13(14):7931. doi:10.3390/su13147931
[10] Maisonnet M. The Microbes of the Air; the “Hydro-aeroscope”—A New Apparatus for the Study of Atmospheric Pollution. Revue d’Hygiene et de Medecine Sociale. 1956;4(3):228-240.
[11] Whyte W. Cleanroom Technology: Fundamentals of Design, Testing, and Operation. New York, NY: John Wiley & Sons; 1999. ISBN: 978-0-470-74806-0.
[12] Bhattacharya A, Nikoopayan Tak MS, Shoai-Naini S, Betz F, Mousavi E. A systematic literature review of cleanroom ventilation and air distribution systems. Aerosol Air Qual Res. 2023;23:220407. doi:10.4209/aaqr.220407