


AI-Driven Digital Pathology for Breast Cancer Diagnosis
DCS_PathIMS: AI-powered Digital Pathology Diagnostics Platform for Breast Cancer Histology Imaging Biomarker Discovery for Precision Oncology
Dr. Rajasekaran Subramanian 1, Dr. R. Devika Rubi 2, Dr. Rohit Tapadia 3, Krishna Deep Yerramallu 4, Mohammed Arham Farooq 4, Shaistha Aara 4
-
Associate Professor, Neil Gogte Institute of Technology, Hyderabad, Telangana State, India
-
Associate Professor, Keshav Memorial Institute of Technology, Hyderabad, Telangana State, India
-
Director, Tapadia Diagnostics Center, Hyderabad, India
-
Research Intern, Keshav Memorial Institute of Technology, Hyderabad, Telangana State, India
OPEN ACCESS
PUBLISHED: 30 April 2025
CITATION: Subramanian, R., Rubi, RD., et al., 2025. DCS_PathIMS: AI-powered Digital Pathology Diagnostics Platform for Breast Cancer Histology Imaging Biomarker Discovery for Precision Oncology. Medical Research Archives, [online] 13(4). https://doi.org/10.18103/mra.v13i4.6481
COPYRIGHT: © 2025 European Society of Medicine. This is an open-access article distributed under the terms of the Creative Commons Attribution License, which permits unrestricted use, distribution, and reproduction in any medium, provided the original author and source are credited.
DOI https://doi.org/10.18103/mra.v13i4.6481
ISSN 2375-1924
ABSTRACT
Background: There is a critical global shortage of pathologists, with North America having 50-65 pathologists per million people, Europe 26 per million, Asia 6.8 per million, and Africa just 4 per million. This shortage slows disease severity assessment, prognostics, and therapy decisions, particularly for cancer, impacting survival rates. In South Asia, approximately 60% of breast cancer (BC) cases are diagnosed at stage III/IV, leading to poor outcomes. Delays in cancer care exceed 30.7 weeks due to patient and system-related issues. Global cancer cases are expected to rise from 2.26 million in 2020 to 2.74 million in 2030. Traditional histological grading by pathologists is manual, time-consuming, and prone to intra-observer (0.85) and inter-observer (0.43) variability.
Methods: To address these challenges, DCS_PathIMS, an automated, AI-driven digital pathology platform is proposed. Whole Slide Imaging (WSI) scanners digitize entire biopsy slides into high-resolution pyramidal TIFF files, which are processed using AI-based deep learning models. DCS_PathIMS has a specialized web-based imaging platform that facilitates the storage, visualization, and annotation of WSI data, integrating AI to assist pathologists in diagnostic workflows.
Results: The proposed DCS_PathIMS platform has been validated with an end-to-end breast cancer histology grading diagnostics workflow. Thus, automation enhances diagnostic accuracy, consistency, and efficiency by reducing human bias and workload. AI-powered analysis identifies known and novel biomarkers, improves reproducibility, and delivers fast, quantified assessments. Pathologists can engage, evaluate, and collaborate remotely, leading to faster and more accurate decisions. The clinician-friendly UI in the proposed platform, designed and validated by clinicians, streamlines workflows and reduces stress.
Conclusion: AI-driven digital pathology addresses the shortage of pathologists and enhances diagnostic efficiency and accuracy. The proposed platform improves clinical decision-making, facilitates faster reporting, reduces false positives/negatives, and supports better patient outcomes through transparent and consistent evaluations. This approach minimizes medical-legal risks and lowers insurance costs, driving advancements in cancer care.
Keywords: Digital Pathology, WSI, Histology Grading, Nottingham Grading, Mitosis imaging marker, Nucleo-Pleomorphism Imaging marker, Biopsy digitization, Tissue biopsy
INTRODUCTION
Breast cancer is the second leading cancer which causes death in females. Breast cancer occurs due to the irregular growth and division of breast cells. Early screening and diagnostics of breast cancer improves successful treatment outcomes and increases chances of survival. Mammography is the first preferred method for early screening of breast cancer in developed countries and Ultrasound (US) screening method in developing countries. Analyzing mammogram breast images for identifying cancerous lesions, tumor regions is very difficult due to its low contrast and noisy nature, especially with dense breast images.
The Breast Imaging Reporting and Data System (BI-RADS) is a standard breast radiology (mammography and ultrasound) reporting system used by radiologists to categorize breast cancer severity. The BI-RADS score ranges from 0 to 6 in which BI-RADS score 4 is for suspicious, 5 is for highly suspicious malignancy and above score 5 are recommended for surgery to perform biopsy analysis.
A tissue biopsy refers to a sample of breast tissue taken out through invasive surgical procedure from a region of interest suspected in a mammogram for further analysis of breast cancer. The extracted biopsy tissues are stained with hematoxylin and eosin (H&E) which shows anomalies in cells and its structures. H&E staining is used by pathologists to visually examine the tissue under a microscope, revealing cellular structures like nuclei and cytoplasm, which are essential for determining the tumor’s characteristics and grade.
Pathologists grade the severity of breast cancer by observing the abnormal growth and rate of spread of cancer cells in the biopsy tissues under a microscope. Low-grade cancer cells look like normal cells (difficult to distinguish), exhibit slower growth, and spread compared to the High-grade cancer cells. Nottingham grading system is the universal histological grading system for breast cancer, which consists of three biomarker components namely mitotic score, percentage of tubular/gland formation and nuclear pleomorphism score.
Mitosis is a cell division process that normally divides a cell into two-identical cells whereas the mitosis cell division of tumor cells produces rapid splitting of daughter cells. Nuclear pleomorphism score defines the three different morphological structures of the cells.
Manual examination of breast cancer tissue specimens under a light microscope is a tedious and time-consuming task to the pathologists, likely lead to higher chance of inter-observer variability for the same specimen. The invention of digital pathology and Whole Slide image Scanners overcomes the above limitations. Digital pathology is also known as whole slide imaging (WSI). The breast cancer tissue slides are digitized using WSI scanners such as Leica, Aperio and Hamamatsu. These scanners produce high resolution pyramidal structure .tiff, .svs images which are of size ranging from 1GB to 20GB.
Digital pathology is a method of using digital technology to capture, store, and analyze images of stained tissue sections. Pathologists can use digital pathology to diagnose diseases by viewing, sharing, and comparing images of patient specimens.
The standard working procedure of digital pathology as given below:
- A whole slide image scanner captures high-resolution images of glass slides.
- Viewing software is used to examine the images on a computer monitor.
- Case management software is used to manage patient information.
BENEFITS OF DIGITAL PATHOLOGY
- Improved efficiency: Pathologists can access and analyze specimens remotely.
- Reduced errors: There is no risk of slides breaking during transport.
- Faster turnaround time: Pathologists can compare specimens more quickly.
- Better views: Pathologists can access archived materials and collaborate with colleagues remotely.
DIGITAL PATHOLOGY AND AI
Pathological AI algorithms can help with diagnostic screening, analysing biomarkers, and improving diagnostic efficiency. Generative AI is experimental. WSI images consist of various image levels with respect to the various zoom levels of the microscope such as 5x, 10x, 20x, 40x and 80x refers to the digital resolution. WSI images are needed for computer vision and artificial intelligence analysis to identify breast cancer biomarkers.
In Artificial Intelligence (AI) applications, computer vision tasks include methods for acquiring, processing, analyzing and understanding digital images. Artificial intelligence models such as deep learning and Gen AI models require annotations to identify mitotic figures and different grades of nuclear pleomorphism cells which are performed by using QUPATH and OpenSeadragon.
Xu H et al summarizes the usage of vision transformers for computer vision tasks in histopathology tissue analysis. They conclude that the performance of Vision Transformers (ViT) is better than CNN models. As CNN models extracts the features of WSI by training on individual sequential patches which unable to extract complete structure of the WSI, whereas ViT extracts the features of WSI by training parallelly on a set of patches which allows the model to capture relationship between distant parts of the image and provide much accurate predictions on WSIs.
The limitations of ViT’s are large amounts of annotated data, massive GPUs for training due to its large architecture consisting of millions of parameters. The authors also observed that instead of pure transformers or CNNs, the hybrid combination of CNN and ViT will be more advantageous to get better accuracies in tile wise predictions as well as WSI predictions.
Farooq H et al proposed a system to detect the presence of mitotic nuclei in a breast tissue slide. They used around 800 WSI from the open datasets MIDOG’22, TUPAC and a private dataset from Shaukat Khanum Memorial Cancer Hospital and Research Center, Lahore, Pakistan. MIdog22 is used for training EfficientNet, ResNet to identify mitotic instances of size 25*25 and then the pretrained model weight of MIDOG22 is used to detect mitosis on the ROI of the WSI of TUPAC and local dataset.
Mercan et al discussed the difficulties in identifying the grades of nuclear pleomorphism as grade-1 nucleoli are like epithelium cells. They used the collective knowledge of 10 pathologists for the selection of ROI in WSI to avoid inter observer variability. The study applied a two deep learning models such as Retinanet and Densenet to score the grades of nuclear pleomorphism. Retinanet identifies epithelial cells and tumor cells by using centroid annotations. Densenet uses the weights of retinanet to score nuclear pleomorphism and the results are obtained a kappa score of 0.56 with pathologists.
Jaroensri et al finetuned Resnet50 to classify the grades for mitosis, nuclear pleomorphism and tubule formation by using 1508 WSI from a medical laboratory and 98 WSI from a tertiary teaching hospital. Three pathologists provide grades for both WSI and 500*500 patches of WSI. The kappa correlation between heatmaps of Resnet50 and Pathologist grading for three biomarkers are 0.64, 0.38 and 0.68 and the F1 score for mitosis grade classification is 0.60. They performed a study to identify the relation between Ki67 and mitosis score and the correlation between them is 0.47.
Hongming Xu et al elaborately reviewed the application of vision transformers (ViT) in the histopathological image analysis tasks such as classification and segmentation on whole slide images. The review compares and contracts the properties of deep learning and ViT for the image analysis tasks. The attention mechanism in ViT provides global dependency features of WSI whereas deep learning extracts local dependency features. The review discussed about the prediction of survival risks by using the combining attention weights of image embeddings and genomic embeddings. The review also pointed the limitation of ViT such as huge volume of data and high-end hardware requirement.
Ruiwen Ding et al identified mitosis and non-mitotic figures on H&E tiles using visual question answering and caption generation LLM models. MIDOG 22 is used to extract image features of mitotic and non-mitotic figures which is having 9501 annotations for mitotic figures and 11051 annotations for non-mitotic figures. CLIP model generates the textual features of H&E tiles with F1 accuracy as 0.798 and BLIP is used for VQA and caption generation with F1 accuracy as 0.860 (mitosis LLM).
Zhiqiang Li et al developed the Dilated Cascading Network (DilCasNet) for detection and classification of mitotic and non-mitotic figures on WSI. DilCasNet is a combined model of transformers and deep learning. The first stage of DilCasNet identified mitosis using global neighboring features of attention weights then in the second stage the integrated deep learning of Efficient Net B7 and VGG16 classifies mitosis and non-mitosis cells. The network trained and tested on the 128*128 tiles of 32 WSI in CMC dataset and F1 accuracy of detection and classification are 77.4% and 83% respectively.
CellViT implemented a Vision transformer for nuclei instance segmentation on H&E images. CellViT is trained and validated on PanNuke dataset having around 200,000 nuclei instances of 19 different types of H&E tissues and the model produces F1 accuracy as 0.83. CellVit used five classes nuclei instances of PanNuke such as neoplastic, epithelial, inflammatory, connective, and dead cells for nuclei instance segmentation. CellViT architecture contains SAM as encoder and Hovernet as decoder in the ViT for the Nuclei segmentation tasks such as background separation, nuclei segmentation and removal of overlapping segmentation and finally it is tested on MoNuSeg dataset for nuclei instance segmentation.
Junjia Huang et al proposed a prompt-based grouping transformer (PGT) for nuclei classification and segmentation. PGT groups the similar features of nuclei by using nuclei embeddings and then by using category embeddings classifies nuclei cell types as neutrophil, epithelial, eosinophil, lymphocyte, plasma, and connective. PGT combines semantic features and imaging features of nuclei in H&E tiles of CoNSep, BRCA-M2C and Lizard by using Shift Window transformer and linear classifier. Prompt embeddings and nuclei group embeddings extracts required nuclei features of the prompt with F1 score as 0.799. StainNET is a 1D-CNN by using the properties of StainGAN is used for WSI color normalization and GradCAm CNN helped to visualize the mitotic regions in the patches of size 100*100. Their model reaches an F1 score of 0.87, 0.833 for MiDoG’22 and TUPAC 16 dataset respectively.
METHODS
The proposed work implements DCS_PathIMS: DigiClinics Pathology Imaging Platform, with DCS_ImageViewer, DCS_ImagesFolio, an AI based web platform performing end to end WSI operations to detect two Nottingham Grading breast cancer biomarkers such as Mitosis and Nucleo pleomorphism (NP) by using two different methodologies, Deep Learning (DL) and Vision Transformers (ViT).
1. DATASET DESCRIPTION:
a. Public Dataset
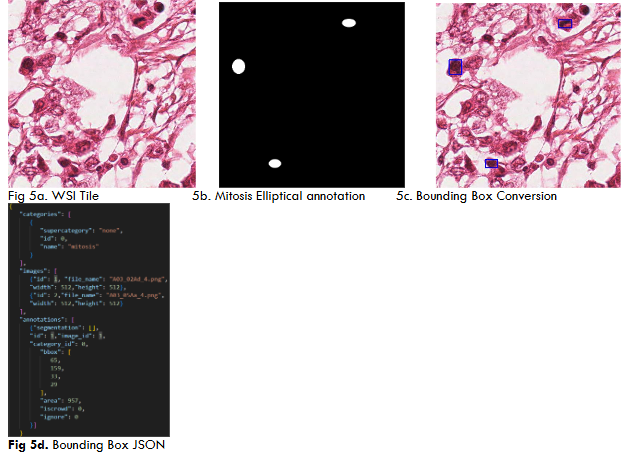
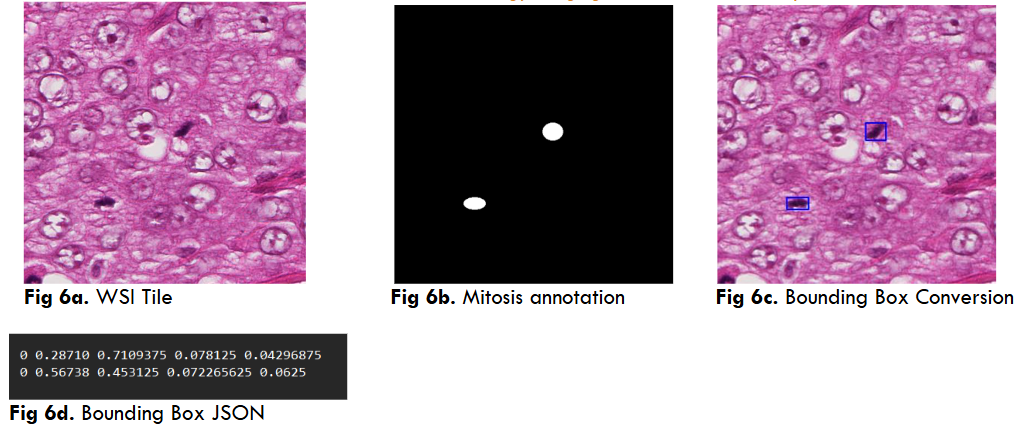
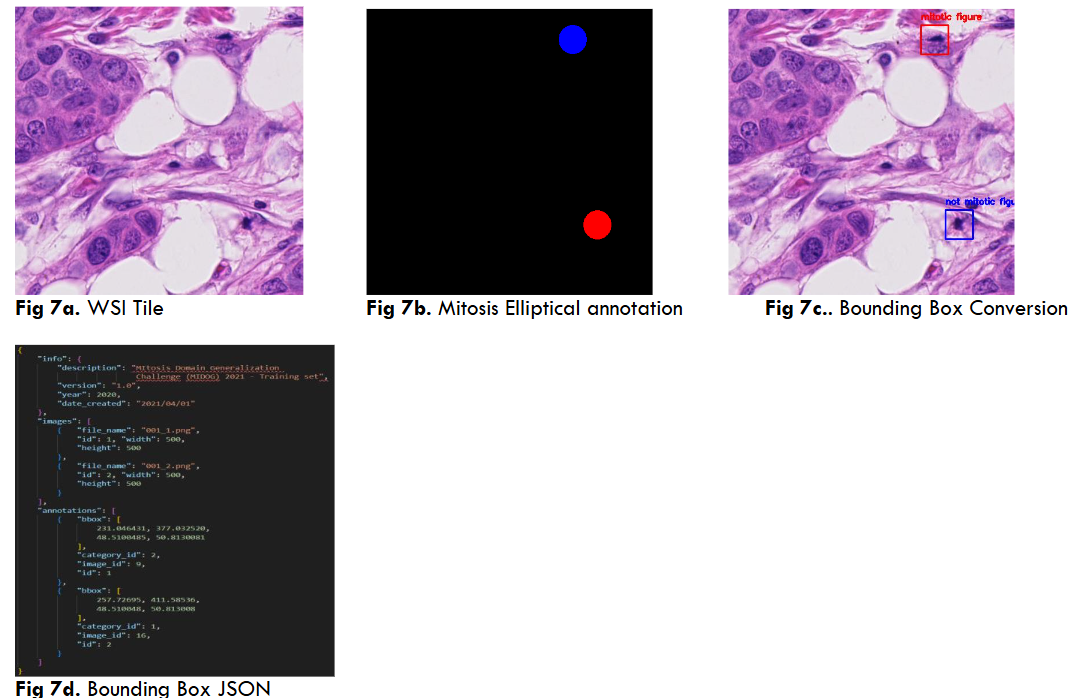
Authors collated following public dataset, ICPR-1225, MIDOG21 which are used to identify mitosis and BreCaHAD which is used to detect Nucleo Pleomorphism. The ICPR-12 dataset has 10 high power fields at 40x magnification which were scanned by three different scanners namely Aperio ScanScope XT slide scanner, Hamamatsu NanoZoomer 2.0-HT slide scanner and 10 bands multispectral microscope. Before augmentation the dataset provided consists of 2994 files which are augmented to 5998 files by applying augmentation techniques like horizontal flip and vertical flip. Each image is of the size 512×512 pixels with a Json file of strong label annotations annotated by pathologists. The Mitosis Domain Generalization Challenge 2021 (MIDOG’21) dataset is used to detect mitotic and non-mitotic figures having 200 tiff files of size 7215 x 5412 pixels which are then broken down into 5988 tiles each of size 500×500 pixels. MIDOG’21 contains strongly labeled annotations of mitosis for 150 tiff images. The BreCaHAD (Breast Cancer Histopathological Annotation and Diagnosis) dataset has 162 H&E stained breast cancer images of size 1360×1024 pixels and 1600 tiles of size 500×500 pixels having weakly annotated mitotic figures.
b. DigiClinics Private Dataset
The authors collated WSI images of Breast Cancer Biopsy slides from Basavatarakam Indo-American Cancer Hospital (BIACH&RI), Hyderabad and Tapadia Diagnostic Center (TDC), Hyderabad. BIACH&RI send breast tissue biopsy slides (with no PII data) to TDC. TDC apply the necessary chemical stains, namely H&E and IHC (Immunohistochemistry) on these slides, subsequently digitize them using Morphle Digital Pathology Scanner housed in their lab. Digitized slides will be uploaded onto DCS_PathIMS platform through web. This dataset is called DigiClinics (DC) private Dataset which contains 150 whole slide images. DigiClinics dataset contains 150 whole slide images. The dataset for mitosis contains 15,000 annotated tiles of size 500×500 with around 55,000 mitosis instances which were obtained from 45,000 augmented tiles using horizontal flip and vertical flips. The annotations were present in the form of csv files such that one file for each corresponding tile. These strongly annotated files were then used for fine tuning using YoloV5 and DETR models. The dataset for Nucleo pleomorphism contains 6512 tiles of 500×500 pixels with 3865 tiles for Grade1, 5004 tiles for Grade2 and 3853 tiles for Grade3. Similar to mitosis dataset, these annotations were present as csv files with different class names for different grades. All the dataset, which are used by the proposed platform are as listed in Table 1.
| Dataset | Image Size | Number of Tiles before Augmentation | Number of Tile after Augmentation | Label type | Annotation type |
|---|---|---|---|---|---|
| ICPR 12 | 512×512 | 2994 | 5,988 | Strong | JSON |
| MIDOG 21 | 7215×5412 | 4251 | 4251 | Strong | JSON |
| DC | 500×500 | 15000 | 45000 | Strong | CSV |
| BreCaHAD | 1360×1024 | 162 | 1600 | weak | JSON |
| DC NP | 500 x 500 | 6512 | 6512 | Strong | CSV |
The convolutional Neural Network (CNN), YoloV5 and Vision Transformer, DETR are used to detect mitosis and NP. Both the models are trained and tested by using by both public dataset and DC private dataset.
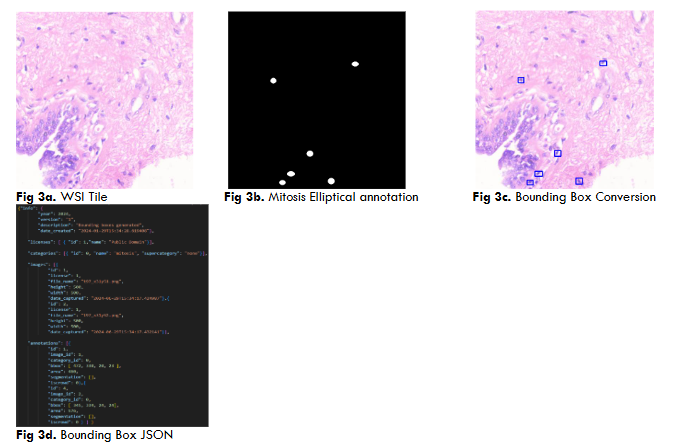
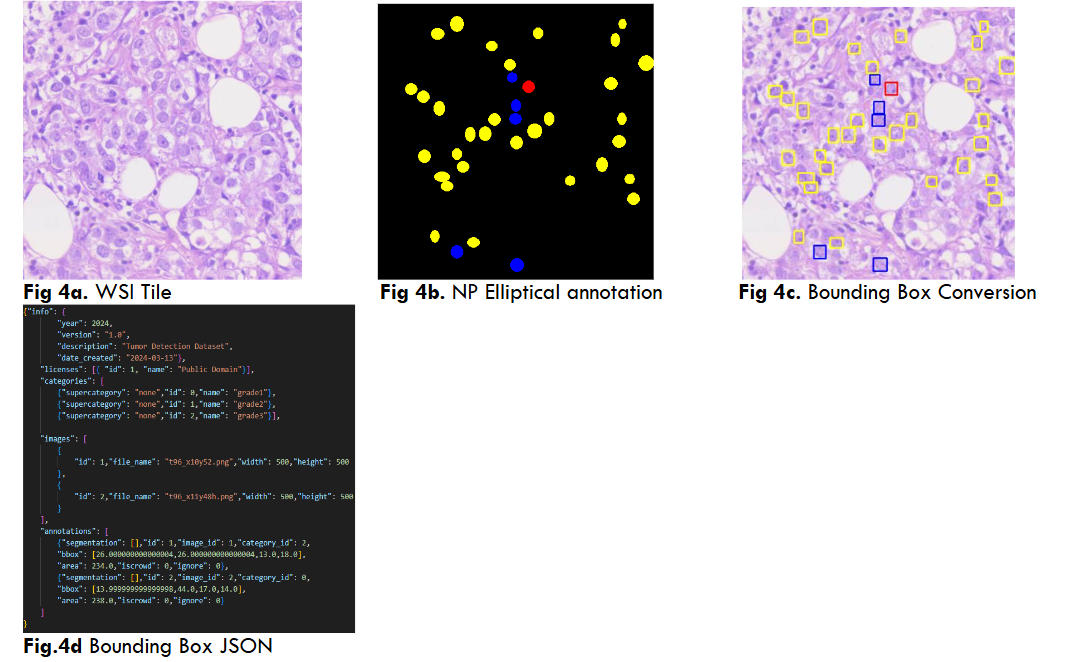
2. DC IMAGES ANNOTATION:
International dataset annotation (YoloV5, DETR) Mitosis, NP (8 images) DCS_PathIMS platform performs all the WSI analysis tasks which are needed for both pathologist and AI programmers. The web platform provides all facilities for WSI operations such as upload, view, generate tiles, annotation tools, JSON and mask creation and AI model prediction. The breast WSI images of size 8GB to 15GB approximately is uploaded in the platform which divides the uploaded WSI into its pyramid structure having various zoom level resolution tiles such as 5x,10x,20x and 40x. AI models uses 40x zoom level resolution for predictions as they are the highest resolution tiles of WSI. Both DL and ViT required annotations of mitosis and Nucleo pleomorphism (NP) for training/testing which was performed by three pathologists on DCS_PathIMS Platform.
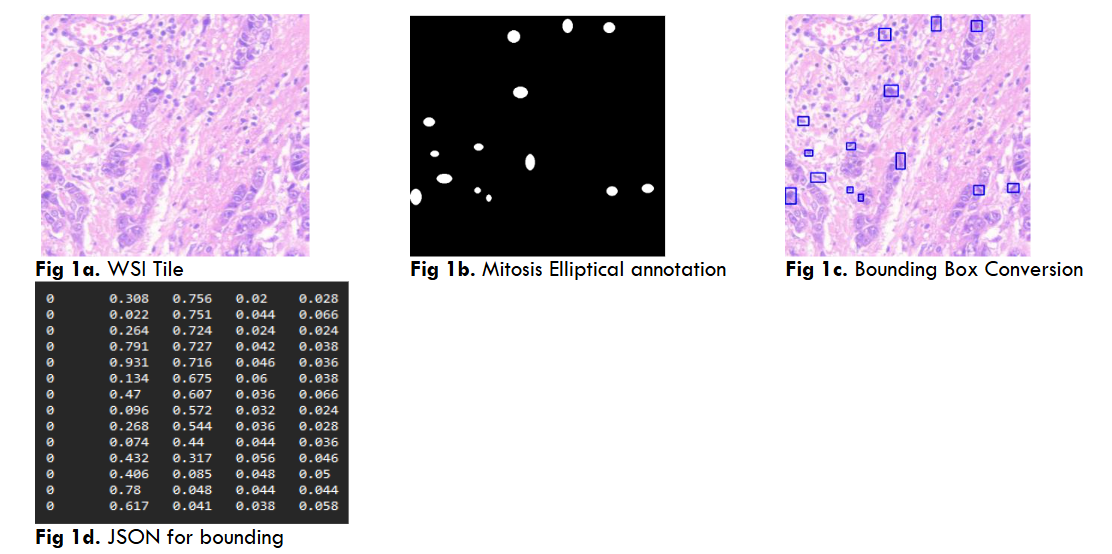
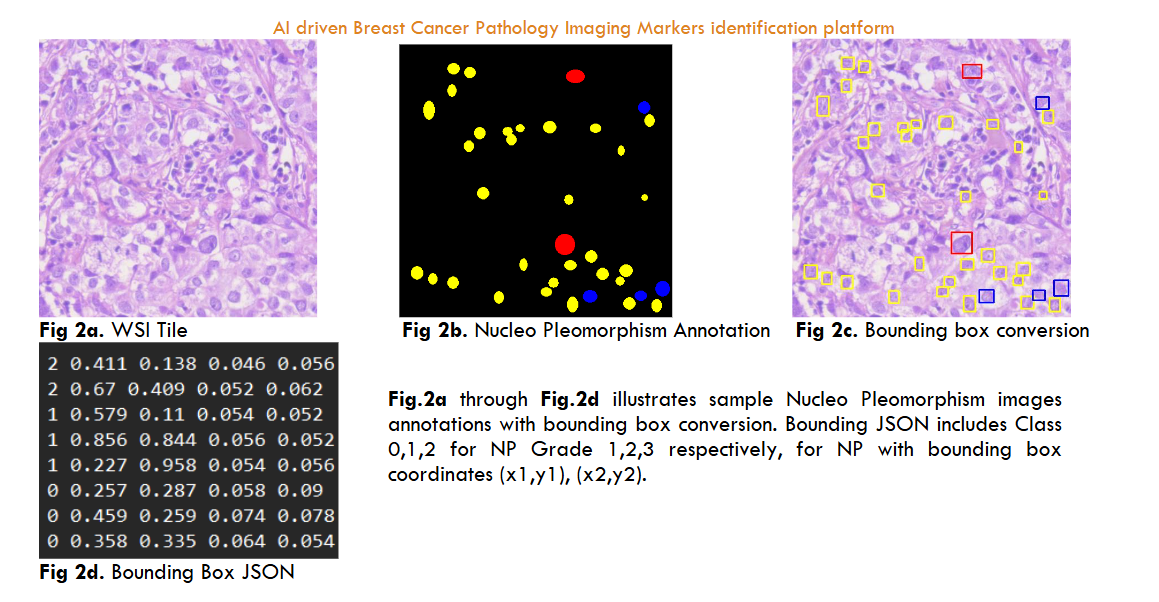
Both YoloV5 and DETR models require annotations on a .txt file with bounding box coordinates ((x1,y1),(x2,y2)) and Json file with a left corner coordinate of the bounding box, width, and height of the bounding box (x1,y1,w,h) respectively.
RESULTS
The proposed system uses Detection Transformer and YoloV5 models to detect cancerous cells for Mitosis and Nucleo pleomorphism objects segmentation. Both these models were trained and tested using ICPR12, MIDOG21, BraCaHAD, DC dataset for mitosis and nuclear pleomorphism objects segmentation.
The Detection Transformer model gives an average precision (AP) of 0.81 on ICPR-12, AP of 0.6 on MIDOG21, an AP of 0.35 on the BreCaHAD dataset (weakly annotated). The model produces an AP of 0.74 on the DC-Mitosis dataset and an average AP of 0.47 for all three grades.
The YoloV5 model produced a mean average precision (MAP) of 0.95 on the ICPR-12 dataset, an MAP of 0.97 on DC-mitosis dataset and an MAP of 0.94 for DC-np dataset.
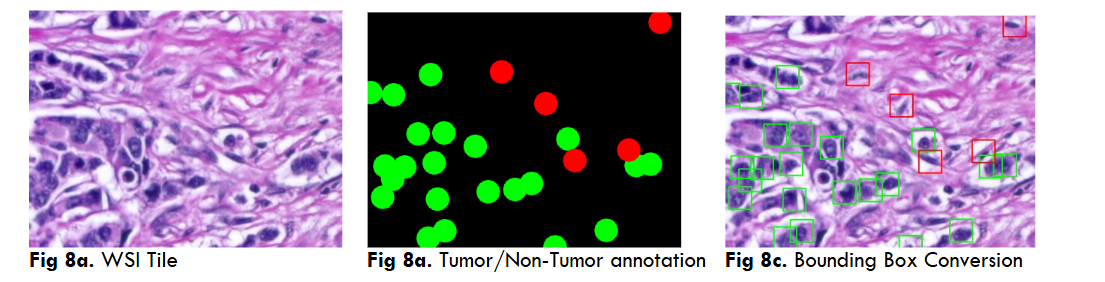
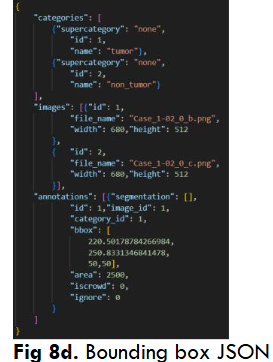
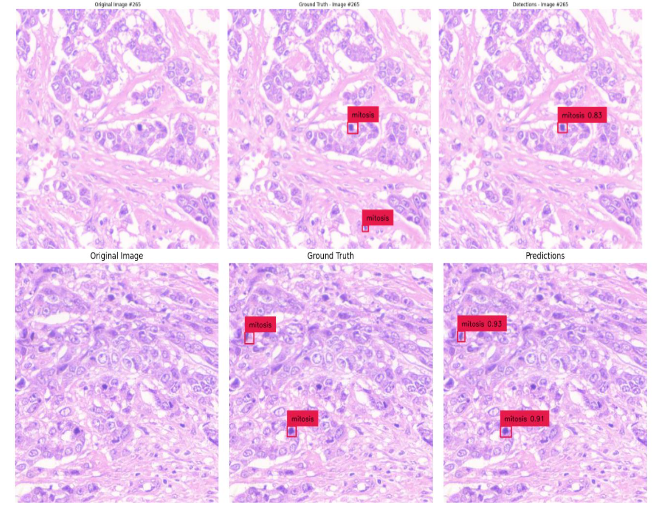
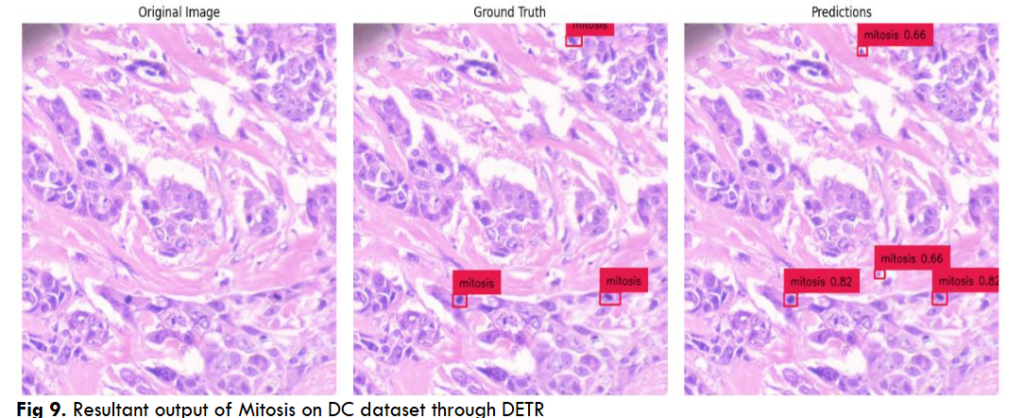
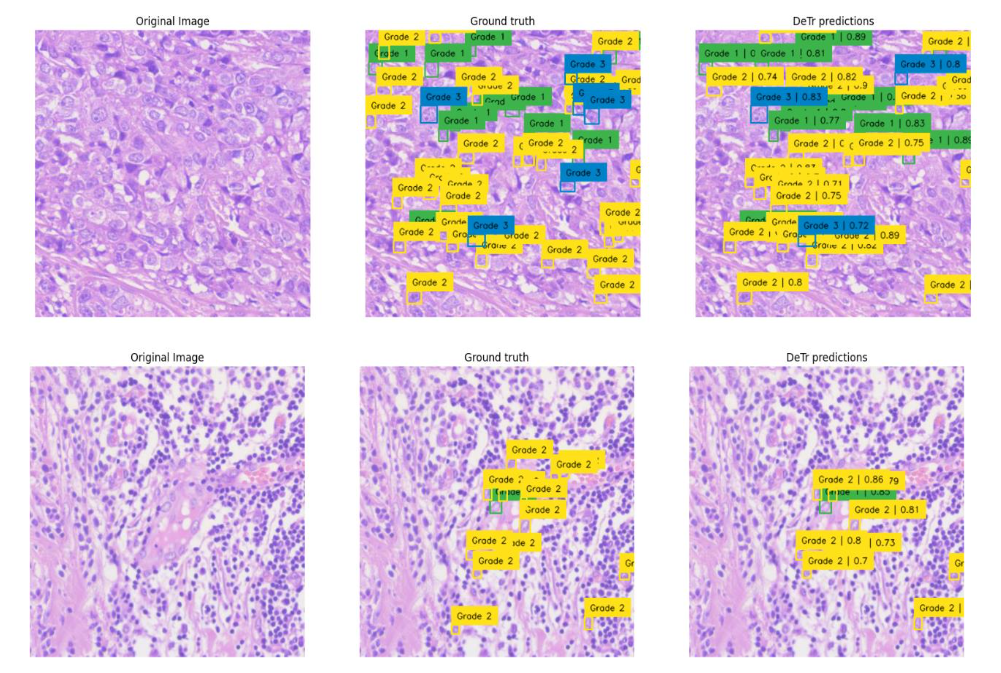
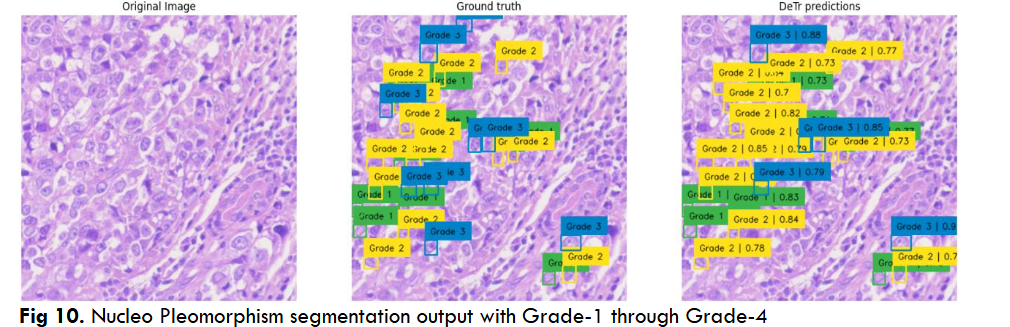
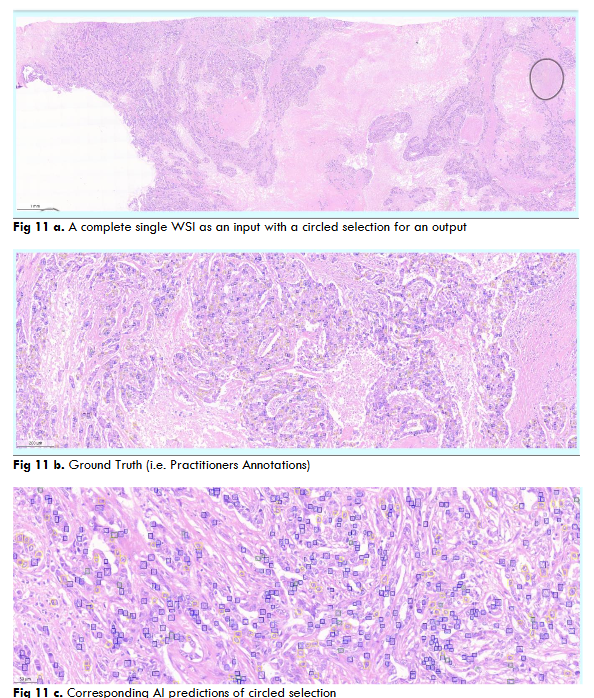
Fig.12 Illustrates resultant output of Mitosis object segmentation using DC dataset through DETR model on a complete single WSI image. The resultant output contains AI predictions of mitosis objects segmented in red color bounding squares.
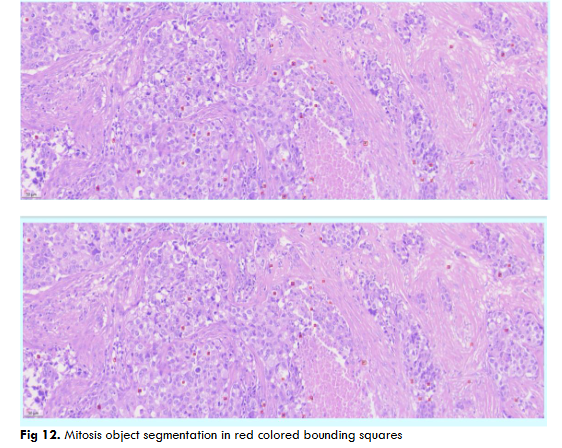
Fig.13 Illustrates resultant output of Breast Cancer Mitosis object segmentation using DC dataset through YoloV5 model. These outputs are individual tiles wise mitosis object segmentation of a single WSI image. Each output contains a. Original inputted image b. Ground Truth, i.e. Practitioners Annotations and c. Corresponding AI predictions.
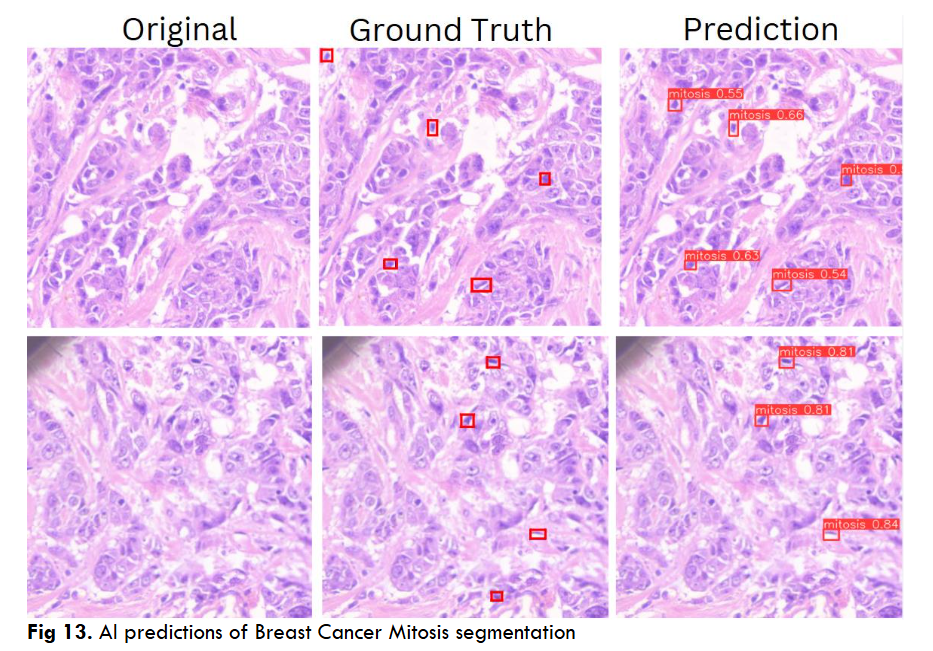
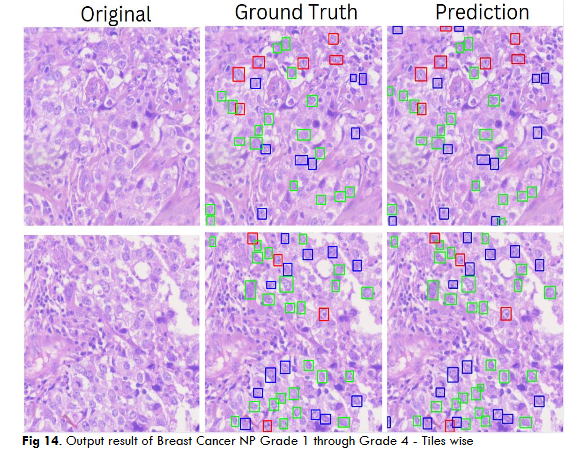
Fig.14 Illustrates resultant output of Breast Cancer Nucleo pleomorphism Grade 1 through Grade 4 object segmentation using DC dataset through YoloV5 model. These outputs are individual tiles wise NP object segmentation of a single WSI image. Each output contains a. Original inputted image b. Ground Truth, i.e. Practitioners Annotations and c. Corresponding AI predictions.
RESULTS SUMMARY MODEL WISE
Detection Transformer (DETR)
The results of DETR model are listed for both Mitosis and NP tasks in Table 2.
YoloV5 Model
The results of YoloV5 model are listed for both Mitosis and NP tasks in Table 3.
| Biomarker | Dataset Name | Training | Testing | Metric | Epochs | Time |
|---|---|---|---|---|---|---|
| Nucleo Pleomorphism | ICPR 12 | 2770 | 512 | AP = 0.81 | 400 | 6 hours |
| Mitosis | DC | 38000 | 7000 | AP = 0.74 | 85 | 48 hours |
| Nucleo Pleomorphism | MIDOG 21 | 3400 | 850 | AP = 0.6 | 200 | 10 hours |
| Nucleo Pleomorphism | Np grade 1 | 3,865 | 968 | AP = 0.41 | 200 | 8 hours |
| Nucleo Pleomorphism | Np grade 2 | 5004 | 1254 | AP = 0.48 | 200 | 10 hours |
| Nucleo Pleomorphism | Np grade 3 | 3853 | 947 | AP = 0.54 | 200 | 8 hours |
| Tumor/non-tumor | 1247 | 314 | AP = 0.35 | 350 | 11 hours |
| Biomarker | Dataset Name | Training | Testing | Metric | Epochs | Time |
|---|---|---|---|---|---|---|
| Nucleo Pleomorphism | ICPR 12 | 2770 | 512 | MAP= 0.95 | 400 | 3 hours |
| Mitosis | DC | 38000 | 7000 | MAP= 0.97 | 900 | 12 hours |
| Nucleo Pleomorphism | DC | 3,865 | 968 | MAP= 0.94 | 500 | 8 hours |
DISCUSSION
Herewith, authors detailing out all the AI models used for the study.
AI-DEEP LEARNING:
a. YoloV5 (You Only Look Once)
YoloV5 is a state-of-the-art, real-time object detection model. The model divides the image into a grid of multiple sizes (18*18,36*36,72*72) of bounding boxes and predicts the class probabilities of the objects in each grid simultaneously. This model consists of following three major modules:
- CSP Darknet: The backbone of this model, which is the modified version of cross stage partial network (CSPNet) and is responsible for features extraction. It consists of convolution layers which extract features at different levels as low-level features like edges, textures and high-level features like shapes and object parts.
- PaNet (Path aggregation Network): This module acts as the neck of the model. It ensures efficient flow of information between layers by applying both top-down pathway and bottom-up pathway which passes information from deep layers to shallow layers and vice-versa. PaNet also consists of feature pyramid network (FPN) which outputs proportional sized feature maps of different sizes and resolutions.
- Head Layer: The YoloV5 head layer generates the final prediction by using multiple detection heads. The model sets the anchor boxes initially then uses it to create bounding boxes with class probabilities, scale changes. The head includes multiple convolution layers and activation functions, during inference YoloV5 uses NMS (Non-Max Suppression) to eliminate overlapping detection boxes which results in the final object.
YoloV5 performs classification and segmentation of the objects in a single forward pass of the neural network delivers highly accurate results and generated predictions in less time compared to other deep learning models.
b. Detection Transformers
Detection Transformer (DETR) is a novel object detection model. This model is based on transformer architecture (Encoder and Decoder). DETR does not use NMS or anchor boxes like other models, namely YoloV5 and R-CNN models, thus improving the training with the optimization of fewer hyper-parameters.
DETR model is based on multi-head self-attention models as described in Attention is All You Need by A. Vaswani et al. As compared to previous models the DETR model can capture global context by looking at the positions and relations of the objects in the image and parallelly makes the final set of predictions whereas recurrent networks or CNNs makes predictions sequentially. This feature makes DETR as simpler and more efficient.
DETR ARCHITECTURE
The transformer architecture based DETR model consist of following components:
- Backbone (CNN): The image is first passed through a CNN backbone which provides image feature representations at a high level. Some examples of popular CNN backbones are Visual Geometry Group (VGG) and ResNet. These features contain spatial information about the objects in the image, which is then passed as input to the transformer encoder.
- Transformer Encoder: The transformer encoder encodes these features into a sequence of feature vectors. As the encoder contains multi-headed self-attention blocks, it allows for capturing contextual information through long-range dependencies between different parts of an image and the positional encodings of the images are added into CNN’s output. As transformers do not inherently have spatial understanding, these positional encodings inform them about the relative positions of the objects in the image.
- Transformer Decoder: The transformer decoder learns relationships between the CNN encoded features and the learnable object queries. Typically, we require queries, keys, and values to calculate self-attention in NLP. Therefore, in computer vision, DETR introduces the concept of object queries, which refer to the learnable representations of the objects needs to predict. The number of object queries is predetermined and remains fixed. The keys denote the spatial locations in the image, while the values contain information about the features.
- Prediction Heads: The prediction heads gives the positions of the bounding boxes and classes of the detected objects. They consist of feed-forward network which predicts either the bounding box and class for the detected objects or a ‘no-object’ class for non-existing objects. Furthermore, DETR employs the technique of bipartite matching to ensure that the predicted bounding boxes are associated with the ground truth objects which helps to refine the model training.
- Hungarian matching algorithm: The Hungarian matching algorithm is used in DETR (Detection Transformers) to match predicted object detections with ground truth objects in a one-to-one manner. This is necessary because DETR predicts a fixed number of object queries (e.g., 100) for every image, regardless of the actual number of objects. The algorithm ensures that each predicted query is matched to a ground truth object or marked as “no object.”
The matching is formulated as a linear assignment problem, where the goal is to minimize the overall cost of matching predictions to ground truths. The cost is computed based on:
- Classification Error: How accurately the predicted class matches the ground truth label.
- Bounding box loss: The difference between the predicted bounding box and the ground truth box, measured using a combination of L1 loss and generalized IoU (Intersection-over-Union).
Bipartite Loss function: The bipartite matching loss plays a crucial role after applying the Hungarian matching algorithm. Once the optimal one-to-one matching between predicted outputs (queries) and ground truth objects is established by Hungarian matching, the bipartite loss is used to evaluate how well these matched pairs align. This loss combines two components: classification loss, which measures how accurately the predicted class matches the ground truth label, and bounding box loss, which evaluates the similarity between the predicted and true bounding box coordinates. By optimizing this loss, DETR ensures that the model learns to make accurate predictions for both object categories and their precise locations, making it a fundamental part of its end-to-end training process.
CONCLUSION
The proposed DCS_PathIMS platform demonstrates significant potential in transforming breast cancer diagnostics through AI-driven digital pathology. By automating histology grading and biomarker identification using Whole Slide Imaging (WSI) and deep learning models, the platform enhances diagnostic accuracy, consistency, and efficiency. The integration of AI minimizes intra- and inter-observer variability, accelerates diagnostic turnaround times, and reduces the burden on pathologists. Its clinician-friendly interface and remote collaboration capabilities further streamline workflows, enabling faster and more accurate clinical decisions. Ultimately, DCS_PathIMS empowers pathologists with AI-assisted insights, driving improvements in breast cancer prognostics and patient outcomes while reducing diagnostic errors and healthcare costs.
FUTURE DIRECTIONS:
Future work will focus on expanding the capabilities of DCS_PathIMS to include multi-modal data integration, combining histology with genomic and proteomic data for deeper insights into tumor biology. The platform’s AI models will be further enhanced with larger and more diverse datasets to improve generalizability across populations and cancer subtypes. Integration with the BrCAI Nexus (a next-generation of DCS_PathIMS platform) platform will enable clinical trial acceleration by linking biomarker-driven insights with patient stratification and targeted therapy development. Additionally, GenAI-driven de novo protein design will be explored to identify novel therapeutic targets and improve drug response prediction. Collaborative validation studies across multiple clinical centers will be conducted to further enhance the platform’s robustness and clinical utility in precision oncology.
ACKNOWLEDGEMENT:
Dr. Rohit Tapadia, MBBS, MD, Director, Tapadia Diagnostic Centre for the Clinical and Biomedical Advisory and Evaluation.
Prof. Neil Gogte, Director, Keshav Memorial Institute of Technology for the Project Guidance, Finance and Material support.
Funding: None
Organisation: Neil Gogte Institute of Technology, Keshav Memorial Institute of Technology, Tapadia Diagnostic Center
Place: Hyderabad
Conflicting Interest: None
REFERENCES
- Sung, H.; Ferlay, J.; Siegel, R.L.; Laversanne, M.; Soerjomataram, I.; Jemal, A.; Bray, F. Global cancer statistics 2020: GLOBOCAN estimates of incidence and mortality worldwide for 36 cancers in 185 countries. Cancer J. Clin.2021, 71, 209–249.
- Nicosia, L.; Gnocchi, G.; Gorini, I.; Venturini, M.; Fontana, F.; Pesapane, F.; Abiuso, I.; Bozzini, A.C.; Pizzamiglio, M.; Latronico, A.; et al. History of Mammography: Analysis of Breast Imaging Diagnostic Achievements over the Last Century. Healthcare 2023, 11, 1596.
- Arian, Arvin, et al. “The breast imaging-reporting and data system (BI-RADS) made Easy.” Iranian Journal of Radiology 19.1 (2022).
- S.K. Suvarna, C. Layton, J.D. Bancroft, Bancroft’s Theory and Practice of Histological Techniques. Elsevier, 2019.
- Dunn, C., Brettle, D., Cockroft, M. et al. Quantitative assessment of H&E staining for pathology: development and clinical evaluation of a novel system. Diagn Pathol 19, 42 (2024).
- Gandhi, Hardik, et al. “Correlation of Robinson’s cytological grading with Elston and Ellis’ Nottingham modification of bloom Richardson score of histopathology for breast carcinoma.” Maedica 18.1 (2023): 55.
- Elston, C. W., & Ellis, I. O. (1991). Pathological prognostic factors in breast cancer. I. The value of histological grade in breast cancer: experience from a large study with long-term follow-up. Histopathology, 19(5), 403–410.
- Lashen, Ayat G., et al. “Assessment of proliferation in breast cancer: cell cycle or mitosis? An observational study.” Histopathology 79.6 (2021): 1087-1098.
- Das, Asha, Madhu S. Nair, and David S. Peter. “Batch mode active learning on the Riemannian manifold for automated scoring of nuclear pleomorphism in breast cancer.” Artificial Intelligence in Medicine 103 (2020): 101805.
- Rashmi, R., Keerthana Prasad, and Chethana Babu K. Udupa. “Breast histopathological image analysis using image processing techniques for diagnostic purposes: A methodological review.” Journal of Medical Systems 46.1 (2022): 7.
- Iyengar, Jayaram N. “Whole slide imaging: The futurescape of histopathology.” Indian Journal of Pathology and Microbiology 64.1 (2021): 8-13.
- Ibrahim, A., Gamble, P., Jaroensri, R., Abdelsamea, M. M., Mermel, C. H., Chen, P. C., & Rakha, E. A. (2020). Artificial intelligence in digital breast pathology: Techniques and applications. Breast (Edinburgh, Scotland), 49, 267–273.
- Subramanian, D., Devika, D., Tapadia, D., & Singh, R. (2022). KMIT-Pathology: Digital Pathology AI Platform for Cancer Biomarkers Identification on Whole Slide Images. International Journal of Advanced Computer Science and Applications.
- M.P. Humphries, P. Maxwell, M. Salto-Tellez, QuPath: The global impact of an open source digital pathology system, Computational and Structural Biotechnology Journal, Volume 19, 2021, Pages 852-859.
- OpenSeadragon-An Open-Source, Web-Based Viewer for High-Resolution Zoomable Images, Implemented in Pure JavaScript, for Desktop and Mobile.
- Xu H, Xu Q, Cong F, Kang J, Han C, Liu Z, Madabhushi A, Lu C. Vision Transformers for Computational Histopathology. IEEE Rev Biomed Eng. 2024;17:63-79.
- Farooq H, Saleem S, Aleem I, Iftikhar A, Sheikh UN, Naveed H. Toward interpretable and generalized mitosis detection in digital pathology using deep learning. DIGITAL HEALTH. 2024;10.
- Mercan, C., Balkenhol, M., Salgado, R. et al. Deep learning for fully-automated nuclear pleomorphism scoring in breast cancer. npj Breast Cancer 8, 120 (2022).
- Jaroensri, R., Wulczyn, E., Hegde, N. et al. Deep learning models for histologic grading of breast cancer and association with disease prognosis. npj Breast Cancer 8,113 (2022).
- Xu H, Xu Q, Cong F, Kang J, Han C, Liu Z, Madabhushi A, Lu C. Vision Transformers for Computational Histopathology. IEEE Rev Biomed Eng. 2024;17:63-79.
- Ding, R., Hall, J., Tenenholtz, N., & Severson, K. (2023). Improving Mitosis Detection on Histopathology Images Using Large Vision-Language Models. 2024 IEEE International Symposium on Biomedical Imaging (ISBI), 1-5.
- Li Z, Li X, Wu W, Lyu H, Tang X, Zhou C, Xu F, LuoB, JiangY, LiuXandXiangW (2024), A novel dilated contextual attention module for breast cancer mitosis cell detection. Front. Physiol. 15:1337554.
- Fabian Hörst, Moritz Rempe, Lukas Heine, Constantin Seibold, Julius Keyl, Giulia Baldini, Selma Ugurel, Jens Siveke, Barbara Grünwald, Jan Egger, Jens Kleesiek, CellViT: Vision Transformers for precise cell segmentation and classification, Medical Image Analysis, Volume 94, 2024, 103143.
- Huang, Junjia & Li, Haofeng & Sun, Weijun & Wan, Xiang & Li, Guanbin. (2023). Prompt-Based Grouping Transformer for Nucleus Detection and Classification.
- Roux Ludovic, Racoceanu Daniel, Loménie Nicolas, Kulikova Maria, Irshad Humayun, Klossa Jacques, Capron Frédérique, Genestie Catherine, Le Naour Gilles, Gurcan Metin N, Mitosis detection in breast cancer histological images An ICPR 2012 contest, Journal of Pathology Informatics, Volume 4, Issue 1, 2013.
- Marc Aubreville, Nikolas Stathonikos, Christof A. Bertram, Robert Klopfleisch, Natalie ter Hoeve, Francesco Ciompi, Frauke Wilm, Christian Marzahl, Taryn A. Donovan, Andreas Maier, Jack Breen, Nishant Ravikumar, Youjin Chung, Jinah Park, Ramin Nateghi, Fattaneh Pourakpour, Rutger H.J. Fick, Saima Ben Hadj, Mostafa Jahanifar, Adam Shephard, Jakob Dexl, Thomas Wittenberg, Satoshi Kondo, Maxime W. Lafarge, Viktor H. Koelzer, Jingtang Liang, Yubo Wang, Xi Long, Jingxin Liu, Salar Razavi, April Khademi, Sen Yang, Xiyue Wang, Ramona Erber, Andrea Klang, Karoline Lipnik, Pompei Bolfa, Michael J. Dark, Gabriel Wasinger, Mitko Veta, Katharina Breininger, Mitosis domain generalization in histopathology images — The MIDOG challenge, Medical Image Analysis, Volume 84, 2023.
- Aksac, A., Demetrick, D.J., Ozyer, T. et al. BreCaHAD: a dataset for breast cancer histopathological annotation and diagnosis. BMC Res Notes 12, 82 (2019).
- Morphle Labs. (n.d.). Homepage. Morphle Labs. Retrieved [date you accessed the site], from https://www.morphlelabs.com/
- Rajasekaran Subramanian, R. Devika Rubi, Rohit Tapadia, Katakam Karthik, Mohammad Faseeh Ahmed and Allam Manudeep, “Web based Mitosis Detection on Breast Cancer Whole Slide Images using Faster R-CNN and YOLOv5” International Journal of Advanced Computer Science and Applications (IJACSA), 13(12), 2022.
- Wu, W., Liu, H., Li, L., Long, Y., Wang, X., Wang, Z., Li, J., & Chang, Y. (2021). Application of local fully Convolutional Neural Network combined with YOLO v5 algorithm in small target detection of remote sensing image. PLoS ONE, 16.
- Carion, N., Massa, F., Synnaeve, G., Usunier, N., Kirillov, A., & Zagoruyko, S. (2020). End-to-End Object Detection with Transformers. ArXiv, abs/2005.12872.
- Ashish Vaswani, Noam Shazeer, Niki Parmar, Jakob Uszkoreit, Llion Jones, Aidan N. Gomez, Łukasz Kaiser, and Illia Polosukhin. 2017. Attention is all you need. In Proceedings of the 31st International Conference on Neural Information Processing Systems (NIPS’17).