

Acipimox Impact on Insulin Resistance in Type 1 Diabetes
Acipimox in Type 1 Diabetes: fatty acids as a potential, but challenging, therapeutic target
Katie L. Kaput1, Ellen Lyon2, Irene E. Schauer3,4,5,
1. Division of Endocrinology. University of Utah, Salt Lake City, UT
2 .Sleep and Metabolism Laboratory, Colorado State University, Fort Collins, CO
3 .Division of Endocrinology, University of Colorado Anschutz Medical Campus, Aurora, CO
4 .Department of Medicine, Denver Veterans Affairs Medical Center, Denver, CO
5 .Eastern Colorado Geriatric Research, Education, and Clinical Center, Denver, CO
OPEN ACCESS
PUBLISHED: 31 December 2024
CITATION: Kaput, KL., Lyon, E., et al., 2024. Acipimox in Type 1 Diabetes: fatty acids as a potential, but challenging, therapeutic target. Medical Research Archives, [online] 12(12). https://doi.org/10.18103/mra.v12i12.6170
COPYRIGHT © 2024 European Society of Medicine. This is an open-access article distributed under the terms of the Creative Commons Attribution License, which permits unrestricted use, distribution, and reproduction in any medium, provided the original author and source are credited.
DOI https://doi.org/10.18103/mra.v12i12.6170
ISSN 2375-1924
ABSTRACT
Objective: To examine the effect of acute, isolated non-esterified fatty acid lowering, on insulin action, arterial stiffness and cardiac autonomic function in type I diabetes.
Methods: Randomized, double-blind, crossover trial of acipimox versus placebo in participants with and without type 1 diabetes (n=9 and 8, respectively).
Results: Participants with type 1 diabetes were more insulin resistant than controls and exhibited increased arterial stiffness (pulse wave velocity and augmentation index), autonomic dysregulation (heart rate variability), cardiac diastolic dysfunction (E:A ratio), and increased cardiac contractility (fractional shortening) with preserved cardiac output. Acipimox treatment was confounded by a pronounced early rebound effect. However, independent of acipimox, within-subject higher pretest fatty acid levels corresponded to greater insulin resistance, higher mean tachycardic heart rates at rest, and possibly increased cardiac output.
Conclusions: These findings confirm and expand upon previous observations that individuals with type 1 diabetes are more insulin resistant and exhibit cardiovascular changes consistent with increased sympathetic tone. The correlation of poor peripheral glucose utilization and cardiovascular changes with elevated fatty acid levels suggests that lowering fatty acid levels may improve insulin sensitivity and decrease sympathetic tone. In the future, a more durable or targeted method of fatty acid lowering could represent a novel cardioprotective target of intervention in people with type 1 diabetes.
Keywords
Type 1 Diabetes, Acipimox, Non-Esterified Fatty Acids, Insulin Resistance, Cardiovascular Disease
Introduction:
Cardiovascular disease (CVD) remains the leading cause of death in participants with type 1 diabetes (T1D). The overall risk of CVD in participants with T1D compared to participants without diabetes is two to threefold higher in men and three to fivefold higher in women. This risk persists despite management of conventional CVD risk factors such as blood pressure, dyslipidemia, smoking and intensive glycemic control. Prediction models for determining CVD risk are currently available, but grossly underestimate CVD risk in persons with T1D. Multiple studies now indicate that risks outweigh benefits of glycemic control that is more intensive than current guidelines in both type 1 and type 2 diabetes. Furthermore, while a link between elevated hemoglobin A1C (HbA1c) and CVD was initially suggested by the Pittsburgh diabetes control and complications trial/epidemiology of diabetes interventions and complications study (DCCT/EDIC), this has since been discounted. These discrepancies in the current literature highlight a significant gap in our therapeutic approach to CVD risk in participants with T1D and provide the rationale for an investigation of other therapeutic targets which may be unaddressed in this high-risk population.
Insulin resistance, a known correlate of CVD risk in T2D has also been demonstrated and linked to CVD in T1D. A 10-year-follow up from the Pittsburgh EDIC study in T1D, identified insulin resistance-related factors, rather than glycemia and standard CVD risk factors, as the most significant predictor of coronary artery disease endpoints. Similarly, a cohort of participants with T1D and well-matched controls without diabetes were followed for six years to assess coronary artery calcification (CAC) and CVD outcomes in the CACTI study. Participants with T1D were found to be more insulin resistant than persons without diabetes, despite adjustment for age, sex, BMI and fasting glucose. Further, the insulin resistance that was observed in this cohort did not correlate with glycemic control, but was associated with CAC volume and predicted presence and progression of CAC suggesting that insulin resistance may play a significant role in CVD risk in participants with T1D. Similarly, other studies, including the Paris Prospective Study have further demonstrated that hyperinsulinemia, presumably due to insulin resistance, is an independent predictor of cardiovascular death.
To date, the exact mechanism of insulin resistance in T1D is not well understood. Acute non-esterified fatty acid (NEFA) elevation has been shown in multiple studies to induce insulin resistance in lean and obese persons without diabetes. Conversely, isolated NEFA lowering with acipimox, a nicotinic acid analog approved for the treatment of lipid disorders in Europe, has been shown to improve insulin resistance and endothelial and mitochondrial function in people with and without T2D. In the CACTI study, Schauer et al. demonstrated that defective insulin-mediated suppression of NEFA is present in T1D as well. If NEFA concentrations prove to be a significant contributor to insulin resistance in T1D, then this could represent a novel target of intervention. Therefore, we proposed to test the hypothesis that sub-acute, isolated NEFA lowering with acipimox, would improve insulin action, as well as vascular correlates of insulin resistance in participants with T1D.
Methods:
Study population:
Participants with type I diabetes (T1D, n=9) and controls without diabetes (non-DM, n=8) were recruited from the CACTI cohort, by campus emailing by flyer posting, and through clinical relationships of the PI. Inclusion criteria were age 25 to 59, HbA1c 6-9.5% (T1D only), and willingness to commit to 14 days of prescribed diet and study medication and two 44-hour inpatient stays. Participants were excluded for tobacco use, pregnancy, steroid use, scheduled physical activity > 3 days a week, angina or any other cardiovascular or pulmonary symptoms, a history of COPD or asthma, uncontrolled hypertension, proteinuria >200 g/day or a creatinine >153 µmol/L, proliferative retinopathy, any comorbid condition associated with inflammation, insulin resistance or dyslipidemia (including type 2 diabetes), niacin treatment, history of peptic ulcers, history of known hereditary angioedema or C1 esterase deficiency, uncontrolled thyroid disease, or anemia.
Study design:
The hypothesis was tested in a double-blind, placebo-controlled, random order, crossover design study. Participants took acipimox 250 mg PO QID or matching placebo for one week each in random order with a >two-week wash-out period between phases. An investigation of new drug approval from the FDA was obtained to use acipimox to investigate the effect of NEFA lowering on insulin action in individuals with T1D (IND#107649). Acipimox was purchased from ™Pfizer, and blinded capsules of acipimox and placebo were prepared by the University of Colorado Research Pharmacy. Written and informed consent was obtained from each participant prior to the initiation of the study.
Continuous glucose monitoring:
Participants with T1D underwent blinded continuous glucose monitoring (CGM, (Dexcom 7plus system) for three days prior to the inpatient hyperinsulinemic-euglycemic clamp visit. Reported CGM measures included: mean glucose, percentage of hypoglycemic events (glucose < 3.9 mmol/L), percentage of hyperglycemic events (glucose > 9.9 mmol/L) and glycemic variability within days. Modification of insulin could be made to allow for improved safety and avoid changes in glycemic control that might occur during the acipimox treatment.
Physical activity monitoring:
Participants were provided with an Actigraph accelerometer to wear during each week of the study drug and were prescribed a standardized diet (40% carbohydrate, 35% fat, 25% protein) for two x 3 days before their inpatient baseline studies.
Blood collection and sampling:
Laboratory assessment for glucose, insulin levels, triglycerides, glycerol, lactate and NEFA levels were drawn during study visits every 1-3 hours for a total of 24 hours and once for the measurement of endothelial, inflammatory (endothelin 1, interleukin 6, TNF- α, and hsCRP) and prothrombotic (PAI-1) markers. Blood samples to determine baseline hormone function and substrate (insulin, glucose, C-peptide, NEFA, glycerol and lactate) concentrations were also drawn the morning before the initiation of the clamp.
Hyperinsulinemic-euglycemic clamp:
Participants were admitted to the clinical translational research center (CTRC) on the evening of day six for a 24-hour period of frequent metabolic labs while on the prescribed diet with usual insulin dosing. At the end of the 24-hour period, participants fasted for > 12 hours and those with type 1 diabetes were transitioned to intravenous insulin with blood sugar monitoring and insulin infusion adjustments to achieve euglycemia by morning and clear residual subcutaneous insulin. In the morning, hyperinsulinemic-euglycemic clamp was performed using the method of deFronzo et al, as referenced in the CACTI study, but omitting the lowest insulin stage (4 mU/m2/min) to complete a three hour, two-stage clamp with 8 and 40 mU/m2/min insulin infusion. The rate of glucose infusion was adjusted based on arterialized blood specimens drawn every five minutes with plasma glucose quantified using a hand-held glucose analyzer (Precision Xceed Pro) at the bedside. Blood samples were also obtained for the determination of free fatty acids, triglycerides, insulin, and glycerol at the end of each stage of the clamp. Glucose disposal (M-value) is expressed as milligrams of glucose per kilogram body mass per minute and after normalization for final serum insulin concentration.
Arterial stiffness:
Arterial stiffness was assessed, noninvasively, by ™Sphygmocor BPAS 1 device (Atcor Medical) applanation tonometry measurement of augmentation index (AIx) and pulse wave velocity (PWV) as described elsewhere.
Autonomic function:
Cardiac autonomic function was measured by heart rate variability (HRV) using standard methods including variation in R-R interval with cycled deep breathing to a metronome, R-R variation with the Valsalva maneuver, and orthostatic heart rate and blood pressure as previously described.
Echocardiography:
Resting two-dimensional echocardiography was performed using Vivid 7 and Echopac (BTO6 V6.1.3; General Electric, Milwaukee, WI) as previously described.
Statistical Analysis:
This study was intended as a proof of concept, mechanistic study and was powered to detect acipimox-mediated improvement in insulin sensitivity within the diabetes cohort. Ten participants with diabetes were expected to provide 80% power to detect one standard deviation (SD) improvement in the final glucose infusion rate (GIR). Data for the study was collected from each subject, verified and entered into a computer database. A group t-test was used to compare participants with and without type 1 diabetes. Paired t-testing was used to compare placebo and acipimox values for both primary outcome and secondary outcomes. In addition, data were sorted by pretest fatty acid levels and outcomes were compared for high versus low pretest fatty acid levels by paired t-test. All data are presented as a mean±SD. Two-sided P values < 0.05 were interpreted as an indication of statistical significance.
Results:
Baseline characteristics:
Baseline characteristics for all participants are shown in Table 1. Seventeen participants met the criteria for randomization (9=T1D and 8=non-DM) and underwent both phases of the intervention. Participants were well matched for body mass index (BMI), blood pressure, % body fat, renal function, liver function, inflammatory markers, and baseline lipid profile. As expected, HbA1c) and fasting glucose were higher in the participants with T1D compared to controls. Consistent with previous reports adiponectin concentrations were also higher in participants with T1D. Participants with T1D were older, predominantly female (66.7%), and more likely to be on a statin and have a documented diagnosis of hypertension, than the individuals without diabetes.
| T1D | Non-DM | P Value | |
|---|---|---|---|
| Male | 2:9 | 3:8 | N/A |
| Female | 7:9 | 5:8 | N/A |
| Age | 48 ±8 | 39 ±12 | 0.01 |
| Creatinine (µmol/L) | 76 ±23 | 69 ±8 | 0.22 |
| AST (ukat/L) | 0.40 ±0.31 | 0.37 ±0.12 | 0.80 |
| ALT (ukat/L) | 0.35 ±0.18 | 0.33 ±0.13 | 0.95 |
| A1C (%) | 7.2 ±0.9 | 5.1 ±0.2 | < 0.01 |
| Serum Glucose (mmol/L) | 9.55 ±3.55 | 4.36 ±0.56 | < 0.01 |
| Adiponectin (µg/mL) | 13.2 ±9 | 6.4±3 | < 0.01 |
| HDL (mmol/L) | 1.3 ±0.3 | 1.3 ±0.3 | 0.92 |
| Systolic BP (mmHg) | 102 ±9 | 101 ±11 | 0.93 |
| Diastolic BP (mmHg) | 67 ±6 | 69 ±8 | 0.62 |
| Triglycerides (mmol/L) | 0.6 ±0.5 | 0.7 ±0.3 | 0.45 |
| TNF-α (pg/mL) | 1.8 ±0.9 | 1.4 ±0.8 | 0.31 |
| IL-6 (pg/mL) | 3.5 ±2.6 | 3.1 ±2 | 0.60 |
| CRP (nmol/L) | 24.8 ±28.6 | 14.3 ±9.5 | 0.20 |
| Height (cm) | 170 ±10 | 175 ±9 | 0.50 |
| Body fat (%) | 32 ±6 | 29 ±12 | 0.50 |
| BMI (kg/m2) | 27 ±4 | 26 ±5 | 0.60 |
| Statin Treatment | 3:7 | 0:8 | N/A |
| History of Hypertension | 2:9 | 0:8 | N/A |
Participants with T1D differ from those without DM in insulin sensitivity and cardiovascular measures:
Insulin Sensitivity:
Participants with T1D were more insulin resistant by hyperinsulinemic-euglycemic clamp than those without diabetes (Table 2). These findings were even more pronounced after adjustment for final insulin clamp concentration which was higher in participants with T1D compared those without.
| T1D | Non-DM | P value | |
|---|---|---|---|
| Final clamp glucose (mmol/L) | 5.1 ±0.5 | 4.9 ±0.2 | 0.30 |
| Final clamp insulin concentration (µIU/mL) | 102 ±43 | 59 ±22 | 0.03 |
| GIR Stage I (mg glucose/kg/min) | 0.64 ±0.37 | 1.7 ±0.6 | <0.001 |
| M-value Stage 2 (mg glucose/kg/min) | 3.7 ±1.5 | 9.0 ±2.9 | <0.001 |
| M/I Stage 2 (mg glucose/kg/min/IU/ml) x100 | 4.1 ±2.1 | 19.4 ±13.9 | 0.008 |
Vascular Compliance:
Compared to participants without T1D, participants with T1D exhibited increased arterial stiffness based on increased HR-adjusted Augmentation Index (Aix) and faster pulse wave velocity (PWV) despite similar systolic blood pressure (Table 3).
| T1D | Non-DM | P value | |
|---|---|---|---|
| Aix (%) | 20.5 ± 9 | 11.75 ±12 | 0.03 |
| PWV (m/sec) | 9.6 ±2.8 | 7.2 ±1.3 | 0.005 |
| Systolic BP (mmHg) | 102 ±9 | 101 ±11 | 0.93 |
Cardiac autonomic function:
Participants with T1D exhibited evidence of autonomic dysfunction, specifically sympathetic dominance, based on heart rate variability measurements. Mean tachycardic and bradycardic extremes during deep respiration were higher in T1D participants than in non-DM controls (Table 4). However, the difference in maximum and minimum heart rate with respiratory variation was not significantly different between participants with and without T1D. In contrast, during Valsalva maneuver participants with T1D had both significantly higher heart rates and decreased tachycardia:bradycardia ratio (Table 4). Heart rates were also faster in T1D participants during rest in both the standing and the supine positions (Table 4).
| T1D | Non-DM | P Value | |
|---|---|---|---|
| Mean tachycardia during cycled breathing (bpm) | 74 ±6 | 70 ±6 | 0.04 |
| Mean bradycardia during cycled breathing (bpm) | 61 ±7 | 53 ±9 | 0.010 |
| Average difference with cycled breathing | 13 ±7 | 17 ±7 | 0.20 |
| Standing HR | 80 ±11 | 67 ±11 | 0.002 |
| Supine HR | 66 ±7 | 56 ±9 | 0.002 |
| Valsalva Tachycardia (bpm) | 93 ±9 | 87 ±10 | 0.06 |
| Valsalva bradycardia (bpm) | 67 ±9 | 54 ±7 | < 0.001 |
| Valsalva tachy:brady ratio | 1.4 ±0.1 | 1.6 ±0.2 | 0.002 |
Cardiac function:
Participants with T1D again exhibited increased heart rate in addition to diastolic dysfunction based on reduced mitral valve E:A ratio, increased contractility based on fractional shortening, and preserved overall cardiac output (Table 5). Stroke volume was decreased and ejection fraction increased, though these did not achieve statistical significance.
| T1D | Non-DM | P-value | |
|---|---|---|---|
| Heart rate on echo | 69 ± 8 | 57 ± 11 | 0.005 |
| MV E:A ratio | 1.26 ± 0.35 | 1.82 ± 0.68 | 0.02 |
| % fractional shortening | 42 ± 11 | 29 ± 6 | 0.003 |
| Ejection fraction | 72.0 ± 4.6 | 69.4 ± 5.1 | 0.07 |
| Stroke volume | 68 ± 9 | 74 ± 7 | 0.11 |
| Cardiac Output (L/min) | 4.7 ± 0.8 | 5.6 ± 3.8 | 0.39 |
Effects of acipimox:
Non-esterified fatty acid levels:
Unfortunately, acipimox did not significantly lower mean 24-hour NEFA levels in T1D after one week of treatment as expected (343 ±122 µM in the acipimox group vs. 297 ±56 µM in the placebo group, p=0.28). Very similar results were seen in the nonDM population. This was due largely to an earlier than expected and profound rebound effect.
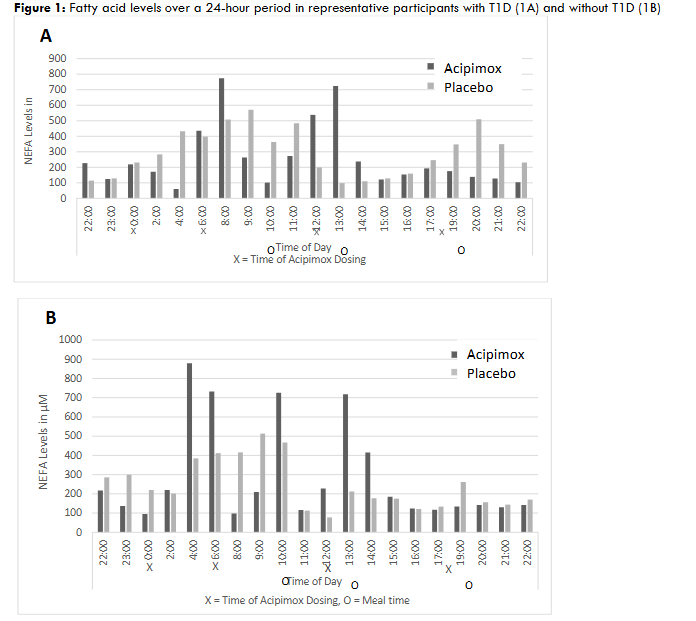
Fatty acid levels increased significantly prior to and just after acipimox dosing, particularly overnight and in the morning. There was then a one-to-two-hour lag before NEFA lowering occurred following dosing. Mealtimes and insulin administration further confounded the acipimox effect.
Effect of acipimox on glycemic control:
Acipimox did not significantly improve glucose control over the seven days of study drug. During continuous glucose monitoring (CGM), there were no significant hypoglycemic or hyperglycemic events prior to inpatient clamp visit (T1D only), and glycemic control remained well matched between the two treatment phases (Table 6). Participants with T1D did appear to spend more time in the glycemic target range during acipimox treatment though this did not achieve statistical significance. They did have significantly lower average preclamp overnight glucose levels. In addition, average total daily insulin dose during the week of treatment and total preclamp overnight insulin infusion appeared lower with acipimox, but also did not reach statistical significance (Table 6).
| Acipimox | Placebo | P Value | |
|---|---|---|---|
| Average 7-day glucose (mmol/L) | 8.8 ± 1.2 | 9.1 ± 0.7 | 0.7 |
| Standard Deviation Glucose | 3.64 ± 0.92 | 3.64 ± 0.66 | 0.86 |
| Average total daily insulin | 62.4 ± 13.5 | 73.8 ± 15.0 | 0.06 |
| % Hyperglycemic time | 12 ±8 | 12 ±6 | 0.72 |
| % Hypoglycemic time | 3.7 ± 2.8 | 2.8 ± 4.1 | 0.86 |
| % Target blood glucose | 45 ± 13 | 37 ± 9 | 0.23 |
| Average preclamp overnight glucose | 7.7 ± 1.2 | 8.6 ± 1.2 | 0.02 |
| total preclamp overnight insulin | 9.0 ± 4.1 | 10.4 ± 2.5 | 0.14 |
Preclamp NEFA levels acutely affect insulin sensitivity:
Despite the overall failure of acipimox to consistently lower NEFA levels, preclamp NEFA levels did vary between the two study phases, especially in participants with T1D. When clamp results were sorted based on high versus low preclamp serum NEFA levels, M-value was significantly higher (greater insulin sensitivity) when preclamp NEFA levels were lower. This relationship was consistent and statistically significant in T1D, but not in participants without diabetes (Table 7).
| NEFA levels in µM | M-value Stage II (mg glucose/kg/min) | M/insulin x 100 |
|---|---|---|
| T1D High | 735 ± 606 | 3.2 ± 1.0 |
| T1D Low | 256 ± 113 | 5.2 ± 1.6 |
| P value | 0.048 | 0.007 |
| nonDM High | 427 ± 174 | 8.8 ± 3.0 |
| nonDM Low | 237 ± 152 | 9.6 ± 2.7 |
| P-value | 0.05 | 0.30 |
Preclamp NEFA levels acutely affect cardiac autonomic input, but not vascular stiffness:
Higher pretest NEFA levels also correlated with increased mean tachycardic heart rates, with a trend towards an increase in mean bradycardic heart rates, but no statistically significant effect on AIx @ HR 75 bpm or PWV (Table 8).
| Pretest NEFA levels (µM) | Mean Tachycardia (bpm) | Mean Bradycardia (bpm) | Mean AIx | Mean PWV | |
|---|---|---|---|---|---|
| High | 494 ±151 | 73 ±7 | 59 ±9 | 18.8 ±10.4 | 10.1 ±3.2 |
| Low | 177 ±119 | 70 ±6 | 57 ±8 | 21.0 ±19.0 | 9.7 ±2.8 |
| P value | < 0.001 | 0.02 | 0.08 | 0.39 | 0.75 |
Study termination:
The study was terminated slightly prematurely (after n=9 T1D participants) due to an unexpected serious adverse event. One participant had recurrent mild hypoglycemia (50-70 mg/dL) during the overnight stay prior to the hyperinsulinemic euglycemia clamp. This was corrected appropriately but recurred in the AM around the time of his preclamp acipimox dose. He was again provided with glucose to correct the hypoglycemia. Over the next hour he had recurrent vasovagal symptoms and became increasingly bradycardic and hypotensive. He denied chest pain or shortness of breath. He was placed in fully recumbent position with legs slightly elevated and the saline infusion was opened fully. Repeat BP was 90s/50s. Soon after he again became nauseated and presyncopal, and now noted some chest pain. BP was now 60s/40s, and the medical response team alert was called. EKG showed a RBBB and some T-wave inversions, and heart rate dropped as low as the 30s. He demonstrated some seizure activity, and a short period of unresponsiveness, and a code blue was called. He was given a dose of atropine, started on a dopamine drip, and his blood pressure and clinical picture stabilized, though his heart rate remained in the 50s. Emergency unblinding revealed that he was on the active study drug, not placebo. He was moved to the cardiac ICU and then to the cath lab where angiography showed no occlusive disease. Prior to going to the cath lab the participant was stable and comfortable with a heart rate in the 80s and blood pressure of 104/68 on dopamine at 5 mcg/hr.
Discussion:
Our results again demonstrate that, despite similar baseline characteristics and increased adiponectin serum concentrations, participants with T1D are more insulin resistant than well matched non-DM controls. They also exhibit markers of increased arterial stiffness, diastolic dysfunction, and reduced heart rate variability indicative of autonomic dysfunction, all of which are known risk factors for cardiovascular disease and/or heart failure. These findings strengthen and confirm previous observations of increased insulin resistance in T1D, seen in the CACTI cohort and further highlight the importance of examining mechanisms of insulin resistance within this population. Insulin resistance may represent a novel CVD risk-modifying therapeutic target in this high-risk population.
Studies in type 2 diabetes and other insulin resistant populations have demonstrated that even acute NEFA lowering with acipimox improves insulin sensitivity. Our original objective was to use acipimox to suppress lipolysis and explore the effects of NEFA lowering in T1D. However, due to an early and pronounced rebound effect, acipimox did not stably reduce NEFA concentrations. This observation is consistent with the previously described rebound effect of acipimox. However, at one week, this effect occurred earlier and much more rapidly in our study than has previously been reported. Therefore, we are unable to conclude that the participants’ NEFA levels decreased over the course of the acipimox treatment intervention. Despite this, observed trends from the final week CGM data and from preclamp overnight glucose and insulin values suggest, but do not prove, improved insulin sensitivity with acipimox vs placebo in the T1D participants. Finally, there were no significant differences between acipimox and placebo treatment with regards to the surrogate cardiovascular risk measures.
Despite this, the study design did provide two parallel study visits in each subject. Since NEFA levels were quite different at the two visits, we were able to examine the within-subject relationship between NEFA level and insulin resistance and cardiovascular measures. When analyzed based on pretest NEFA levels, we were able to demonstrate an inverse correlation between elevated preclamp NEFA levels and insulin sensitivity and a positive correlation between elevated pretest NEFA levels and measures of sympathetic dominance in vascular autonomic tone. These findings indicate that NEFA lowering may improve insulin resistance and potentially CVD risk in T1D. However, the precise mechanism by which higher NEFA levels lead to insulin resistance and the possible effects on sustained NEFA reduction on surrogates of cardiovascular dysfunction in T1D remain unknown. More recent studies suggest that certain proinflammatory NEFA may be responsible for this.
To date, no durable pharmacologic method of NEFA lowering exists. As previously described and further confirmed here, acipimox, does not represent a clinically viable NEFA-lowering intervention. Diet, lifestyle interventions, and exercise are interventions which are known to improve insulin resistance, but are difficult to sustain lifelong. Thiazolidinediones (TZDs) have been shown to lower NEFA levels, but have not been extensively studied in T1D, especially in terms of cardiovascular effects. In addition, the pleiotropic effects of TZDs and recent cardiovascular studies in Type 2 diabetes have raised concerns regarding their side effect profiles, including cardiovascular side effects. A selective, partial agonist of the A1 adenosine receptor may represent an effective therapy for participants with T2D and dyslipidemia via free fatty acid lowering which is more sustained than acipimox. However, more recent work has suggested that deletion of this receptor improves glucose control and insulin sensitivity in a rodent model, suggesting a more complex interaction there as well. Other possibilities being pursued in the literature include more selective efforts to decrease levels of particular proinflammatory fatty acids rather than universally lowering NEFA levels.
Finally, our serious adverse event raises the possibility that lowering NEFA levels may increase the potential harm from hypoglycemia. Our adverse event may have been partly a vasovagal response, but the prolonged hypotension and bradycardia argue against this as the only cause. Fatty acids are a preferred substrate for myocardial metabolism, and lowering both glucose and NEFA has the potential to lead to bradycardia and impaired contractility.
This study had several significant limitations. First was the failure of the study drug to have its intended effect on NEFA levels. However, as described above, the study still provided valuable insights into the effects of NEFA levels on insulin sensitivity and autonomic function. Second, our cohort with T1D was older than our cohort without diabetes. This may have confounded our comparison of participants with and without T1D, contributing to the defects in insulin sensitivity and vascular compliance in our T1D cohort. However, other differences between the cohorts (higher statin use and higher adiponectin in the T1D cohort) would be expected to have the opposite effects on insulin sensitivity and cardiovascular age and may have balanced out the effect of age. Finally, the study was small in size and may have been underpowered to detect effects of NEFA on several of our outcomes.
Conclusion:
Insulin resistance is a clinically under recognized factor and possible contributor to increased CVD risk in participants with T1D. These results confirm and expand upon the presence of insulin resistance in individuals with T1D which was seen in the previously reported NIH-CACTI study. Although elevated NEFA levels have been shown to impair insulin action and vascular function and compliance in persons with T2D, the role of NEFA elevation and effects of NEFA lowering in individuals with T1D is not understood. Our results suggest that NEFA lowering could have insulin sensitizing and cardiovascular benefit in T1D. Current treatments which acutely lower NEFA concentrations are available, but none that induce sustained lowering of NEFA levels are clinically available. In the future, a more durable or targeted method of NEFA lowering could improve insulin resistance and impact cardiovascular outcomes in participants with T1D.
Conflict of Interest: None of the authors have any conflicts of interest to declare.
Funding statement: Funding sources for this study include the American Diabetes Association (ADA 7-11-JF-42) and the Eastern Colorado Geriatric Research, Education, and Clinical Center.
Acknowledgments:
Author contributions: K.K. performed the analysis and wrote the manuscript, E.L recruited and scheduled participants, ran study visits, and provided data, I.E.S. designed the study, obtained funding, obtained IRB and FDA approvals, provided data, and extensively edited the manuscript.
References:
- Schnell O, Cappuccio F, Genovese S, Standl E, Valensi P, Ceriello A. Type 1 diabetes and cardiovascular disease. Cardiovasc Diabetol. Oct 28 2013;12:156. doi:10.1186/1475-2840-12-156
- Zgibor JC, Piatt GA, Ruppert K, Orchard TJ, Roberts MS. Deficiencies of cardiovascular risk prediction models for type 1 diabetes. Diabetes care. Aug 2006;29(8):1860-5. doi:10.2337/dc06-0290
- Action to Control Cardiovascular Risk in Diabetes Study G, Gerstein HC, Miller ME, et al. Effects of intensive glucose lowering in type 2 diabetes. N Engl J Med. Jun 12 2008;358(24):2545-59. doi:10.1056/NEJMoa0802743
- Kahler P, Grevstad B, Almdal T, et al. Targeting intensive versus conventional glycaemic control for type 1 diabetes mellitus: a systematic review with meta-analyses and trial sequential analyses of randomised clinical trials. BMJ Open. Aug 19 2014;4(8):e004806. doi:10.1136/bmjopen-2014-004806
- Orchard TJ, Olson JC, Erbey JR, et al. Insulin resistance-related factors, but not glycemia, predict coronary artery disease in type 1 diabetes: 10-year follow-up data from the Pittsburgh Epidemiology of Diabetes Complications Study. Diabetes care. May 2003;26(5):1374-9. doi:10.2337/diacare.26.5.1374
- Wajchenberg BL, Feitosa AC, Rassi N, Lerario AC, Betti RT. Glycemia and cardiovascular disease in type 1 diabetes mellitus. Endocrine practice : official journal of the American College of Endocrinology and the American Association of Clinical Endocrinologists. Oct 2008;14(7):912-23. doi:10.4158/EP.14.7.912
- Bonora E, Formentini G, Calcaterra F, et al. HOMA-estimated insulin resistance is an independent predictor of cardiovascular disease in type 2 diabetic subjects: prospective data from the Verona Diabetes Complications Study. Diabetes care. Jul 2002;25(7):1135-41. doi:10.2337/diacare.25.7.1135
- Bonora E, Kiechl S, Willeit J, et al. Insulin resistance as estimated by homeostasis model assessment predicts incident symptomatic cardiovascular disease in caucasian subjects from the general population: the Bruneck study. Diabetes care. Feb 2007;30(2):318-24. doi:10.2337/dc06-0698
- Fontbonne A, Charles MA, Thibult N, et al. Hyperinsulinaemia as a predictor of coronary heart disease mortality in a healthy population: the Paris Prospective Study, 15-year follow-up. Diabetologia. May 1991;34(5):356-61. doi:10.1007/BF00405009
- Schauer IE, Snell-Bergeon JK, Bergman BC, et al. Insulin resistance, defective insulin-mediated fatty acid suppression, and coronary artery calcification in subjects with and without type 1 diabetes: The CACTI study. Diabetes. Jan 2011;60(1):306-14. doi:10.2337/db10-0328
- Boden G, Lebed B, Schatz M, Homko C, Lemieux S. Effects of acute changes of plasma free fatty acids on intramyocellular fat content and insulin resistance in healthy subjects. Diabetes. Jul 2001;50(7):1612-7.
- Dresner A, Laurent D, Marcucci M, et al. Effects of free fatty acids on glucose transport and IRS-1-associated phosphatidylinositol 3-kinase activity. J Clin Invest. Jan 1999;103(2):253-9. doi:10.1172/JCI5001
- Hoeg LD, Sjoberg KA, Jeppesen J, et al. Lipid-induced insulin resistance affects women less than men and is not accompanied by inflammation or impaired proximal insulin signaling. Diabetes. Jan 2011;60(1):64-73. doi:db10-0698 [pii] 10.2337/db10-0698
- Homko CJ, Cheung P, Boden G. Effects of free fatty acids on glucose uptake and utilization in healthy women. Diabetes. Feb 2003;52(2):487-91.
- Kashyap SR, Ioachimescu AG, Gornik HL, et al. Lipid-induced insulin resistance is associated with increased monocyte expression of scavenger receptor CD36 and internalization of oxidized LDL. Obesity (Silver Spring). Dec 2009;17(12):2142-8.
- Liu J, Jahn LA, Fowler DE, Barrett EJ, Cao W, Liu Z. Free fatty acids induce insulin resistance in both cardiac and skeletal muscle microvasculature in humans. J Clin Endocrinol Metab. Feb 2011;96(2):438-46. doi:jc.2010-1174 [pii] 10.1210/jc.2010-1174
- Liu Z, Liu J, Jahn LA, Fowler DE, Barrett EJ. Infusing lipid raises plasma free fatty acids and induces insulin resistance in muscle microvasculature. J Clin Endocrinol Metab. Sep 2009;94(9):3543-9.
- McLachlan KA, Alford FP. The impact of acute elevation of non-esterified fatty acids on insulin sensitivity and secretion in women with former gestational diabetes. Clin Endocrinol (Oxf). Jan 2005;62(1):79-84.
- Bajaj M, Suraamornkul S, Kashyap S, Cusi K, Mandarino L, DeFronzo RA. Sustained reduction in plasma free fatty acid concentration improves insulin action without altering plasma adipocytokine levels in subjects with strong family history of type 2 diabetes. J Clin Endocrinol Metab. Sep 2004;89(9):4649-55.
- Cusi K, Kashyap S, Gastaldelli A, Bajaj M, Cersosimo E. Effects on insulin secretion and insulin action of a 48-h reduction of plasma free fatty acids with acipimox in nondiabetic subjects genetically predisposed to type 2 diabetes. Am J Physiol Endocrinol Metab. Jun 2007;292(6):E1775-81. doi:00624.2006 [pii] 10.1152/ajpendo.00624.2006
- Hadigan C, Liebau J, Torriani M, Andersen R, Grinspoon S. Improved Triglycerides and Insulin Sensitivity with 3 Months of Acipimox in HIV-infected Patients with Hypertriglyceridemia. J Clin Endocrinol Metab. Aug 29 2006;
- Lehto HR, Parkka J, Borra R, et al. Effects of acute and one-week fatty acid lowering on cardiac function and insulin sensitivity in relation with myocardial and muscle fat and adiponectin levels. J Clin Endocrinol Metab. Sep 2012;97(9):3277-84. doi:10.1210/jc.2012-1219
- Phielix E, Jelenik T, Nowotny P, Szendroedi J, Roden M. Reduction of non-esterified fatty acids improves insulin sensitivity and lowers oxidative stress, but fails to restore oxidative capacity in type 2 diabetes: a randomised clinical trial. Diabetologia. Mar 2014;57(3):572-81. doi:10.1007/s00125-013-3127-2
- Saloranta C, Taskinen MR, Widen E, Harkonen M, Melander A, Groop L. Metabolic consequences of sustained suppression of free fatty acids by acipimox in patients with NIDDM. Diabetes. Nov 1993;42(11):1559-66.
- Santomauro AT, Boden G, Silva ME, et al. Overnight lowering of free fatty acids with Acipimox improves insulin resistance and glucose tolerance in obese diabetic and nondiabetic subjects. Diabetes. Sep 1999;48(9):1836-41.
- Goodpaster BH, Coen PM. Improved mitochondrial function is linked with improved insulin sensitivity through reductions in FFA. Diabetes. Aug 2014;63(8):2611-2. doi:10.2337/db14-0277
- DeFronzo RA, Tobin JD, Andres R. Glucose clamp technique: a method for quantifying insulin secretion and resistance. Research Support, U.S. Gov’t, P.H.S. Am J Physiol. Sep 1979;237(3):E214-23.
- Papaioannou TG, Stamatelopoulos KS, Gialafos E, et al. Monitoring of arterial stiffness indices by applanation tonometry and pulse wave analysis: reproducibility at low blood pressures. J Clin Monit Comput. Apr 2004;18(2):137-44. doi:10.1023/b:jocm.0000032809.71793.b8
- Ravikumar R, Deepa R, Shanthirani C, Mohan V. Comparison of carotid intima-media thickness, arterial stiffness, and brachial artery flow mediated dilatation in diabetic and nondiabetic subjects (The Chennai Urban Population Study [CUPS-9]). The American journal of cardiology. Oct 1 2002;90(7):702-7. doi:10.1016/s0002-9149(02)02593-6
- Nadeau KJ, Regensteiner JG, Bauer TA, et al. Insulin resistance in adolescents with type 1 diabetes and its relationship to cardiovascular function. J Clin Endocrinol Metab. Feb 2010;95(2):513-21.
- Nadeau KJ, Zeitler PS, Bauer TA, et al. Insulin resistance in adolescents with type 2 diabetes is associated with impaired exercise capacity. J Clin Endocrinol Metab. Oct 2009;94(10):3687-95.
- Pop-Busui R, Evans GW, Gerstein HC, et al. Effects of cardiac autonomic dysfunction on mortality risk in the Action to Control Cardiovascular Risk in Diabetes (ACCORD) trial. Diabetes care. Jul 2010;33(7):1578-84. doi:10.2337/dc10-0125
- Hadigan C, Rabe J, Meininger G, Aliabadi N, Breu J, Grinspoon S. Inhibition of lipolysis improves insulin sensitivity in protease inhibitor-treated HIV-infected men with fat redistribution. The American journal of clinical nutrition. Feb 2003;77(2):490-4.
- van de Weijer T, Phielix E, Bilet L, et al. Evidence for a direct effect of the NAD+ precursor acipimox on muscle mitochondrial function in humans. Diabetes. Apr 2015;64(4):1193-201. doi:10.2337/db14-0667
- Diaz Ludovico I, Sarkar S, Elliott E, et al. Fatty acid-mediated signaling as a target for developing type 1 diabetes therapies. Expert Opin Ther Targets. Jul-Dec 2023;27(9):793-806. doi:10.1080/14728222.2023.2259099
- Saltiel AR, Olefsky JM. Thiazolidinediones in the treatment of insulin resistance and type II diabetes. Diabetes. Dec 1996;45(12):1661-9. doi:10.2337/diab.45.12.1661
- Dhalla AK, Wong MY, Voshol PJ, Belardinelli L, Reaven GM. A1 adenosine receptor partial agonist lowers plasma FFA and improves insulin resistance induced by high-fat diet in rodents. Am J Physiol Endocrinol Metab. May 2007;292(5):E1358-63. doi:10.1152/ajpendo.00573.2006
- Jain S, Barella LF, Wess J, Reitman ML, Jacobson KA. Adenosine A(1) receptor is dispensable for hepatocyte glucose metabolism and insulin sensitivity. Biochem Pharmacol. Oct 2021;192:114739. doi:10.1016/j.bcp.2021.114739
- Morandi A, Piona C, Bonafini S, et al. Long chain fatty acids metabolism and cardiovascular risk factors in youth with type 1 diabetes. Nutr Metab Cardiovasc Dis. Jan 4 2021;31(1):297-305. doi:10.1016/j.numecd.2020.08.023
- O’Mahoney LL, Churm R, Stavropoulos-Kalinoglou A, et al. Associations Between Erythrocyte Membrane Fatty Acid Compositions and Biomarkers of Vascular Health in Adults With Type 1 Diabetes With and Without Insulin Resistance: A Cross-Sectional Analysis. Can J Diabetes. Mar 2022;46(2):111-117. doi:10.1016/j.jcjd.2021.06.005