

Cancer Mortality and Nuclear Fallout in the USA
Cancer mortality in the USA and atmospheric nuclear weapons test fallout ratio
Christopher Busby1
- Green Audit, Bideford, Devon, UK
OPEN ACCESS
PUBLISHED: 30 November 2024
CITATION: BUSBY, Christopher. Cancer mortality in the USA and atmospheric nuclear weapons test fallout ratio. Identifying the principal origin of the global cancer epidemic. Medical Research Archives, [S.l.], v. 12, n. 11, nov. 2024. Available at: <https://esmed.org/MRA/mra/article/view/5859>. Date accessed: 21 nov. 2025. doi: https://doi.org/10.18103/mra.v12i11.5859.
COPYRIGHT: © 2025 European Society of Medicine. This is an open-access article distributed under the terms of the Creative Commons Attribution License, which permits unrestricted use, distribution, and reproduction in any medium, provided the original author and source are credited.
DOI: https://doi.org/10.18103/mra.v12i11.5859
ISSN 2375-1924
ABSTRACT
Recent advances in epidemiological analysis of the effects of radioactive contamination have raised questions over the security of current radiation risk models. One outstanding question relates to the effects of atmospheric nuclear weapons tests and the fallout which peaked in 1959-63. Effects on cancer, a late genetic disease, are investigated here by employing a metric R which divides the rate in high fallout and low fallout States of the USA. An allocation of the two groups is based on rainfall and supported by measurements of Strontium-90 in baby teeth. Results from comparing cancer mortality in Whites for High fallout States AR/KY/LA/MS and TN with low fallout States AZ/CA/ NM reveals a highly significant fallout cohort effect peaking in those born in 1955-1964 in all 10-year birth cohort age groups. The ratio was calculated for 10-year groups for deaths in 1969, 1979, 1989, 1999, 2009 and 2019. Cancer mortality ratio effects increased with age. In the oldest 10-year group studied, 55-64, in 2019 the Excess Risk for those born in 1955-64 was 52% greater in the high fallout regions ERR =1.52; 95% CI 1.48, 1.57; p <0.00000000. For the 45-54 group in 2019 ERR = 1.42; 95% CI 1.35, 1.50; p < 0.00000000. For the 34-45 ERR = 1.27; 95% CI 1.15, 1.40; p<0.000001. Arguably the results identify the main cause of the cancer epidemic which began in the 1980s.
Keywords: cancer mortality, atmospheric nuclear weapons, fallout, epidemiology
Introduction
It is now generally conceded that cancer is a genetic disease expressed at the cellular level (Chal 2008). It must follow that genetic damage before or near birth can introduce genetic mutations which may either kill the individual or result in an increased risk of cancer throughout life. That ionising radiation causes genetic mutations was discovered by Muller whose work on fruit flies and X-rays resulted in a Nobel prize. Following World War 2, and the development and testing of nuclear weapons, he argued that the fallout contamination exposure effects would be significant (Muller, 1950). He was not alone. Two other Nobel laureates, Linus Pauling (Jolly, 2002) and Andrei Sakharov (Sakharov, 1958) warned about the downstream effects, and a number of geneticists and others also were clearly concerned (Wallace and Dobzhansky, 1959; Sternglass, 1972). Fission-product fallout contaminants increasingly entered the food chain as the radiation released into the upper atmosphere. However, there were political changes, resulting, in 1963 when the USA and Soviet atmospheric testing was stopped. The fallout levels, measured as Strontium-90 and Caesium-137 peaked in the period 1959-1963. These two nuclides have half lives of around 30 years and contamination levels were recorded (Eisenbud and Gesell, 1997; NCRP, 1987). Plutonium and other fallout nuclides were also measured, although interestingly, not all. In particular, the Uranium components of the bombs were not measured, or at least, were not reported.
The period of the major fallout, as measured by Sr-90 in milk and children’s bones and teeth also saw an increase in early infant mortality in the USA and UK as shown in Fig 1. This was explained by Sternglass (1971), Whyte (1992) and Busby (1995) as a result of genetic damage to the foetus. More recently it was discussed in Busby (2017) and Koerberlin (2023). These infant mortality effects occurred in the UK as well as the USA and were greatest in areas of high rainfall (Busby, 1995). Official investigations in the USA as well as in the UK failed to include the fallout radioactivity, and explanations focused on the drug thalidomide, although there were problems with such an approach, since data from Canada seemed to blame the fallout rather than the drug (LeVann, 1963). Further support for the idea that the fallout exposures had genetic effects came from studies of child leukaemia which were carried out over the period of testing and which showed effects of rainfall (Bentham and Haynes, 1995; Archer, 1987).
Strontium is a Calcium Group element and so concentrated in milk. Strontium-90, besides being a bone-seeker, also targets DNA due to its chemical similarity to Calcium, which forms the phosphate backbone of DNA. DNA has long been accepted as the principal target for radiation effects at the genetic, developmental and somatic level. In 1963, during the peak of the Sr-90 precipitation in rain, and its build-up in milk, Luning in Sweden proved the genetic effects of Sr-90 relative to Caesium-137 at the same dose, through experiments with mice, injecting Sr-90 into male mice, mating them to unexposed females and examining effects in the foetus. The result was that the Sr-90 offspring were three times as damaged as the Cs-137 offspring were at the same dose (Luning et al. 1963). Due to the locations of the testing and the magnitude, the major contamination was in the Northern hemisphere (Eisenbud and Gesell, 1997).
Although the current risk models, based on the Japanese A-Bombs do not predict genetic effects from radiation at the low doses calculated for the fallout exposures, more recently, it has been shown that similar very low levels of contamination in Europe from Chernobyl caused measurable increases in birth defects (Schmitz-Feuerhake et al., 2016).
Figure 1
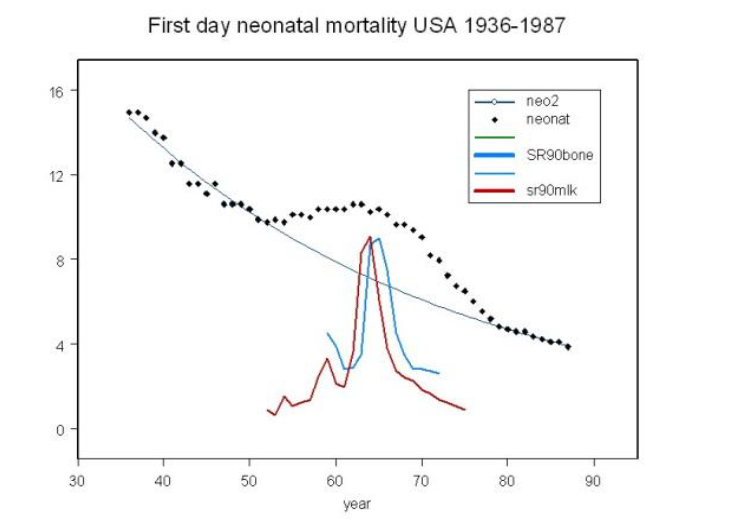
Fallout and early infant mortality (Busby, 1995, 2006, 2017). The trend line shows variation in early (first month) infant mortality in USA 1936–1987. Increased death rate occurred in line with Strontium-90 in fallout as shown by the trend of Sr-90 in children’s bone and in milk as measured in the UK.
It is rarely disputed now, that from the 1980s to the present day, the world has experienced a very significant increase in rates of cancer incidence and mortality which cannot be explained as caused by ageing populations (Busby 2006). Indeed, it has recently been shown to have increased in younger people (Zhao et al., 2023). Cancer has been identified as an environmental disease since the beginning of epidemiological research. As long ago as 1981, Doll and Peto (1981) published an influential book on the issue, in response to a US government question about the cause of, what was then, the start of the increases in rates. The book identified causes of cancer as an environmental disease, based on a number of pieces of evidence. These included the identification of risks of different cancer sites with areas of residence and changes in risk types following immigration (e.g. breast cancer: Japanese in California). Additionally, there were the many studies of specific exposures (scrotal cancer and chimney sweeps) (Busby, 1995).
If it is true that cancer is primarily the consequence of environmental exposures, it follows by simple induction that a sudden increase in cancer rates in a population with a stable rate, points to an earlier exposure to an environmental carcinogenic (and therefore) genetic stress. Questions about genetic links in some cancers raises, in a situation of increased incidence, a similar question of the origin of those genetic links. The possibility that the fallout was the cause of the (then starting) cancer epidemic was raised by the author as early as 1994 (Busby, 1994; Busby 1995) in relation to the sudden increase in breast and other cancers in Wales relative to England some 20 years after the fallout peaks. Wales had greater fallout Strontium-90 than England, and the increase of cancer in Wales amounted to about 30%. This identified an error in the radiation risk model of some 300-fold on the basis of the way in which exposure doses were (and still are) calculated by the current model employed by governments, that of the International Commission on Radiological Protection (ICRP, 2007; ICRP, 1990)
The ICRP model does not deal with internal radionuclide exposures on the basis of their chemical affinity to DNA, but rather employs a simplistic tissue averaging methodology which fails entirely to assess what has been described as radiochemical genotoxicity (ICRP, 1990; ICRP, 2007; Busby, 2013). The last ten years has increasingly seen evidence that the model is both mechanistically and epidemiologically bankrupt. None of the studies on which its cancer coefficients are based are able to distinguish external and internal exposures, yet these coefficients are routinely employed to deny causation in a long list of clear evidence of serious harm ranging from nuclear site child leukemias to Chernobyl associated effects (ICRP, 1990; ICRP, 2007; Busby, 2013; Busby, 2022).
The question is, how could fallout genetic effects on cancer be investigated? The epidemiological approach here is to employ the ratio method developed by several researchers (Busby et al., 2006; Mangano, 2017). If there is a fallout effect on cancer, as suggested by the Wales vs. England breast cancer rates, such an effect should be clear in the ratio of cancer death rates in high fallout regions of the USA to rates in low fallout regions. The prior hypothesis is that the higher fallout exposures will result in higher cancer death rates, and the effect will be greatest in those whose exposures were greatest at and around birth when the fallout was greatest, 1959–1963.
Material and methods
In 2021, cancer data for US States was obtained online from the US Centre of Disease Control (CDC), for individuals born in 1959–63 who are now aged 58–62 and entering the age period when cancer rates increase naturally. The ethnic groups “All”, “White”, “Black” and “Hispanic” are available separately in the CDC data. This study chose to employ “White” for all age groups except the 15–24 age group. Since the cancer mortality in this young group was low, results were obtained from the “All” numbers. “Whites” were employed for the main study because this group is considered to represent a more stable group in terms of migration in the low fallout areas over the period of the study. Over the post-fallout period, from 1960 to the present, census data shows that the Black and Hispanic populations of the Western States employed in the analysis changed considerably relative to the White population and so was considered to be a more representative population in terms of exposures and subsequent causal health issues. The F1 offspring of the fallout period individuals (presumably also carrying the genetic damage) will have been born in the period approximately 1983 to 1987 and in 2021 will be aged 34–37, an age range where early onset cancer can develop (e.g. breast cancer, colon cancer, leukemia, lymphoma).
Using national cancer mortality data, the measure R is defined as High Fallout States cancer mortality rate divided by Low Fallout States cancer mortality rate, expressed per 100,000 of the group for the year. The analysis involves a regression or bar/line chart of birth year in ten-year increments to look for a birth cohort effect. The hypothesis to be tested is that R will vary with cohort year of birth, peaking in the period 1959–63. The fallout contamination period was from 1952 to 1970; measurements on baby teeth and bone showed a build-up of Sr-90 from 1965 to 1975, after which it fell (Eisenbud and Gesell, 1997; NCRP, 1987; Busby and Mangano, 2017; UNSCEAR, 2000; CERRIE, 2004). If this genetic damage resulted in increased cancer risk, then we would expect a peak in the value of this ratio, R over the period 1955–1970. The metric R is defined by:
Rᵧ,ₐ = Hᵧ,ₐ / Lᵧ,ₐ
Where Rᵧ,ₐ is the cancer mortality rate ratio per 100,000 between high and low fallout area groups of the USA for year y.
Hᵧ,ₐ is the cancer mortality rate per 100,000 for the high fallout group in period a.
Lᵧ,ₐ is the cancer mortality rate per 100,000 for the low fallout group in period a.
Although Rᵧ,ₐ is defined as a ratio of ratios (rate divided by rate) it can be seen strictly as a cohort Odds Ratio and statistically tested using a simple 2×2 contingency table and Chi-square analysis to obtain 95% confidence intervals and p-values (Table 1). Given the large populations, it can also, of course, approximate to the Relative Risk RR of dying of cancer in the high fallout areas relative to the combined population.
Table 1. Statistical approach 2×2 contingency table (Fliess, 2002).
N is the number of cancers in year y, P is the relevant population.
| Group | Cancer numbers | Population |
|---|---|---|
| High fallout | Nᵧ,ₐ,H | Pᵧ,ₐ,H |
| Low fallout | Nᵧ,ₐ,L | Pᵧ,ₐ,L |
The high fallout/rainfall States chosen for this study are given in Table 2.
Table 2 High fallout and low fallout States of the USA chosen for this pilot study.
| High Fallout/Rainfall | Low fallout/rainfall |
|---|---|
| Arkansas | Arizona |
| Kentucky | California |
| Louisiana | New Mexico |
| Mississippi | |
| Tennessee |
Results
The results for the Odds Ratio R are given with statistical significance and confidence intervals in Table 3, which presents values for the 10-year age groups by 6 years of death from 1969 to 2019. Table 4 presents the R values expressed as Excess Relative Risks of death in the high fallout relative to the low fallout areas by year of birth, expressed as a percentage excess risk. In Fig 2, the excess risk of death in the high fallout group relative to the low fallout group is expressed as a percentage risk and plotted by central year of birth of the groups.
Table 3 Results for the Odds Ratio R representing fractional excess cancer deaths in the high fallout areas over the low fallout areas (see text) for death years from 1969 to 2019 with 95% confidence intervals (a,b) by age group and year of death from cancer. Asterisks give p-values for <.05, <.01, <.001; For p-values below 0.00000000 the result is given in bold.
* For the group 15–24 only, the “all” cancer deaths group was employed; otherwise the results are for the group “white”.
| Died | 15–24 | 25–34 | 35–44 | 45–54 | 55–64 |
|---|---|---|---|---|---|
| 1969 | 0.97 (0.82, 1.15) | 1.05 (0.9, 1.23) | 1.13** (1.04, 1.23) | 1.04 (0.99, 1.40) | 1.0 (0.96, 1.04) |
| 1979 | 0.92 (0.77, 1.09) | 1.07 (0.93, 1.24) | 1.13** (1.03, 1.24) | 1.04 (1.04, 1.15) | 1.03 (0.99, 1.06) |
| 1989 | 1.34* (1.11, 1.64) | 1.22** (1.06, 1.40) | 1.20 (1.11, 1.30) | 1.16** (1.11, 1.22) | 1.14* (1.10, 1.17) |
| 1999 | 0.97 (0.79, 1.20) | 1.28 (1.09, 1.49) | 1.35* (1.24, 1.46) | 1.24 (1.19, 1.30) | 1.25* (1.21, 1.29) |
| 2009 | 0.99 (0.79, 1.23) | 1.07 (0.9, 1.26) | 1.28* (1.18, 1.40) | 1.50** (1.44, 1.57) | 1.37* (1.33, 1.41) |
| 2019 | 0.91 (0.72, 1.16) | 0.91 (0.76, 1.08) | 1.27* (1.15, 1.40) | 1.42 (1.35, 1.50) | 1.52* (1.48, 1.57) |
Table 4
The R values are expressed as percentage Excess Relative Risks of death in the high fallout relative to the low fallout areas by year of birth. Statistical significance as for Table 3.
| Birth period | 15–24 | 25–34 | 35–44 | 45–54 | 55–64 |
|---|---|---|---|---|---|
| 1905–1914 | 0 | ||||
| 1915–1924 | 4 | 3 | |||
| 1925–1934 | 13 | 10 | 14 | ||
| 1935–1944 | 5 | 13 | 16 | 25 | |
| 1945–1954 | -3 | 7 | 20 | 24 | 37 |
| 1955–1964 | -8 | 22** | 35 | 50 | 52 |
| 1965–1974 | 34* | 28 | 28 | 42 | |
| 1975–1984 | 3 | 7 | 27 | ||
| 1985–1994 | -1 | 9 | |||
| 1995–2004 | -9 |
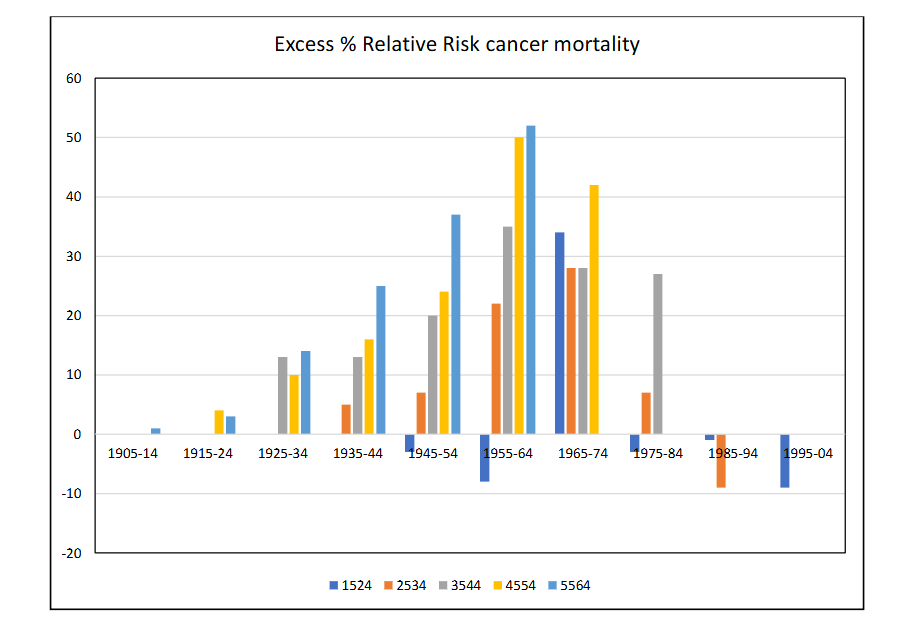
The result for all cancers combined in ethnic group “White” is shown in Fig 2 where R is expressed as a percentage increase of high fallout over low fallout. Thus, zero represents parity. The use of ethnic group “white” employed to remove Hispanic and Black individuals from the study since for California and New Mexico a significant proportion of the population changes in the study period.
Figure 2
Discussion
The issue of the effects on cancer of the test fallout exposures has received little attention in the last 20 years, despite the alarms raised at the time. This may be because the methodology developed to assess risk in terms of absorbed dose, and the calculation of absorbed dose itself resulted from calculations showing that the doses were very low and comparable to those from natural background. The method for assessing cancer risks was the same for nuclear site downwinder exposures, nuclear workers, fallout exposures, and accident exposures like those from Chernobyl and from Fukushima. Internal doses were calculated as energy per unit mass of tissue averaged over whole organs. The risk model of the ICRP made no allowances for dose to the DNA, termed elsewhere “radiochemical genotoxicity” (Busby, 2017). A model was developed in 2003 by the independent European Committee on Radiation Risk (ECRR) and by including hazard enhancement factors to internal radionuclides had been provisionally published by the ECRR (ECRR, 2010).The issue of the cancer effects of the weapon testing was addressed as early as 1962. The approach was to dismiss any hazard on the basis that the doses (calculated as energy per unit mass of tissue and averaged over organs) was not much different form the doses from natural background radiation (Federal Research Council, 1962). This inbuilt error remains today (ICRP, 2007; Busby, 2013; Busby, 2022).The nuclear tests effects were revisited most recently for the USA by Simon and Bouville (2015). They concluded that the main danger (in USA) was from the Iodine-131 and increased risk of thyroid cancer in those exposed to this isotope, which they accurately pointed out will replace stable iodine in the thyroid. The method employed was, as usual, to assume as accurate and secure the predictions of the ICRP risk model and to apply the risk coefficients to the thyroid doses on the basis that the dose calculation itself was a scientific procedure. Accordingly, they predicted a number of cases was modest. No other cancer excess risk was discussed, since the base assumption was that at the fallout doses calculated, no effect would be, or could be found.The basis of the present study was that the current risk model (the one used by Simon and Bouville) is unsafe for predicting cancer effects, and it was necessary to carry out primary epidemiology (induction) rather than make predictions based on deductive reasoning from the effects in the Japanese lifespan study, which is, in any event, unsafe in its epidemiology (Busby, 2013; Busby 2021). The hypothesis is therefore that the contamination of the biosphere from the atmospheric nuclear weapons tests resulted in internal exposures to certain radionuclides which have biochemical affinities for DNA (or other hazards) and that this resulted in genetic damage that could plausibly increase cancer risk. The suggestion, made by the author in 1994 and since (Busby, 1994, 2023) was that this fallout effect was the basis of the increases in cancer incidence and mortality which began in the early 1980s and became highly concerning by 1995. The mortality figures for England and Wales, where this effect was first interpreted (Busby, 1994; Busby, 1995) show that cancer mortality rates in 1950–1960 (Annual Reports of the Registrar General of England and Wales) were around 2000 per million population but are now, more than 6000 in the same population (Office for National Statistics, Series DH2, Mortality by Cause). This is not fundamentally a consequence of ageing populations and despite heroic advances in cancer therapies, as the rates trends in the post fallout period display some very strange effects in different age groups. The increases in the younger age groups are particularly puzzling and require an explanation (Zhao et al., 2023; Busby, 2023).This study looked for birth cohort effects in cancer mortality for deaths in the post fallout period for age groups between 15 and 64, dying between 1969 and 2019. This identified birth cohorts from 1905–1914 up to 1995–2004 in ten-year intervals. The study compared high fallout with low fallout populations in the USA. Cancer increases exponentially with age, and so the numbers are much smaller in the younger age groups. Yet except for the youngest age group15–24, all of the age groups showed significant excess cancer death rates in those born during the peak fallout period, 1955–64. The births in this period (Fig 1) clearly showed an excess of early infant mortality, which is an indicator of congenital effects. In the two highest cancer mortality age groups 1945–1964 the birth cohort excess relative risk (ERR) was about 50%. These figures are highly statistically significant (see Table 3) in all age groups studied. A most interesting result is that for the youngest age group, 15–24, the effect is seen in those born in the immediate post-fallout period, 1965–74. It is this birth cohort, dying in the 15–24 age group, from childhood cancers, leukaemia and lymphoma, which support the radiation exposure origin of the effect. These two haematopoietic cancers are radiation related and have short exposure expression time lags (UNSCEAR, 2000 Vol 2).There is no doubt that these results identify a real effect on cancer. If these effects were caused by the internal exposures, they support the earlier excess risk of cancer found in the population of Wales versus that of England, reported in 1994 (Busby, 1994; Busby, 2006; Busby, 2022) where a 30% increase in all-cancer rate followed a increased exposure dose, assessed from the Strontium-90 dose, of about 1mSv. In this US study of the two groups, the differences in Sr-90 exposures can be seen from measurements made of Sr-90 in milk measured in major cities in the regions (Eisenbud and Gesell, 1997; NCRP, 1987; Rosenthal et al., 1964; Rosenthal et al., 1972). These are given in Table 5.
Table 5 Sr-90 levels Bq/litre of milk in major cities in the USA fallout groups 1960–73
| High fallout | Bq/l milk | Low fallout | Bq/l milk |
|---|---|---|---|
| Memphis TN | 0.45 | Phoenix AZ | 0.17 |
| Little Rock AR | 0.8 | Sacramento CA | 0.13 |
| Louisville KY | 0.34 | San Francisco CA | 0.14 |
| New Orleans LA | 0.86 | Albuquerque NM | 0.16 |
| Jackson MS | 0.7 | ||
| All group mean | 0.69 | All group mean | 0.128 |
It is clear that for Sr-90 in milk, the indication is that the exposures of the high fallout group are about 5-times that of the low fallout group. This is about twice the relative exposures which occurred in England versus Wales, unsurprisingly since the rainfall differences are far greater. The Sr-90 built up in childrens’ bones and was measured. Table 6 gives values over the peak fallout years for New York and San Francisco (NCRP, 1987; Mangano et al., 2023). It is possible to take values for Sr-90 in milk in New York, San Francisco and the high fallout group to estimate the values for the fallout groups for Sr-90 in bone. These results are given in Table 6. Again, it is clear that at the peak of the Sr-90 contamination, the Sr-90 exposure in the high group was about 4-times that in the low group.There is a question which remains. Strontium-90 and Caesium-137 were chosen at the time as the fallout nuclides that carried the greatest risk in the medium term. The cancer risk was mainly estimated from risk models which based cancer risk on absorbed dose. This was highest in the case of Sr-90 owing to its affinity for bone. Therefore, assessments of cancer risk have been mostly made on the basis of the cumulative dose from this nuclide, and the cancer that has been focused on is bone cancer. The affinity of Sr-90 for DNA has largely been ignored, even though the issue was raised as early as 1963 and genetic effects were demonstrated in mice by Luning et al (1963). The cumulative dose to the two groups can be calculated using the conventional model from the conversion factors given by NCRP94 Table B4 (NCRP, 1987). For the period 1961–1965 the cumulative dose to the bone surfaces and bone marrow were 0.45 and 0.9mSv (1.35mSv) in the high exposure region and 0.12 and 0.24 (0.36mSv) in the low.in the low exposure region. The excess cumulative dose in the high region vs the low region is thus about 1mSv. This compares with calculations made on the England and Wales exposures over the same period of about 0.6mSv (CERRIE, 2004; Darby et al., 1992). Where this is associated with an excess relative risk in the USA of 50% we may compare this with the predictions of the current risk model which gives an ERR of 50% per Sv. The error identified is thus about 1000-fold.It is not at all clear, however, that Sr-90 is the principal cause of these effects. It is a flag for exposure. Questions have been raised about the risk coefficients of other fallout components. The main plausible hazardous components of fallout are Tritium, Carbon-14, Caesium-137, Plutonium and mainly the Uranium particles from the 90% un-fissioned weapons (Busby, 2021; Busby, 2016). Muller, Pauling and Sakharov were all concerned about C-14 as the significant genetic hazard. Uranium-234, in particular has been entirely ignored as a cause of cancer, and the exposures to U-234 and U-235 in the Hiroshima Black Rain have not been factored into the epidemiology at the base of the current model (Busby, 2016). The Uraniums have strong chemical affinity for DNA and owing to their high atomic number are photoelectron conversion sources for natural background gamma rays. The model itself has been criticised in the way it calculated doses from internal radionuclides and its failures have been discussed elsewhere (Busby 2013, 2022).
Table 6 Sr-90 Bq per Kg Calcium measured in 0–4 year-olds’ bone over the peak exposure years.Data from NCRP 94 (1992)
| Year | New York | High fallout Groupᵃ | Low fallout Groupᵇ | High fallout group |
|---|---|---|---|---|
| 1961 | 96 | 133 | 30 | 4.4 |
| 1962 | 110 | 153 | 37 | 4.1 |
| 1963 | 190 | 264 | 63 | 4.2 |
| 1964 | 220 | 306 | 84 | 3.6 |
| 1965 | 190 | 264 | 87 | 3.0 |
| 1966 | 160 | 222 | 71 | 3.1 |
| 1967 | 130 | 181 | 44 | 4.1 |
| 1968 | 130 | 181 | 30 | 6.0 |
| 1969 | 100 | 139 | 47 | 3.0 |
| 1970 | 92 | 128 | 34 | 3.8 |
ᵇ based on San Francisco values
Conclusions
The genetic damage introduced into the US population around birth over the nuclear weapons test contamination was seen in increases in early infant mortality in the period 1955–65, peaking in 1965. It was associated with peaks in Strontium-90 in milk and in bone in 0–4 year-olds measured over the period. The fallout exposure from this source was between 4 to 5 times in the chosen group of high fallout States (AR, KY, AR, MS, TY) relative to low fallout States (NM, CA, AZ) of the USA. Comparing cancer death rates in these two groups by birth cohort period, using deaths from 1969–2019 in ten-year intervals, identified a highly significant effect which showed a peak in the cancer death ratio for those born in the peak fallout period of 1955–65. For the oldest age groups those aged 45–64 at death the effect showed a highly significant 50% Excess Relative Risk. This supports the belief that the current radiation cancer risk model is unsafe, and identifies an error in the current radiation risk model for internal fallout exposures, modelled as Sr-90 of about 1000-fold.
Strengths and Weaknesses
The effect seen is unmistakeable and owing to the large populations and cancer numbers the results are very highly significant. The explanation is plausible if the current risk model is put to one side. There are several weaknesses in the study. The first is that it cannot deal with population movements between high and low fallout areas. The assumption is that such effects may exist but are second order with respect to the effects found. The study is an ecological one—so the measurements of Sr-90 in the various States are taken to be the cause or related to the cause of the increases in general internal radiation exposure and to define a putative risk. It is possible that some confounding cause of the infant mortality, or some other unknown, may distinguish the high rainfall and low rainfall areas. There are clearly socio-economic and disadvantagement differences between the groups, though for these to be involved as causes they would have to define the birth cohort risk.Conflict of Interest
The author reports no conflict of interest apart from being the scientific secretary of the independent European Committee on Radiation Risk which has developed a risk model which accommodates hazards from internal exposures that can explain the findings here.
Acknowledgements
I am grateful to J Mangano for introducing me in 2021 to the issue of employing fallout period baby teeth data in the USA to investigate a possible link with cancer risk.
References
1. Chal H (2008) Genetic regulation of cancer Nature Education, 1, No 1, p 67
https://www.nature.com/scitable/topicpage/genetic-regulation-of-cancer-891/
2. Muller HJ. (1950) Radiation damage to the genetic material. AmSci., 38, pp 32-39 and 38, pp. 399-425.
3. Jolly J.C (2002) Linus Pauling and the Scientific debate about fallout hazards. Endeavour vol 26, no.4, pp. 149-153
4. Sakharov A. (1958) Radioactive Carbon from Nuclear Explosion and Non-threshold Biological Effects, Soviet Journal Atomic Energy, vol.4, pp. 757–62. Following Sakharov’s death in 1989, the U.S. Government translation was reprinted in Science and Global Security (1990) vol.1, pp. 175–87. https://scienceandglobalsecurity.org/archive/1990/01/radioactive_carbon_from_nuclea_1.html
5. Wallace B, Dobzhansky T. (1959) Radiation, Genes and Man. New York: Holt
6. Sternglass, E.J (1971) Environmental Radiation and Human Health, in Proceedings of the Sixth Berkeley Symposium on Mathematical Statistics and Probability, ed. J.Neyman Berkeley, Calif.: University Press
7. Eisenbud M and Gesell T (1997) Environmental Radioactivity San Diego: Academic Press
8. NCRP (1987) Exposure of the population of the United States and Canada from natural background radiation. NRCP Report 94, Bethesda MD: NCRP
9. Whyte, R.K (1992) `First Day Neonatal Mortality since 1935: A Re-examination of the Cross Hypothesis’, British Medical Journal, vol. 304, pp. 343-6.
10. Busby, C. C. (1995), Wings of Death: Nuclear Pollution and Human Health Aberystwyth: Green Audit
11. Busby C (2017) Radiochemical Genotoxicity Risk and Absorbed Dose. Res Rep Toxi. Vol.1 No.1:1 https://www.imedpub.com/articles/radiochemical-genotoxicity-risk-and-absorbed-dose.php?aid=20305
12. Koerblein A (2023) Statistical modelling of trends in infant mortality after atmospheric nuclear weapons testing. PloS, vol. 1 18 (5) e0284482
13. leVann LJ (1963) Congenital abnormalities in children born in Alberta in 1961: a survey and a hypothesis. Can. Med. Assoc. J, vo. 89, pp. 120-126
14. Bentham G and R. Haynes, (1995) ‘Childhood leukemia in Great Britain and fallout from nuclear weapons testing.’ Journal of Radiological Protection, vol. 15/1, pp. 37-43.
15. Archer, V. E. (1987), `Association of Nuclear Fallout with Leukemia in the United States’, Archives of Environmental Health, vol.42, pp. 263-71.
16. Luning, K. G., Frolen, H., Nelson, A., and Ronnback, C. (1963), `Genetic Effects of Strontium-90 Injected into Male Mice’, Nature, No 4864 197: 304-5.
17. Schmitz-Feuerhake, Busby C, Pflugbeil P (2016) Genetic Radiation Risks-A Neglected Topic in the Low Dose Debate. Environmental Health and Toxicology. 31 Article ID e2016001. http://dx.doi.org/10.5620/eht.e2016001.
18. Busby C (2006) Wolves of Water: A study constructed from atomic radiation, morality, epidemiology, bias, philosophy and death. Aberystwyth: Green Audit
19. Zhao Jianhui, Xu Liyang, Sun Jing et al (2023) Global trends inincidence, death, burden and risk factors of early onset cancer from 1990 to 2019. BMJ Oncology, vol. 2; e000049
20. Doll, R. and Peto, R. (1981), The Causes of Cancer, Oxford: University Press
21. Busby, C. (1994), `Increase in Cancer in Wales Unexplained’, British Medical Journal, vol. 308: 268
22. ICRP (2007) International Commission on Radiological Protection. The 2007 Recommendations of the International Commission on Radiological Protection. ICRP-Publication 103 Oxford: Pergamon
23. ICRP 60. (1990) International Commission on Radiological Protection 1990 Recommendations of the International Commission on Radiological Protection. ICRP Publication 60. ICRP 21 (1-3), 1991.
24. Busby Christopher (2013). Aspects of DNA Damage from Internal Radionuclides, New Research Directions in DNA Repair, Prof. Clark Chen (Ed.), ISBN: 978-953-51-1114-6, InTech, DOI: 10.5772/53942. Available from:
http://www.intechopen.com/books/new-research-directions-in-dna-repair/aspects-of-dna-damage-from-internal-radionuclides
25. Busby Christopher (2022) Ionizing radiation and cancer—the failure of the risk model. Cancer Treatment and Research Communications (invited review). Vol 31, 100565. DOI https://doi.org/10.1016/j.ctarc.2022.100565
26. Busby Christopher and Mangano Joseph J (2017) There’s a world going on underground—infant mortality and fracking in Pennsylvania. Journal of Environmental Protection, vol8 no 4, doi: 10.4236/jep.2017.84028
27. UNSCEAR 2000 (2000) Sources and Effects of Atomic Radiation. Vol 1: Sources. New York: United Nations.
28. CERRIE (2004) Report of the Committee Examining Radiation Risk from Internal Emitters (CERRIE) Chilton, UK: National Radiological Protection Board
29. Fliess J R (2002) Statistical methods for rates and proportions. New Jersey: Wiley Interscience
30. ECRR (2010) Busby C, Yablolov AV, Schmitz Feuerhake I, Bertell R and Scott Cato M. The 2010 Recommendations of the European Committee on Radiation Risk. The Health Effects of Ionizing Radiation at Low Doses and Low Dose Rates. Brussels: ECRR; Aberystwyth Green Audit
31. Federal Research Council (1962) Health implications of fallout from nuclear weapons testing through 1961. Report No 3. Washington USA: Government Printing Office
32. Simon SL and Bouville A (2015) Health effects of nuclear weapons testing. The Lancet, vol. 386, pp. 407-409.
33. Busby Christopher (2021) The Hiroshima A-Bomb Black Rain and the Lifespan Study; a Resolution of the Enigma, Cancer Investigation, DOI: 10.1080/07357907.2021.1977818
34. Busby C (2023) Evidence that nuclear atmospheric test fallout is responsible. Response to: Zhao Jianhui, Xu Liyang, Sun Jing et al (2023) Global trends inincidence, death, burden and risk factors of early onset cancer from 1990 to 2019. BMJ Oncology, 2; e000049
https://bmjoncology.bmj.com/content/evidence-nuclear-atmospheric-test-fallout-responsible
35. Annual Reports (Medical) of the Registrar General for England and Wales. London: HMSO
36. Office for National Statistics. Ser. DH2. Mortality Statistics Cause. Review of the Registrar General on Deaths by Cause, Sex and Age (annually). London: ONS
37. UNSCEAR 2000 (2000) Sources and Effects of Atomic Radiation. Vol 2: Effects. New York: United Nations.
38. Rosenthal HL, Le Cam LM, Neyman J and Scott EL (1972) Implication of environmental Sr90 accumulation in teeth and bone of children. in Proceedings of the Sixth Berkeley Symposium on Mathematical Statistics and Probability, ed. J.Neyman (Berkeley, Calif.: University Press)
39. Rosenthal HL, Austin S, O Niell S. (1964) Incorporation of fallout Strontium90 in deciduous incisors and foetal bones. Nature, vol. 4945, pp. 615-616
40. Mangano J, Gaus KS, Mousseau TA, Ketterer M (2023) Strontium-90 in baby teeth as a basis for estimating US cancer deaths from nuclear weapons fallout. International Journal of Social Determinants of Health and Health Services. 1-11.
41. Darby, S. C., Olsen, J. H., Doll, R., Thakrar, B., de Nully Brown, P., Storm, H. H., Barlow, L., Langmark, F., Teppo, L., and Tulinius, H. (1992), `Trends in Childhood Leukemia in the Nordic Countries in Relation to Fallout from Nuclear Weapons Testing’, British Medical Journal, vol. 304, pp. 1005-9.
42. Busby Christopher. (2016) Letter to the Editor on “The Hiroshima Nagasaki survivor studies. Discrepancies between results and general perception.” By Bernard R Jordan. Genetics. Vol. 204, no.4, pp. 1627-1629