

Effects of High-Protein Diet on Exercise and Insulin
The Insulin-Sparing Effects of Exercise are Attenuated by a High-Protein Diet While Maintaining the Effects of Exercise on Glucose and Lipid Metabolism
Tetsuo YamadTetsuo Yamada 1, Masaki Okada 2, Masami Matsuzaki 1,4, Akira Tanaka 3, 5a 1, Masaki Okada 2, Masami Matsuzaki 1,4, Akira Tanaka 3, 5
- Department of Nutrition and Dietetics, Kanto Gakuin University, Yokohama, Japan
- Department of Health and Nutrition Sciences, Komazawa Women’s University, Inagi, Japan
- Sagamu Nutrition University, Sagado, Japan
Current address
- Department of Nutritional Management, Hana Professional Training of College, Tokyo, Japan
- Kichijoji Futaba Professional and Vocational College of Culinary Nutrition, Tokyo, Japan
OPEN ACCESS
PUBLISHED: 31 October 2025
CITATION: Yamada, T., Okada, M., et al., 2025. The Insulin-Sparing Effects of Exercise are Attenuated by a High-Protein Diet While
Maintaining the Effects of Exercise on Glucose and Lipid Metabolism. Medical Research Archives, [online] 13(10). https://doi.org/10.18103/mra.v13i10.6922
COPYRIGHT: © 2025 European Society of Medicine. This is an open-access article distributed under the
terms of the Creative Commons Attribution License, which permits unrestricted use, distribution, and reproduction in any medium, provided the original author and source are credited.
DOI https://doi.org/10.18103/mra.v13i10.6922
ISSN 2375-1924
Abstract
Background: Metabolic syndrome and sarcopenia are physical conditions that are addressed differently through nutrition and exercise. Proteins, particularly branched-chain amino acids (BCAAs), exert insulinotropic effects, whereas exercise reduces insulin secretion. It is thus necessary to understand the effects of protein intake and exercise alone and in combination when considering suitable dietary and exercise therapies for treating metabolic syndrome and sarcopenia.
Methods: Seven healthy young-adult male volunteers participated in a crossover trial consisting of two 6-day experiments. Days 1-3 comprised a body-weight-maintained adjustment period during which the participants consumed a control diet (energy, 2,500 kcal; protein, 61.3 g for an individual weighing 60 kg). Days 4-6 comprised the treatment period during which the participants expended 402 kcal of additional energy by riding a bicycle with an ergometer and consumed an additional 402 kcal, either as BCAA-rich fat-free milk (high-protein diet + Exercise (HP + Ex) period) in one experiment or carbohydrates and lipids only (non–high-protein diet + Exercise (non–HP + Ex) period) in another experiment. Total 24-h urine samples were collected daily throughout the study. Fasting blood samples were collected early in the morning before and after the treatment period.
Results: Plasma valine, BCAA, and serum urea nitrogen levels were significantly elevated only after the HP + Ex period. Serum insulin-like growth factor 1 (IGF-1) levels were significantly decreased after both the non–HP + Ex and HP + Ex periods, but there was no difference in the degree of change (Δ) in serum IGF-1 level (Δ serum IGF-1) (amount of decrease in IGF-1) between the two periods. Urinary C-peptide immunoreactivity excretion levels decreased significantly during the non–HP + Ex period but were unchanged during the HP + Ex period. Serum triglyceride and remnant lipoprotein-cholesterol levels were significantly lower after both the non–HP + Ex and HP + Ex periods but did not differ between the two periods. Furthermore, there were no significant differences between the two periods in Δ serum triglyceride and Δ serum remnant lipoprotein-cholesterol (amount of decrease). Urinary noradrenaline and dopamine excretion levels were significantly higher during the HP + Ex period than during the non–HP + Ex period, and the Δ urinary noradrenaline and Δ urinary dopamine (amount of increase) were also significantly greater during the HP + Ex period than during the non–HP + Ex period.
Conclusions: A high-protein diet during exercise attenuates the insulin-sparing effects but does not affect the effects on glucose and lipid metabolism, although its effects on body protein synthesis are unclear. The combination of a high-protein diet and exercise is suggested to be an effective regimen for sarcopenic obesity.
Keywords
metabolic syndrome, sarcopenia, high-protein diet, exercise, insulin, glucose metabolism, lipid metabolism
1. Introduction
Metabolic syndrome and sarcopenia are serious medical conditions of urgent public health concern, as their worldwide prevalence has increased with expansion of lifestyle-related diseases and aging population. As the approaches for treating metabolic syndrome and sarcopenia differ, addressing sarcopenic obesity is challenging. Both nutrition and exercise are important factors that must be considered in addressing metabolic syndrome and sarcopenia. To address metabolic syndrome, it is necessary to restrict energy intake and reduce body weight while ensuring adequate nutrient intake. Obesity, hypertension, and impaired glucose and lipid metabolism can be alleviated through aerobic exercise, which directly promotes the expenditure of glucose and free fatty acids. In addressing sarcopenia, by contrast, it is necessary to ensure adequate energy intake and supplement if necessary, in addition to ensuring an adequate supply of nutrients, such as protein and vitamin D. Regarding exercise to prevent or improve sarcopenia, resistance exercises, which involve a relatively large mechanical load, are effective for increasing muscle mass and strength and indirectly promote glucose and lipid metabolism.
Insulin lowers the blood glucose (BG) level and stimulates protein anabolism. From the viewpoint of metabolic syndrome, it is desirable to avoid excessive insulin secretion. Proteins, particularly branched-chain amino acids (BCAAs), are utilized for energy, body protein maintenance and anabolism; however, they also exert insulinotropic effects. Exercise also promotes body protein synthesis while reducing insulin secretion. Thus, although both BCAA intake and exercise affect body protein anabolism, they exert opposite effects on insulin secretion. When considering dietary and exercise therapies for treating metabolic syndrome and sarcopenia, therefore, it is necessary to investigate the effects of protein intake and exercise alone and in combination. In addition, it is important to consider the effects of increased insulin secretion by protein intake on glucose and lipid metabolism.
We previously focused our research on body weight loss as it relates to glucose and lipid metabolism, nutrient balance, and indicators related to muscle mass. That is, reducing body weight via exercise had more beneficial effects on lipid metabolism than a dietary approach. The improvement in insulin resistance was accompanied by decreases in serum triglyceride (TG), remnant lipoprotein-cholesterol (RLP-C), and apolipoprotein B48 levels. In addition, nitrogen, sodium, and potassium balance in our study was significantly more positive during the exercise regimen than during the diet regimen. Urinary excretion levels of creatinine, 3-methylhistidine (3-MH), aldosterone, catecholamines, and the 3-MH/creatinine ratio were significantly increased only during the exercise regimen. In another previous study, we examined the effects of consuming BCAA-rich fat-free milk in combination with exercise or without exercise on protein-related parameters, including plasma BCAA level, muscle protein synthesis– and breakdown–related parameters, and glucose and lipid metabolism–related parameters, including serum insulin level, urinary C-peptide immunoreactivity (CPR) excretion level, homeostatic model assessment for insulin resistance (HOMA-IR), and atherosclerosis index (AI). Plasma BCAA levels were significantly elevated after both the non-exercise and exercise periods, whereas serum insulin levels were significantly elevated only after the non-exercise period. Urinary CPR excretion levels increased significantly during the non-exercise period but showed no significant changes during the exercise period. Serum TG and RLP-C levels were significantly reduced after the exercise period. Thus, exercise attenuated the insulinotropic effects of protein intake and exerted beneficial effects on glucose and lipid metabolism. However, serum insulin-like growth factor 1 (IGF-1) levels remained unchanged after the non-exercise period but were lower after the exercise period.
Based on these previous results, in the present study, we examined the effect of exercise in combination with BCAA-rich fat-free milk consumption and without consumption, under the hypothesis that serum insulin and urinary CPR excretion levels would increase during exercise in subjects consuming fat-free milk compared with those not consuming fat-free milk. We also examined potential differences in muscle protein synthesis– and breakdown–related parameters as well as glucose and lipid metabolism–related parameters between with/without consumption of BCAA-rich fat-free milk.
2. Materials and Methods
2.1 SUBJECTS
Seven healthy young-adult male volunteers (age, 20 ± 1 years [mean ± standard deviation]; body height, 175 ± 7 cm; body weight, 64.7 ± 8.2 kg) participated in the metabolic experiment. A subject briefing session was held prior to the experiment in order to explain the methods of the study, including the 12-day restriction of usual life activities, dietary control, exercise load, and blood and urine sample collections. Individuals with allergies to fat-free milk were excluded. Consequently, seven subjects were enrolled, which was the small number needed for the statistical analyses. G*Power 3.1 software was used for power analyses, and the power for detecting differences was calculated using the alpha level (0.05), sample size, and effect size (calculated from the means, standard deviations, and Spearman’s correlation coefficients between pairs of variables). In our previous study with a sample size of 6, the power for detecting differences in serum TG level after exercise was 85%. In another previous study with a sample size of 8, the power for detecting post-exercise differences in serum TG and RLP-C levels was 98% and >99%, respectively. Furthermore, the power was >99% for detecting differences in urinary CPR excretion with and without exercise. All subjects provided written informed consent to participate in all procedures associated with the study, which adhered to the tenets of the Declaration of Helsinki.
2.2 EXPERIMENTAL PROCEDURES
The Research Ethics Committee of Kanto Gakuin University approved the study protocols (approval number: 2016-1-1).
2.2.1 Experimental protocol
The study comprised two 6-day experiments (12 days in total; Fig. 1). All 7 subjects participated in both experiments. Each experiment consisted of a 3-day treatment period preceded by a 3-day body-weight-maintained adjustment period (6 days in total). During the adjustment period, the participants consumed control diets. During the treatment period, the participants exercised, and the additional energy provided to the control diet during the adjustment period was consumed as either BCAA-rich fat-free milk (high protein diet) in one experiment or as carbohydrates and lipids only (non–high protein diet) in the other experiment. After the end of the first 6-day experiment, a washout period of >7 days was initiated, during which the subjects consumed an ad libitum diet before the second 6-day experiment started. The two experiments were performed as a crossover trial, (i.e., high-protein diet with exercise [HP + Ex] was followed by non–high protein diet with exercise [non–HP + Ex]) for three participants, and the order was reversed for the remaining four participants.
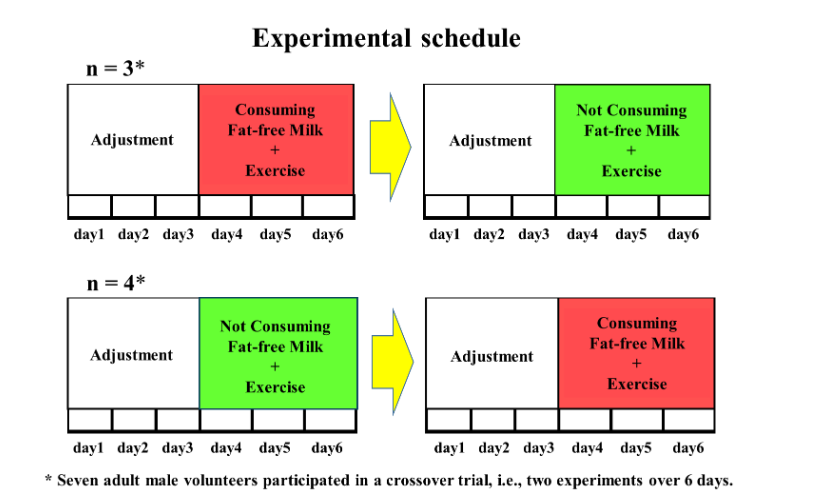
For each experiment, the subjects gathered at the university in the evening of the day before the start of the experiment. The experiment started at 06:30 on the first day. Throughout the experiment, the subjects remained in the laboratory during the day and in the metabolic experiment building at night. During the adjustment period from day 1 to day 3, the subjects woke up at 06:30, collected the final urine sample for the previous day at 07:00, then began collecting all urine for the next 24 h from that point. Body weight and body composition were measured using an InBody 720 body composition analyzer (InBody Japan Inc., Tokyo, Japan). Breakfast was served between 08:30 and 09:00, lunch was served between 12:30 and 13:00, and dinner was served between 18:00 and 18:30. Other than taking a shower between 19:30 and 21:30, and going to bed at 22:00, they were free to spend their time in the laboratory and metabolic experiment building, with the exception of eating or engaging in additional physical activity.
The treatment (non–HP + Ex and HP + Ex) periods lasted from day 4 to day 6. During both periods, the daily schedule remained unchanged from that of the adjustment period, except for the addition of an exercise load that was performed from 10:15 in the morning and from 15:00 in the afternoon. In addition to the diet during the adjustment period, the amount of additional energy expended during exercise was added. Throughout the experiment, the room was maintained at a dry bulb temperature of 25-26°C and wet bulb temperature of 22-23°C.
2.2.2 Experimental diet
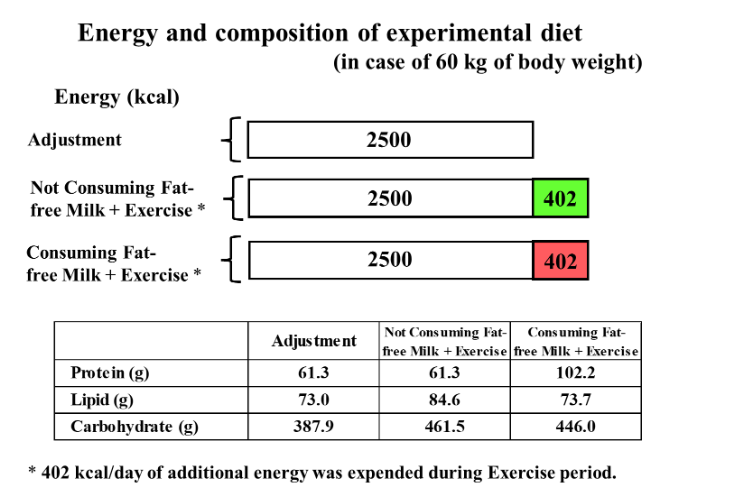
The experimental diet during the adjustment period, i.e., the control diet consisted of the following basically homogeneous foods: crackers, margarine, strawberry jam, mashed potatoes, salt and pepper, vegetable juice, biscuits, spaghetti, meat sauce, vegetable oil, vitamin mixture beverages, milled rice, soy protein processed food, tomato ketchup, miso, Komachi-fu (a gluten product), and seaweed tsukudani. During the body-weight-maintained adjustment period, the experimental diet was set to meet the recommended dietary allowance or adequate intake as specified in the Dietary Reference Intakes for Japanese. The amount of food consumed each day was adjusted according to the body weight of each participant. The calculated values per day for an individual weighing 60 kg based on the Standard Tables of Food Composition in Japan were as follows: energy, 2,500 kcal; protein, 61.3 g; lipid, 73.0 g; carbohydrate, 387.9 g. The BCAA content was 6.4 g (isoleucine, 1.5 g; leucine, 3.0 g; and valine, 1.9 g). Actual energy intake during the adjustment period was 2643 ± 224 kcal/day. The additional energy provided to the control diet was consumed during the treatment periods. The amount of additional energy was adjusted according to the energy intake level per day during the adjustment period. During the HP + Ex period for an individual weighing 60 kg, 402 kcal of fat-free milk was consumed divided into each of three meals per day, the volume of which was determined by calculating the equivalent amount of energy (134 kcal) in 200 ml of whole milk per meal, which was considered to be a normal amount of milk consumed in daily life. Thus, the intake levels during the HP + Ex period were as follows: energy, 2,902 kcal; protein, 102.2 g; lipid, 73.7 g; carbohydrate, 446.0 g; BCAAs, 14.5 g (isoleucine, 3.5 g; leucine, 6.7 g; and valine, 4.3 g). During the non–HP + Ex period, additional energy was consumed as carbohydrates and lipids only, so that the fat energy ratio remained the same as during the adjustment period, which were supplied through cornstarch, white superior soft sugar, shortening and carbonated drink. Therefore, the intake levels during the non–HP + Ex period for an individual weighing 60 kg were as follows: energy, 2,902 kcal; protein, 61.3 g; lipid, 84.6 g; carbohydrate, 461.5 g. Actual additional energy intake during both the non–HP + Ex and HP + Ex periods was 425 ± 36 kcal/day.
2.2.3 Exercise procedures
Before the start of the study, an exercise tolerance test was performed, which involved gradually increasing the work rates on a bicycle with an ergometer. Heart rate was recorded via telemetry (DS-3400; Fukuda Denshi Co., Ltd., Tokyo, Japan). Samples of expired gas were collected before and at steady state during exercise using a Douglas bag, and gas volume was measured using a dry gas meter (DC-5A; Shinagawa Corp., Tokyo, Japan). Expired oxygen and carbon dioxide concentrations were measured using an expired gas monitor (Portable Gas Monitor AR-1; Arco System Inc., Kashiwa, Japan). The relationships among additional energy expenditure parameters were calculated based on oxygen intake and the respiratory exchange ratio, work rate (kilopounds [kp] of the bicycle ergometer), and heart rate for each subject. During the treatment periods, half of the additional energy was expended at a moderate intensity in the morning, and the other half was expended during exercise at a vigorous intensity in the afternoon. Moderate-intensity exercise was performed at about 50% of the maximal oxygen intake, and vigorous-intensity exercise was performed by increasing the kp level 1.6 to 2 times greater than that used for moderate-intensity exercise. Exercise duration was 47.3 ± 5.0 min in the morning and 25.9 ± 4.3 min in the afternoon.
2.3 SAMPLE COLLECTION AND MEASUREMENTS
Fasting blood samples were collected early in the morning before the first day of each treatment period (the 3rd day of each 6-day experiment) and at the end of each treatment period (the morning after day 6 of each 6-day experiment). Total urine samples were collected on a 24-h basis (07:00 to 07:00 the next day) daily throughout each experiment.
Blood and urine samples were sent to the following laboratories: BML Inc. (Tokyo, Japan) for measurements of BG, serum urea nitrogen (UN), creatine kinase (CK), immunoreactive insulin (IRI), TG, total cholesterol (TC), low-density lipoprotein–cholesterol (LDL-C), and high-density lipoprotein–cholesterol (HDL-C) levels; SRL Inc. (Tokyo, Japan) for determination of levels of plasma amino acids (valine, leucine, isoleucine, and lysine), serum IGF-1, free-testosterone, cortisol, RLP-C, urinary CPR, 3-MH, and cortisol; LSI Medience Corp. (Tokyo, Japan) for measurements of the levels of urinary creatinine, UN, and three types of catecholamines (adrenaline, noradrenaline, and dopamine); and Material Research Center Co., Ltd. (Tokyo, Japan) for measurement of serum myostatin levels. HOMA-IR was calculated according to the formula (fasting blood glucose [mg/dl]× fasting insulin [µU/ml]/405). AI was calculated according to the formula ([TC – HDL-C]/ HDL-C).
2.4. STATISTICAL ANALYSES
Results are expressed as the median (range), as there was no guarantee that the data were normally distributed. All statistical analyses were performed using IBM SPSS Statistics 27 software (IBM Corp., Armonk, NY, USA). The Wilcoxon signed-rank test or Friedman’s test was applied to evaluate differences in measures of central tendency, and the relationships between pairs of variables were evaluated using the Spearman’s correlation coefficient. Significance was established at p<0.05 in all analyses.
3. Results
3.1. BODY WEIGHT AND COMPOSITION
The changes in the body weight and composition are shown in Table 1. Although body weight increased slightly during the non–HP + Ex period, body fat percentage, body fat mass, and skeletal muscle mass remained almost unchanged during both the non–HP + Ex and HP + Ex periods.
| Day | Body weight (kg) | Skeletal muscle mass (kg) | Body fat percentage (%) | Body fat mass (kg) |
|---|---|---|---|---|
| 1 | 64.3 (53.0 to 78.9) | 12.1 (8.9 to 27.3) | 7.9 (4.7 to 21.5) | 8.0 (5.2 to 22.7) |
| 2 | 64.6 (52.7 to 79.0) | 12.3 (9.2 to 27.5) | 8.4 (4.8 to 21.7) | 8.2 (5.5 to 22.2) |
| 3 | 64.1 (52.6 to 78.3) | 12.0 (10.1 to 28.7) | 8.4 (5.3 to 22.4) | 8.4 (5.6 to 22.8) |
| 4 | 64.4 (52.4 to 78.2) | 12.0 (10.3 to 28.2) | 8.3 (5.4 to 22.1) | 8.1 (5.5 to 22.0) |
| 5 | 64.5 (52.4 to 78.2) | 12.2 (9.7 to 28.2) | 8.5 (5.1 to 22.1) | 8.5 (5.6 to 22.4) |
| 6 | 64.5 (52.5 to 78.6) | 11.4 (10.5 to 28.2) | 7.8 (5.5 to 22.2) | 7.6 (5.5 to 22.6) |
| After | 64.7 (52.5 to 79.2) | 12.0 (10.2 to 27.6) | 8.3 (5.7 to 21.9) | 7.6 (5.5 to 22.6) |
n = 7. Variables are given as the medians (minimum value to maximum value).
3.2. BLOOD METABOLIC PARAMETERS
The changes in blood levels of protein-related parameters (UN, BCAAs, and lysine), muscle synthesis– and breakdown–related parameters (IGF-1, free-testosterone, myostatin, CK, and cortisol), and glucose and lipid metabolism–related parameters are shown in Table 2.
| Before | After | Δ1 | Before | After | Δ2 | p-value |
|---|---|---|---|---|---|---|
| 11.4 | 11.0 | +0.1 | 10.7 | 14.6 | +4.4 | *# |
| 254.3 | 244.7 | -12.9 | 236.0 | 259.1 | +18.2 | *# |
| 151.4 | 140.5 | -8.0 | 150.8 | 152.5 | +9.5 | |
| 69.4 | 73.5 | -4.5 | 69.7 | 73.6 | +3.0 | |
| 464.7 | 465.7 | -26.4 | 449.6 | 490.3 | +29.3 | *# |
| 186.4 | 170.8 | -6.2 | 173.0 | 189.8 | +17.2 | * |
| 234 | 209 | -21 | 250 | 223 | -16 | *# |
| 16.7 | 17.5 | +0.8 | 15.6 | 15.9 | +0.2 | |
| 75.5 | 68.3 | -5.3 | 65.9 | 74.8 | +6.8 | |
| 123 | 155 | +32 | 105 | 128 | +11 | |
| 10.60 | 10.20 | +0.50 | 11.30 | 9.96 | +0.10 | |
| 80 | 81 | +2 | 80 | 80 | +1 | |
| 5.6 | 4.5 | +0.1 | 6.2 | 5.2 | -0.2 | |
| 111 | 72 | -28 | 120 | 87 | -49 | * |
| 4.9 | 3.5 | -1.4 | 5.9 | 3.6 | -2.8 | * |
| 162 | 165 | -5 | 188 | 185 | -7 | # |
| 86 | 91 | -1 | 98 | 96 | -2 | # |
| 60 | 58 | -1 | 60 | 61 | +1 | |
| 1.12 | 0.88 | +0.11 | 1.21 | 1.02 | -0.09 | |
| 1.67 | 1.57 | -0.01 | 1.79 | 1.64 | -0.13 |
n = 7. Variables are given as the medians (minimum value to maximum value).
3.3. URINARY METABOLIC PARAMETERS
The daily changes and pooled mean data for the excretion levels of urinary creatinine, UN, 3-MH, cortisol, CPR, and catecholamines (adrenaline, noradrenaline, dopamine) are shown in Table 3. The Δ urinary UN, Δ urinary CPR, Δ urinary noradrenaline, and Δ urinary dopamine values are shown in Figure 3.
| Day | Creatinine (mg) | UN (mg) | 3-MH (μmol) | CPR (μg) | Cortisol (μg) | Dopamine (μg) | Noradrenaline (μg) | Adrenaline (μg) |
|---|---|---|---|---|---|---|---|---|
| 1 | 1568 (1356 to 1816) | 1719 (1367 to 1891) | 8763 (7439 to 10306) | 8382 (5677 to 9481) | 268.6 (207.2 to 339.7) | 285.1 (193.7 to 312.4) | 56.4 (47.2 to 90.0) | 55.0 (44.6 to 74.7) |
| 2 | 1706 (1174 to 1875) | 1690 (1384 to 1946) | 8168 (6164 to 9645) | 8390 (6190 to 9171) | 266.3 (175.0 to 288.6) | 268.7 (192.3 to 276.3) | 47.3 (31.6 to 119.6) | 51.6 (45.6 to 77.3) |
| 3 | 1625 (1348 to 1860) | 1720 (1386 to 1879) | 8300 (6889 to 9032) | 8232 (6723 to 8913) | 252.5 (201.5 to 286.5) | 262.4 (195.1 to 279.9) | 58.5 (43.7 to 118.7) | 65.1 (42.7 to 74.2) |
| 4 | 1675 (1247 to 1911) | 1647 (1406 to 1931) | 8146 (6211 to 9286) | 10134 (9612 to 11790) | 263.7 (186.8 to 304.3) | 264.5 (213.5 to 284.2) | 51.2 (30.8 to 96.8) | 65.7 (47.0 to 100.3) |
| 5 | 1675 (1411 to 1942) | 1654 (1211 to 1904) | 8228 (7221 to 8418) | 12630 (8780 to 13863) | 258.4 (209.6 to 322.2) | 255.6 (173.4 to 306.8) | 62.7 (37.0 to 87.5) | 58.5 (40.3 to 87.3) |
| 6 | 1691 (1003 to 1827) | 1717 (1414 to 1939) | 8096 (4737 to 8758) | 13348 (11756 to 14449) | 257.0 (155.8 to 312.2) | 252.8 (210.0 to 318.5) | 49.7 (33.3 to 98.2) | 64.0 (45.9 to 96.2) |
| Day 4-6 | 1685 (1330 to 1885) | 1651 (1348 to 1923) | 8062 * | 12086 *# | 257.4 (201.9 to 312.9) | 258.0 (202.2 to 303.2) | 54.2 (33.7 to 94.2) | 58.8 (44.4 to 94.6) |
n = 7. Variables are given as the medians (minimum value to maximum value).

Fig. 3. Comparison of the degree of change from the 3rd day of the adjustment period to the average value for the 3 days of the treatment period (Δ), n = 7. Data are shown as the median (minimum value – maximum value).
Urinary creatinine excretion levels remained fairly constant during both the non-HP + Ex and HP + Ex periods, with no significant difference between the two periods. Urinary UN excretion levels remained unchanged during the non-HP + Ex period but increased significantly during the HP + Ex period and were significantly higher during the HP + Ex period than during the non-HP + Ex period. Furthermore, the Δ urinary UN (amount of increase) was significantly greater during the HP + Ex period than during the non-HP + Ex period. Urinary 3-MH excretion levels remained unchanged during both the non-HP + Ex and HP + Ex periods, with no difference between the two periods in Δ urinary 3-MH. Urinary cortisol excretion levels remained almost unchanged during both periods. Urinary CPR excretion levels decreased significantly during the non-HP + Ex period but remained unchanged during the HP + Ex period, and the excretion levels were significantly lower during the non-HP + Ex period than during the HP + Ex period. The Δ urinary CPR (amount of decrease) was significantly greater during the non-HP + Ex period than during the HP + Ex period.
Urinary creatinine excretion levels remained fairly constant during the HP + Ex period. With regard to catecholamines, urinary adrenaline excretion levels were significantly higher during the HP + Ex period than during the non-HP + Ex period. Excretion levels of noradrenaline and dopamine were significantly increased during the HP + Ex period and significantly higher during the HP + Ex period compared with the non-HP + Ex period. The Δ urinary noradrenaline and Δ urinary dopamine (amount of increase) were significantly greater during the HP + Ex period than during the non-HP + Ex period.
3.4. CORRELATIONS AMONG BLOOD AND URINARY METABOLIC PARAMETERS
Spearman’s correlation coefficients (Δ during both the non–HP + Ex and HP + Ex periods [n = 14]) were calculated to examine the relationships among glucose and lipid metabolism–related parameters (Table 4) and among protein-related parameters and urinary catecholamines (Table 5).
| Δ HOMA-IR | Δ TG (mg/dl) | Δ RLP-C (mg/dl) | Δ TC (mg/dl) | Δ LDL-C (mg/dl) | Δ HDL-C (mg/dl) | Δ AI | |
|---|---|---|---|---|---|---|---|
| Δ HOMA-IR | ― | 0.122 | 0.331 | 0.355 | 0.400 | -0.149 | 0.641* |
| Δ TG (mg/dl) | ― | 0.918*** | -0.463 | -0.482 | -0.672** | 0.180 | |
| Δ RLP-C (mg/dl) | ― | ― | -0.220 | -0.215 | -0.717** | 0.449 | |
| Δ TC (mg/dl) | ― | ― | ― | 0.924*** | 0.475 | 0.645* | |
| Δ LDL-C (mg/dl) | ― | ― | ― | ― | 0.329 | 0.737** | |
| Δ HDL-C (mg/dl) | ― | ― | ― | ― | ― | -0.207 | |
| Δ AI | ― | ― | ― | ― | ― | ― |
* p<0.05, **p<0.01, ***p<0.001 HOMA-IR, Homeostatic Model Assessment for Insulin Resistance; TG, serum triglyceride; RLP-C, remnant lipoprotein-cholesterol; TC, total cholesterol; LDL-C, low density lipoprotein-cholesterol; HDL-C, high density lipoprotein-cholesterol; AI (atherosclerosis index), (TC – HDL-C) / HDL-C ratio.
| Δ UN (mg/dl) | Δ Valine (nmol/ml) | Δ Leucine (nmol/ml) | Δ Isoleucine (nmol/ml) | Δ BCAAs (nmol/ml) | Δ Lysine (nmol/ml) | Δ UN (mg/day) | Δ Adrenaline (μg/day) | Δ Noradrenaline (μg/day) | Δ Dopamine (μg/day) | |
|---|---|---|---|---|---|---|---|---|---|---|
| Δ UN (mg/dl) | ― | 0.744** | 0.514 | 0.526 | 0.678** | 0.810*** | 0.343 | 0.431 | 0.440 | |
| Δ Valine (nmol/ml) | ― | 0.568* | 0.543* | 0.899*** | 0.785*** | 0.736** | 0.253 | 0.393 | 0.371 | |
| Δ Leucine (nmol/ml) | ― | ― | 0.706** | 0.783*** | 0.724** | 0.407 | 0.213 | 0.251 | 0.103 | |
| Δ Isoleucine (nmol/ml) | ― | ― | ― | 0.776** | 0.666** | 0.415 | -0.077 | 0.086 | -0.112 | |
| Δ BCAAs (nmol/ml) | ― | ― | ― | ― | 0.842*** | 0.618* | 0.196 | 0.354 | 0.152 | |
| Δ Lysine (nmol/ml) | ― | ― | ― | ― | ― | 0.723** | 0.112 | 0.442 | 0.165 | |
| Δ UN (mg/day) | ― | ― | ― | ― | ― | ― | 0.336 | 0.600* | 0.692** | |
| Δ Adrenaline (μg/day) | ― | ― | ― | ― | ― | ― | ― | 0.714** | 0.596* | |
| Δ Noradrenaline (μg/day) | ― | ― | ― | ― | ― | ― | ― | ― | 0.653* | |
| Δ Dopamine (μg/day) | ― | ― | ― | ― | ― | ― | ― | ― | ― |
* p<0.05, **p<0.01, ***p<0.001 UN, urea nitrogen; BCAAs, branched chain amino acids.
4. Discussion
The present study examined the effects of exercise in combination with consumption of BCAA-rich fat-free milk or without consumption on protein-related, muscle synthesis– and breakdown–related, and glucose and lipid metabolism–related parameters, based on the hypothesis that serum insulin and urinary CPR excretion levels would increase during exercise when consuming fat-free milk compared with not consuming fat-free milk. We examined potential differences in muscle protein synthesis– and breakdown–related parameters and glucose and lipid metabolism–related parameters between subjects who consumed BCAA-rich fat-free milk and those who did not.
The primary results of the study were as follows. First, serum UN, plasma BCAAs and urinary UN excretion levels increased significantly with consumption of fat-free milk, whereas serum IGF-1 levels decreased significantly after both the non–HP + Ex and HP + Ex periods. Urinary CPR excretion levels were significantly lower during the non–HP + Ex period than during the HP + Ex period, but serum TG and RLP-C levels were significantly decreased after both the non–HP + Ex and HP + Ex periods. Furthermore, there were no significant differences in Δ serum TG or Δ serum RLP-C between the two periods. An unexpected result was that urinary dopamine and noradrenaline excretion levels were significantly greater during the HP + Ex period than during the non–HP + Ex period.
4.1. PROTEIN-RELATED AND MUSCLE PROTEIN SYNTHESIS AND BREAKDOWN–RELATED PARAMETERS
Body weight, percent body fat, fat mass, and skeletal muscle mass remained almost unchanged during both the non–HP + Ex and HP + Ex periods, suggesting that a period of 3 days was not sufficient for detecting changes in body composition.
The increases in serum and urinary UN and plasma valine and BCAA levels during the HP + Ex period are thought to reflect the effects of fat-free milk intake. However, why leucine and isoleucine levels did not significantly change is unclear, although they may have been utilized as energy sources or for body protein synthesis. Plasma lysine levels were significantly higher after the HP + Ex period than after the non–HP + Ex period, and Δ plasma lysine (amount of increase) was significantly greater after the HP + Ex period than after the non–HP + Ex period. Lysine reportedly exerts a suppressing effect on muscle protein degradation.
To examine muscle protein metabolism, we measured serum IGF-1, myostatin, and testosterone levels as markers of anabolism, whereas serum and urinary cortisol levels were determined as markers of catabolism. Serum IGF-1 levels were significantly decreased after both the non–HP + Ex and HP + Ex periods, and there was no difference in Δ serum IGF-1 (amount of decrease). Nutritional factors such as energy and the quality and quantity of protein affect IGF-1 biosynthesis. Regarding the effects of exercise, it is known that exercise activates IGF-1 and that the blood concentration of growth hormone, which promotes IGF-1 production, increases transiently during exercise. In terms of acute effects, both endurance and resistance exercise reportedly increase total IGF-1 levels while leaving free IGF-1 unchanged. In terms of the effects of training, total IGF-1 levels are reportedly higher in the elderly, whereas they decrease up to the age of 40 and then increase after that age. By contrast, other reports indicate that total IGF-1 levels decrease. Schmits et al. reported that 15 weeks of twice-weekly strength training in women aged 30-50 years reduces body fat percentage, fasting insulin, BG, and total IGF-1 levels, whereas levels of IGF-binding protein (IGFBP)-1 and -3 and free IGF-1 remain unchanged. Sterczala et al. reported that 12 weeks of thrice-weekly strength training in women and men aged 21.7 ± 3.7 years increases lean body mass and cross-sectional area of the thigh and decreases basal levels of serum IGF-1, free IGF-1, IGFBP-2 and 3, whereas levels of IGFBP-1 and 4 are increased. Regarding the mechanism underlying the exercise-induced decrease in serum IGF-1 levels, Arnarson et al. hypothesized that “IGF-1 is redistributed from circulation into tissue during periods of active muscle building”, whereas Sterczala et al. hypothesized that “IGF-1’s effect on muscle hypertrophy is mediated by a training-induced repartitioning of IGF-1 among its various binding proteins, both in circulation and in the interstitium”. Although the mechanism is not fully understood, the findings of these studies suggest that in relatively young individuals, exercise training reduces serum IGF-1 levels, which in turn improves body composition and glucose metabolism. Therefore, the results of our previous and current studies suggest that the activity of IGF-1 is enhanced during exercise. However, it is unclear whether the effect of IGF-1 is amplified by the intake of fat-free milk.
No significant changes were observed in serum free-testosterone, myostatin, CK, cortisol, and urinary cortisol levels after the non–HP + Ex and HP + Ex periods. Testosterone is an androgenic-anabolic hormone that promotes muscle growth. Although serum testosterone levels increase with acute exercise, the effects of exercise are unlikely to be reflected in early morning, fasting samples, such as those examined in this experiment, and no clear exercise training effects are known. Myostatin (also known as GDF-8 (growth differentiation factor-8)) is primarily synthesized in skeletal muscle, where it inhibits muscle growth. Therefore, a decrease in the myostatin expression level results in an increase in muscle mass. It has also been shown that myostatin inhibition significantly alleviates the progression of obesity and diabetes, and exercise has been shown to reduce myostatin expression levels in skeletal muscle. Plasma myostatin levels also reportedly decrease after 6 months of regular aerobic exercise, but this effect may not be observed after only 3 days of exercise, as in this study. As serum CK levels did not increase significantly after either the non–HP + Ex or HP + Ex periods, it was thought that only a little muscle damage was incurred during the exercise in this study. Therefore, it was considered that cortisol was also not affected by the present experimental conditions. 3-MH, an indicator of the rate of muscle protein breakdown, is released into the blood and excreted in urine. In our previous study, urinary 3-MH excretion levels decreased during the fat-free milk intake period with no exercise and did not decrease during the fat-free milk intake period with exercise. Urinary 3-MH excretion levels were unchanged during both the non–HP + Ex and HP + Ex periods in the present study, suggesting that the muscle protein turnover rate was enhanced.
4.2. GLUCOSE AND LIPID METABOLISM–RELATED PARAMETERS
In our previous study, urinary CPR excretion levels increased during the fat-free milk intake period with no exercise but showed no significant changes during the exercise period with fat-free milk intake. In the present study, urinary CPR excretion levels decreased significantly during the non–HP + Ex period but were unchanged during the HP + Ex period. An increase in insulin secretion due to protein intake was also confirmed under the exercise conditions in this study. By contrast, there were no differences in serum insulin levels between the two periods. Decreases in the plasma and urinary excretion levels of CPR due to exercise have been reported elsewhere. Serum TG and RLP-C levels were significantly decreased after both the non–HP + Ex and HP + Ex periods, and no significant differences were observed between the non–HP + Ex and HP + Ex periods in terms of Δ serum TG and Δ serum RLP-C. Furthermore, a highly significant correlation was observed between Δ serum TG and Δ serum RLP-C. No differences were observed in the levels of the other serum lipids, HOMA-IR, and AI between the non–HP + Ex and HP + Ex periods. Whether the intake of protein, particularly BCAAs, is associated with an increased risk of type 2 diabetes mellitus remains controversial. The findings of our present study showed that insulin secretion is not spared but also not increased as a result of exercise with consumption of BCAA-rich fat-free milk. Furthermore, the effects on glucose and lipid metabolism appeared to be similar regardless of whether or not fat-free milk is consumed. However, excessively high protein intake is associated with various adverse effects.
4.3. URINARY CATECHOLAMINE EXCRETION
Urinary dopamine excretion levels were significantly increased only during the HP + Ex period and not during the non–HP + Ex period. Urinary excretion levels of dopamine, noradrenaline, and adrenaline were all significantly higher during the HP + Ex period compared with the non–HP + Ex period. Dopamine deficiency is often discussed in terms of its psychological effects, as well as its connection to Parkinson’s disease. From a physiological perspective, dopamine reportedly plays roles in the regulation of cardiovascular and renal function, as well as muscle tone, visual processing, calcium homeostasis, protein synthesis, and conceivably, the optimal utilization of food. There are also reports that dopamine is involved in thermoregulation. In our previous study, female subjects consumed fat-free milk during both the non-exercise and exercise periods, and the energy expended through exercise was not replenished. As a result, urinary dopamine excretion did not change and did not differ between the two periods. In this study, the experimental conditions were set as with or without consumption of fat-free milk during the two exercise periods, and the energy expended through exercise was replenished. The significance and mechanism of the differences in urinary dopamine excretion and adrenal medulla/sympathetic nervous system function between the two exercise periods are unknown. But significant correlations were observed between Δ urinary dopamine and Δ urinary UN, suggesting that consuming fat-free milk during exercise under conditions of sufficient energy supply may increase dopamine production.
5. Conclusion
A high-protein diet during exercise attenuates the insulin-sparing effects but does not affect the effects on glucose and lipid metabolism, although its effects on body protein synthesis are unclear. The combination of a high-protein diet and exercise is suggested to be an effective regimen for sarcopenic obesity.
Conflicts of interest statement
The authors have no conflicts of interest to declare.
Funding statement
This study was supported by JSPS KAKENHI grant number JP15K00852.
Acknowledgements
The authors would like to thank the staff of our laboratory for their cooperation in this study, Dr. Ai Teramoto (Department of Nutrition and Dietetics, Kanto Gakuin University) for preparing the experimental diets and thank FORTE Science Communications for English language editing.
References
- Peterseim CM, Jabbour K, Kamath Mulki A. Metabolic Syndrome: An updated review on diagnosis and treatment for primary care clinicians. J Prim Care Community Health. Jan-Dec, 2024;15:21501319241309168. doi.org/10.1177/21501319241309168
- Wang H, Liu L, Tan Z, Zhou Y, Zhang J, Zhai L, et al. Research progress of sarcopenia: Diagnostic advancements, molecular mechanisms, and therapeutic strategies. Exp Mol Pathol. Aug 14, 2025;143:104992. doi.org/10.1016/J.YEXMP.2025.104992
- Castro-Barquero S, Ruiz-León AM, Sierra-Pérez M, Estruch R, Casas R. Dietary strategies for metabolic syndrome: A comprehensive review. Nutrients. Sep 29, 2020;12:2983. doi.org/10.3390/NU12102983
- Holloszy JO. A forty-year memoir of research on the regulation of glucose transport into muscle. Am J Physiol Endocrinol Metab. 2003;284:E453-467. doi.org/10.1152/AJPENDO.00463.2002
- Rodahl K, Miller HI, Issekutz B. Plasma free fatty acids in exercise. J Appl Physiol. 1964;19:489–492. doi.org/10.1152/JAPPL.1964.19.3.489
- Carlson LA, Mossfeldt F. Acute effects of prolonged, heavy exercise on the concentration of plasma lipids and lipoproteins in man. Acta Physiol Scand. 1964;62:51–59. doi.org/10.1111/J.1748-1716.1964.TB03951.X
- Papadopoulou SK, Papadimitriou K, Voulgaridou G, et al. Exercise and nutrition impact on osteoporosis and sarcopenia—the incidence of osteosarcopenia: A narrative review. Nutrients. Dec 16, 2021;13:4499. doi.org/10.3390/NU13124499
- Mang ZA, Ducharme JB, Mermier C, Kravitz L, De Castro Magalhaes F, Amorim F. Aerobic adaptations to resistance training: The role of time under tension. Int J Sports Med. 2022;43:829–839. doi.org/10.1055/A-1664-8701
- Ganong WF. Review of medical physiology, 9th ed., Lange Medical Publications, Los Altos, 1979
- Millward DJ, Bowtell JL, Pacy P, Rennie MJ. Physical activity, protein metabolism and protein requirements. Proc Nutr Soc. 1994;53:223–240. doi.org/10.1079/PNS19940024
- MacLean DA, Graham TE, Saltin B. Branched-chain amino acids augment ammonia metabolism while attenuating protein breakdown during exercise. Am J Physiol Endocrinol Metab. 1994;267:E1010–1022. doi.org/10.1152/AJPENDO.1994.267.6.E1010
- Kimball SR. The role of nutrition in stimulating muscle protein accretion at the molecular level. Biochem Soc Trans. 2007;35:1298–1301. doi.org/10.1042/BST0351298
- Berger S, Vongaraya N. Insulin response to ingested protein in diabetes. Diabetes. 1966;15:303–306. doi.org/10.2337/DIAB.15.5.303
- Holt SHA, Brand Miller JC, Petocz P. An insulin index of foods: The insulin demand generated by 1000-kJ portions of common foods. Am J Clin Nutr. 1997;66:1264–1276. doi.org/10.1093/ajcn/66.5.1264
- Nuttall FQ, Gannon MC. Metabolic response of people with type 2 diabetes to a high protein diet. Nutr Metab (Lond). Sep 13, 2004;1. doi.org/10.1186/1743-7075-1-6
- Rennie MJ, Edwards RHT, Krywawych S, et al. Effect of exercise on protein turnover in man. Clin Sci. 1981;61:627–639. doi.org/10.1042/CS0610627
- Richter EA, Sylow L, Hargreaves M. Interactions between insulin and exercise. Biochem J. 2021;478:3827–3846. doi.org/10.1042/BCJ20210185
- Yamada T, Kurasawa S, Matsuzaki M, Tanaka A. Remnant lipoprotein metabolism is improved more when body weight is reduced by exercise than by dietary restriction. Clin Chim Acta. 2008;388:28–32. doi.org/10.1016/j.cca.2007.09.022
- Yamada T, Kurasawa S, Matsuzaki M, Tanaka A. Body weight reduction by exercise increases the urinary 3-methylhistidine excretion level with relatively positive nitrogen, sodium, and potassium balances when compared to dietary restriction. Heliyon. Sep 1, 2023;9:e19632. doi.org/10.1016/j.heliyon.2023.e19632
- Yamada T, Okada M, Matsuzaki M, Tanaka A. The effects of endurance physical exercise with fat-free milk intake as a therapy for metabolic syndrome and/or sarcopenia. Med Res Arch [online]. Mar 31, 2024;12 doi.org/10.18103/mra.v12i3.5158
- Faul F, Erdfelder E, Lang AG, Buchner A. G*Power 3: A flexible statistical power analysis program for the social, behavioral, and biomedical sciences. Behav Res Methods. 2007;39:175–191. doi.org/10.3758/BF03193146
- Faul F, Erdfelder E, Buchner A, Lang AG. Statistical power analyses using G*Power 3.1: Tests for correlation and regression analyses. Behav Res Methods. 2009;41:1149–1160. doi.org/10.3758/BRM.41.4.1149
- Ministry of Health and Welfare, Japan. Dietary Reference Intakes for Japanese, 2015, DAI-ICHI Shuppan Publishing, Tokyo, 2014
- Report of the Subdivision on Resources, The Council for Science and Technology, Ministry of Education, Culture, Sports, Science and Technology, Japan. Standard Tables of Food Composition in Japan, 2015 (Seventh Revised Edition), Official Gazette Co-operation of Japan, Tokyo, 2015
- Kaneko K, Inayama T, Koike G. Utilization of soy protein isolate mixed with rice protein in Japanese women. J Nutr Sci Vitaminol (Tokyo). 1985;31:99–106. doi.org/10.3177/JNSV.31.99
- Takahashi T, Yamada T. Effect of supplementing methionine to soy protein isolate on the protein utilization in male adult humans. Nutr Sci Soy Protein (Japan). 1984;5:94-98.
- Sato T, Ito Y, Nagasawa T. Regulation of skeletal muscle protein degradation and synthesis by oral administration of lysine in rats. J Nutr Sci Vitaminol (Tokyo). 2013;59:412–419. doi.org/10.3177/JNSV.59.412
- Kraemer WJ, Ratamess NA, Nindl BC. Recovery responses of testosterone, growth hormone, and IGF-1 after resistance exercise. J Appl Physiol. 2017;122:549–558. doi.org/10.1152/JAPPLPHYSIOL.00599.2016
- Janssen JAMJL. Impact of Physical Exercise on Endocrine Aging. Front Horm Res. 2016;47:68–81. doi.org/10.1159/000445158
- Kraemer WJ, Ratamess NA, Hymer WC, Nindl BC, Fragala MS. Growth hormone(s), testosterone, insulin-Like growth factors, and cortisol: Roles and integration for cellular development and growth with exercise. Front Endocrinol (Lausanne). Feb 25, 2020;11:33. doi.org/10.3389/FENDO.2020.00033
- Schakman O, Kalista S, Barbé C, Loumaye A, Thissen JP. Glucocorticoid-induced skeletal muscle atrophy. Int J Biochem Cell Biol. 2013;45:2163–2172. doi.org/10.1016/j.biocel.2013.05.036
- Thissen JP, Ketelslegers JM, Underwood LE. Nutritional Regulation of the Insulin-Like Growth Factors. Endocr Rev. 1994;15:80–101. doi.org/10.1210/EDRV-15-1-80
- Adamo ML, Farrar RP. Resistance training, and IGF involvement in the maintenance of muscle mass during the aging process. Ageing Res Rev. 2006;5:310–331. doi.org/10.1016/j.arr.2006.05.001
- Weltman A, Wideman L, Weltman JY, Veldhuis JD. Neuroendocrine control of GH release during acute aerobic exercise. J Endocrinol Invest. 2003;26:843–850. doi.org/10.1007/BF03345234
- de Alcantara Borba D, da Silva Alves E, Rosa JPP, et al. Can IGF-1 serum levels really be changed by acute physical exercise? A systematic review and meta-analysis. J Phys Act Health. 2020;17:575–584. doi.org/10.1123/JPAH.2019-0453
- Vale RG de S, de Oliveira RD, Pernambuco CS, de Meneses YP da SF, Novaes J da S, de Andrade A de FD. Effects of muscle strength and aerobic training on basal serum levels of IGF-1 and cortisol in elderly women. Arch Gerontol Geriatr. 2009;49:343–347. doi.org/10.1016/j.archger.2008.11.011
- Jiang Q, Lou K, Hou L, et al. The effect of resistance training on serum insulin-like growth factor 1(IGF-1): A systematic review and meta-analysis. Complement Ther Med. May, 2020;50:102360. doi.org/10.1016/j.ctim.2020.102360
- Schmitz KH, Ahmed RL, Yee D. Effects of a 9-month strength training intervention on insulin, insulin-like growth factor (IGF)-I, IGF-binding protein (IGFBP)-1, and IGFBP-3 in 30-50-year-old women. Cancer Epidemiol Biomarkers Prev. 2002;11:1597-1604. https://aacrjournals.org/cebp/article/11/12/1597/252980/Effects-of-a-9-Month-Strength-Training?searchresult=1
- Sterczala AJ, Pierce JR, Barnes BR, et al. Insulin-like growth factor-I biocompartmentalization across blood, interstitial fluid and muscle, before and after 3 months of chronic resistance exercise. J Appl Physiol. 2022;133:170–182. doi.org/10.1152/JAPPLPHYSIOL.00592.2021
- Arnarson A, Geirsdottir OG, Ramel A, Jonsson PV, Thorsdottir I. Insulin-like growth factor-1 and resistance exercise in community dwelling old adults. J Nutr Health Aging. 2015;19:856–860. doi.org/10.1007/s12603-015-0547-3
- Kraemer WJ, Gordon SE, Fleck SJ, et al. Endogenous anabolic hormonal and growth factor responses to heavy resistance exercise in males and females. Int J Sports Med. 1991;12:228–235. doi.org/10.1055/S-2007-1024673
- Hakkinen K, Pakarinen A. Acute hormonal responses to two different fatiguing heavy-resistance protocols in male athletes. J Appl Physiol. 1993;74:882–887. doi.org/10.1152/JAPPL.1993.74.2.882
- Potter NJ, Tomkinson GR, Dufner TJ, et al. Effects of exercise training on resting testosterone concentrations in insufficiently active men: A systematic review and meta-Analysis. J Strength Cond Res. 2021;35:3521–3528. doi.org/10.1519/JSC.0000000000004146
- Gonzalez-Gil AM, Elizondo-Montemayor L. The role of exercise in the interplay between myokines, hepatokines, osteokines, adipokines, and modulation of inflammation for energy substrate redistribution and fat mass loss: A review. Nutrients. Jun 26, 2020;12:1899. doi.org/10.3390/NU12061899
- Allen DL, Hittel DS, McPherron AC. Expression and function of myostatin in obesity, diabetes, and exercise adaptation. Med Sci Sports Exerc. 2011;43:1828–1835. doi.org/10.1249/MSS.0B013E3182178BB4
- Hittel DS, Axelson M, Sarna N, Shearer J, Huffman KM, Kraus WE. Myostatin decreases with aerobic exercise and associates with insulin resistance. Med Sci Sports Exerc. 2010;42:2023–2029. doi.org/10.1249/MSS.0B013E3181E0B9A8
- Young VR, Munro HN. Ntau-methylhistidine (3-methylhistidine) and muscle protein turnover: an overview. Fed Proc. 1978;37(9):2291-2300.
- Dohm GL, Williams RT, Kasperek GJ, Van Rij AM. Increased excretion of urea and N(τ)-methylhistidine by rats and humans after a bout of exercise. J Appl Physiol Respir Environ Exerc Physiol. 1982;52:27–33. doi.org/10.1152/JAPPL.1982.52.1.27
- Viru A. Mobilisation of Structural Proteins During Exercise. Sports Med. 1987;4:95–128. doi.org/10.2165/00007256-198704020-00003
- Galbo H, Tobin L, Van Loon LJC. Responses to acute exercise in type 2 diabetes, with an emphasis on metabolism and interaction with oral hypoglycemic agents and food intake. Appl Physiol Nutri Metab. 2007;32:567–575. doi.org/10.1139/H07-029
- Sonoda R, Tanaka K, Kikuchi T, et al. C-peptide level in fasting plasma and pooled urine predicts HbA1c after hospitalization in patients with type 2 diabetes mellitus. PLoS One. Feb 5, 2016;11:e0147303. doi.org/10.1371/JOURNAL.PONE.0147303